In the following figure the curves have been drawn between the photoelectric current and the potential difference applied at the cathode with respect to anode at four different intensities, the stopping potential is represent by
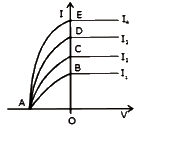
OA
OB
OC
OD
The correct Answer is:A
Step by step video, text & image solution for In the following figure the curves have been drawn between the photoelectric current and the potential difference applied at the cathode with respect to anode at four different intensities, the stopping potential is represent by by Physics experts to help you in doubts & scoring excellent marks in Class 12 exams.
Updated on:21/07/2023Topper's Solved these Questions
- PHOTOELECTRIC EFFECT Book:MOTIONChapter:PHOTOELECTRIC EFFECT Exercise:EXERCISE-2 (OBJECTIVE QUESTIONS (NEET))
Explore 17 Videos
- PHOTOELECTRIC EFFECT Book:MOTIONChapter:PHOTOELECTRIC EFFECT Exercise:EXERCISE - 3 SECTION -A (Previous Year Problems (NEET ))
Explore 38 Videos
- PHOTOELECTRIC EFFECT Book:MOTIONChapter:PHOTOELECTRIC EFFECT Exercise:QUESTIONS FOR PRACTICE
Explore 12 Videos
- OPTICSBook:MOTIONChapter:OPTICSExercise:Exercise
Explore 45 Videos
- PROJECTILE MOTIONBook:MOTIONChapter:PROJECTILE MOTIONExercise:EXERCISE-3 (SECTION-B)
Explore 8 Videos
Similar Questions
Knowledge Check
The relation between current and potential difference is given by
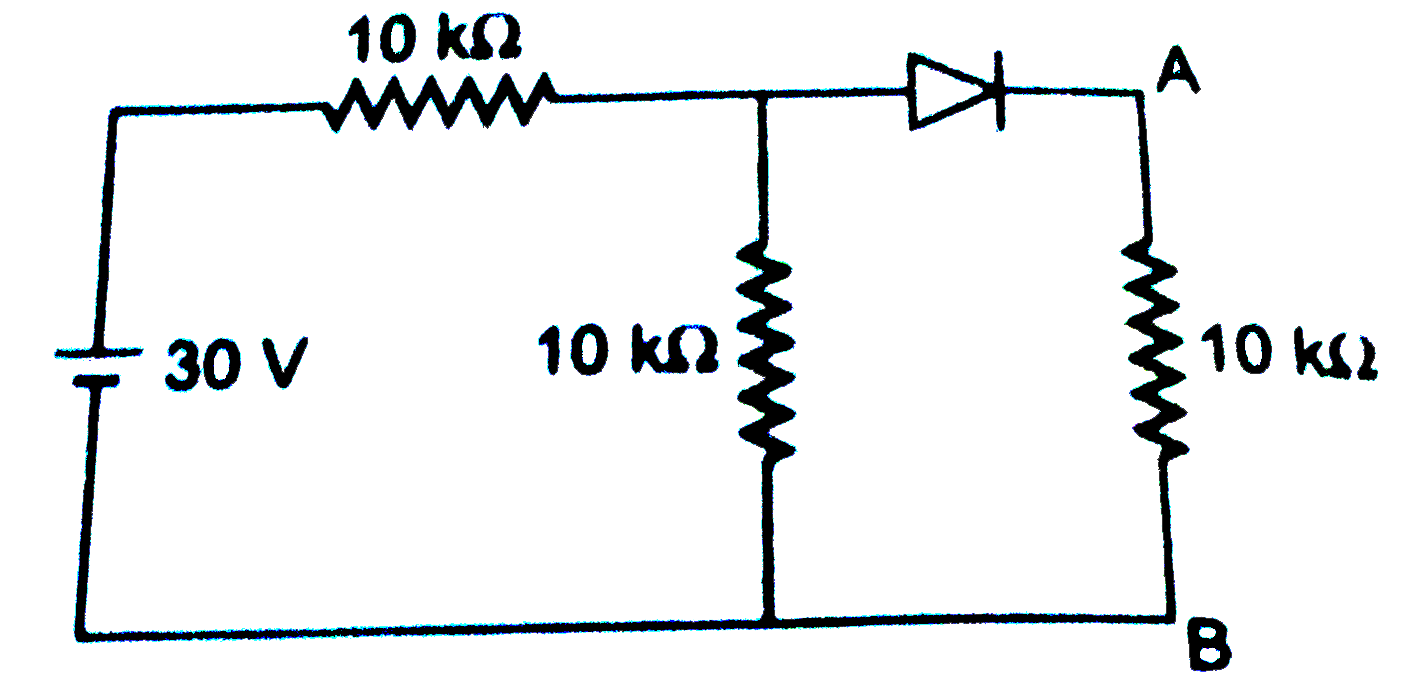
AOhm's lawBCoulomb's lawCKirchhoff's lawDNewton's lawIn the figure, potential difference between A & B is
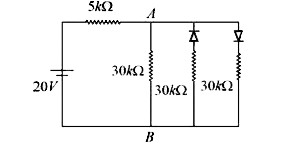 A5VB10VC15VD20V
When a potential difference is applied across, the current passing through
Aan insulator at 0 K is zeroBa semiconductor at 0 K is zeroCa metal at 0 K is finiteDa p-n diode at 300K is finite, if it is reverse biased
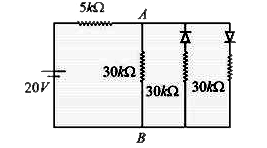
In the figure potential difference between A and B is :

View SolutionIn the figure, potential difference between A and B is
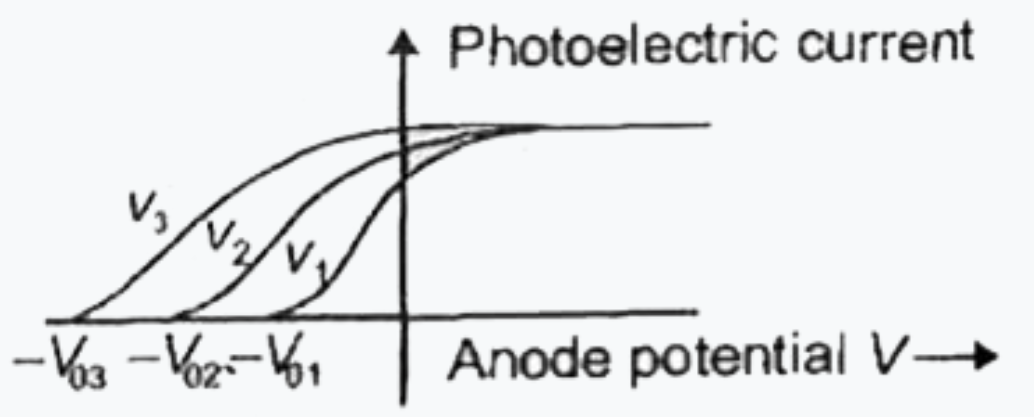
View SolutionIn photoelectric effect , the curve between photoelectric current and anode potential V (for different frequencies ) is shown in figure , then
View SolutionThe following four circuits have been made for studying the dependence of current on the potential difference across a resistor.
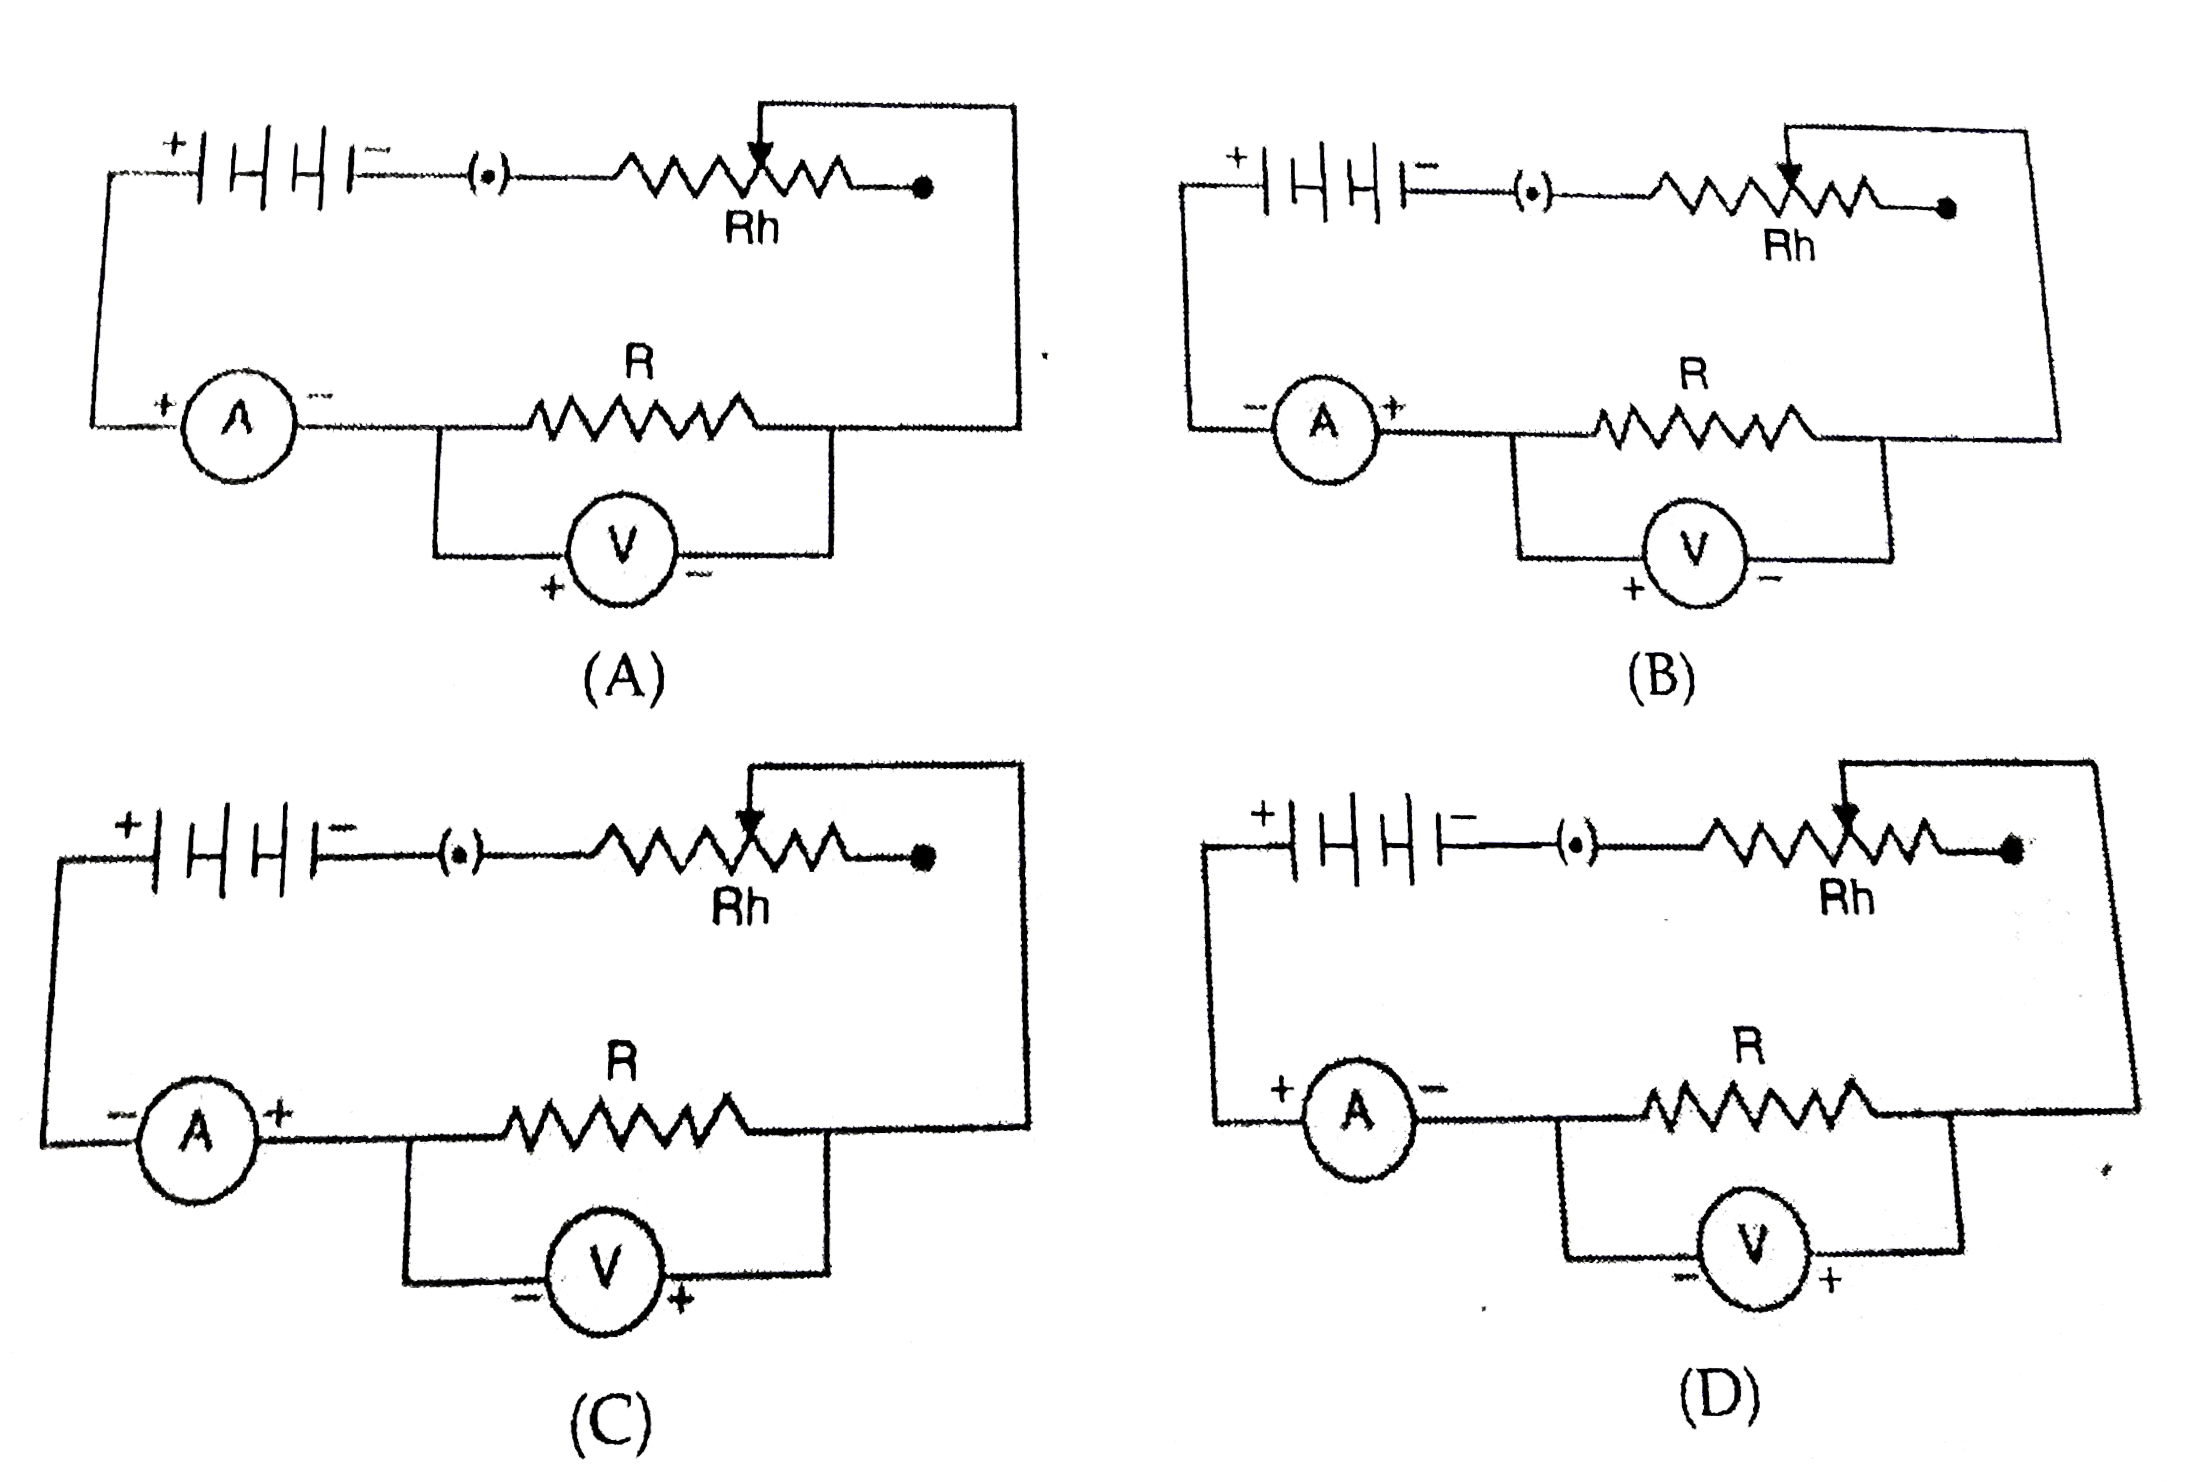
The correct circuit is :
View SolutionThe graph between photo electric current and cathode potential when the anode is kept at zero potential, for light of two different intensities out of the same frequency looks like the one:
View Solution


