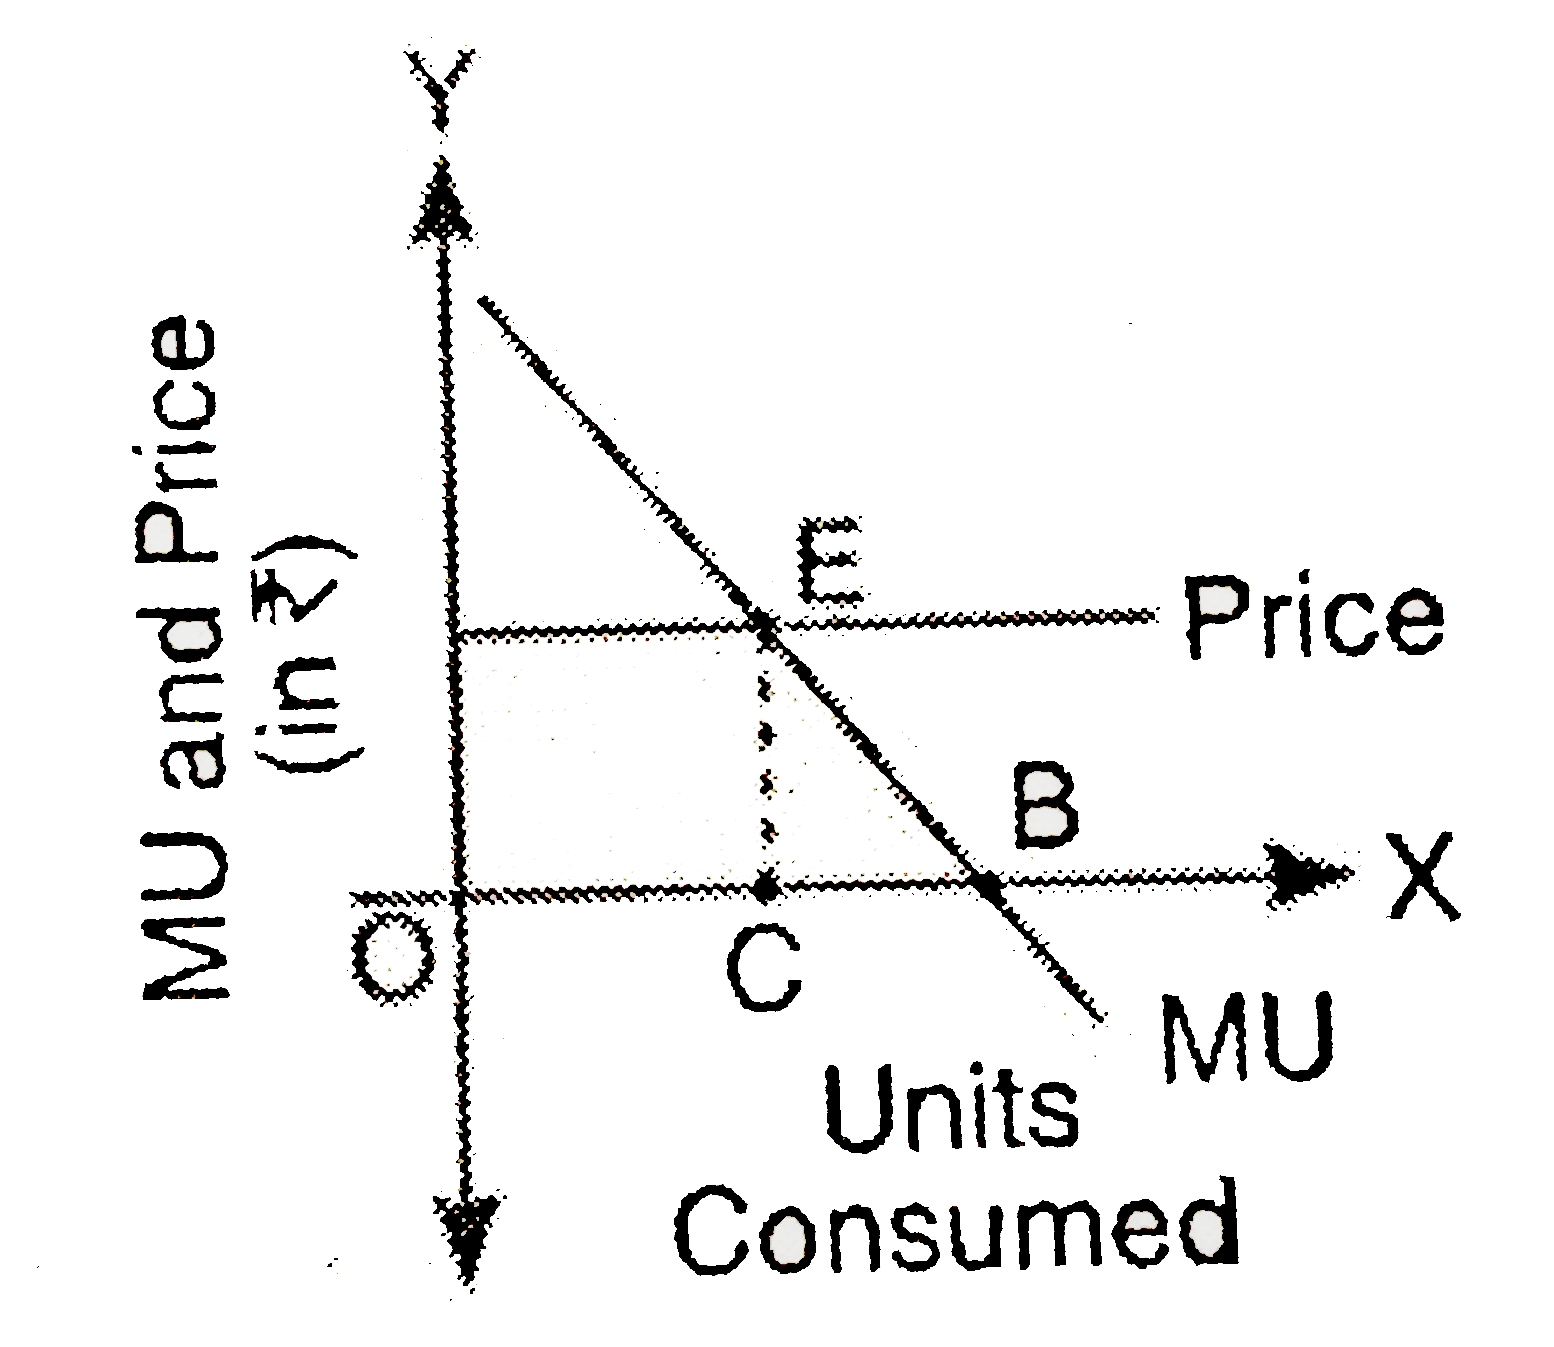
In the following diagram, the situation of Consumer's Equilibrium and Point of Satiety are represented by the points:

A
Point C and Point E
B
Point E and Point B
C
Point B and Point E
D
Point B and Point C
Video Solution
Text Solution
The correct Answer is:B
|
Answer
Step by step video, text & image solution for In the following diagram, the situation of Consumer's Equilibrium and Point of Satiety are represented by the points: by Economics experts to help you in doubts & scoring excellent marks in Class 11 exams.
Updated on:21/07/2023Topper's Solved these Questions
Similar Questions
Knowledge Check
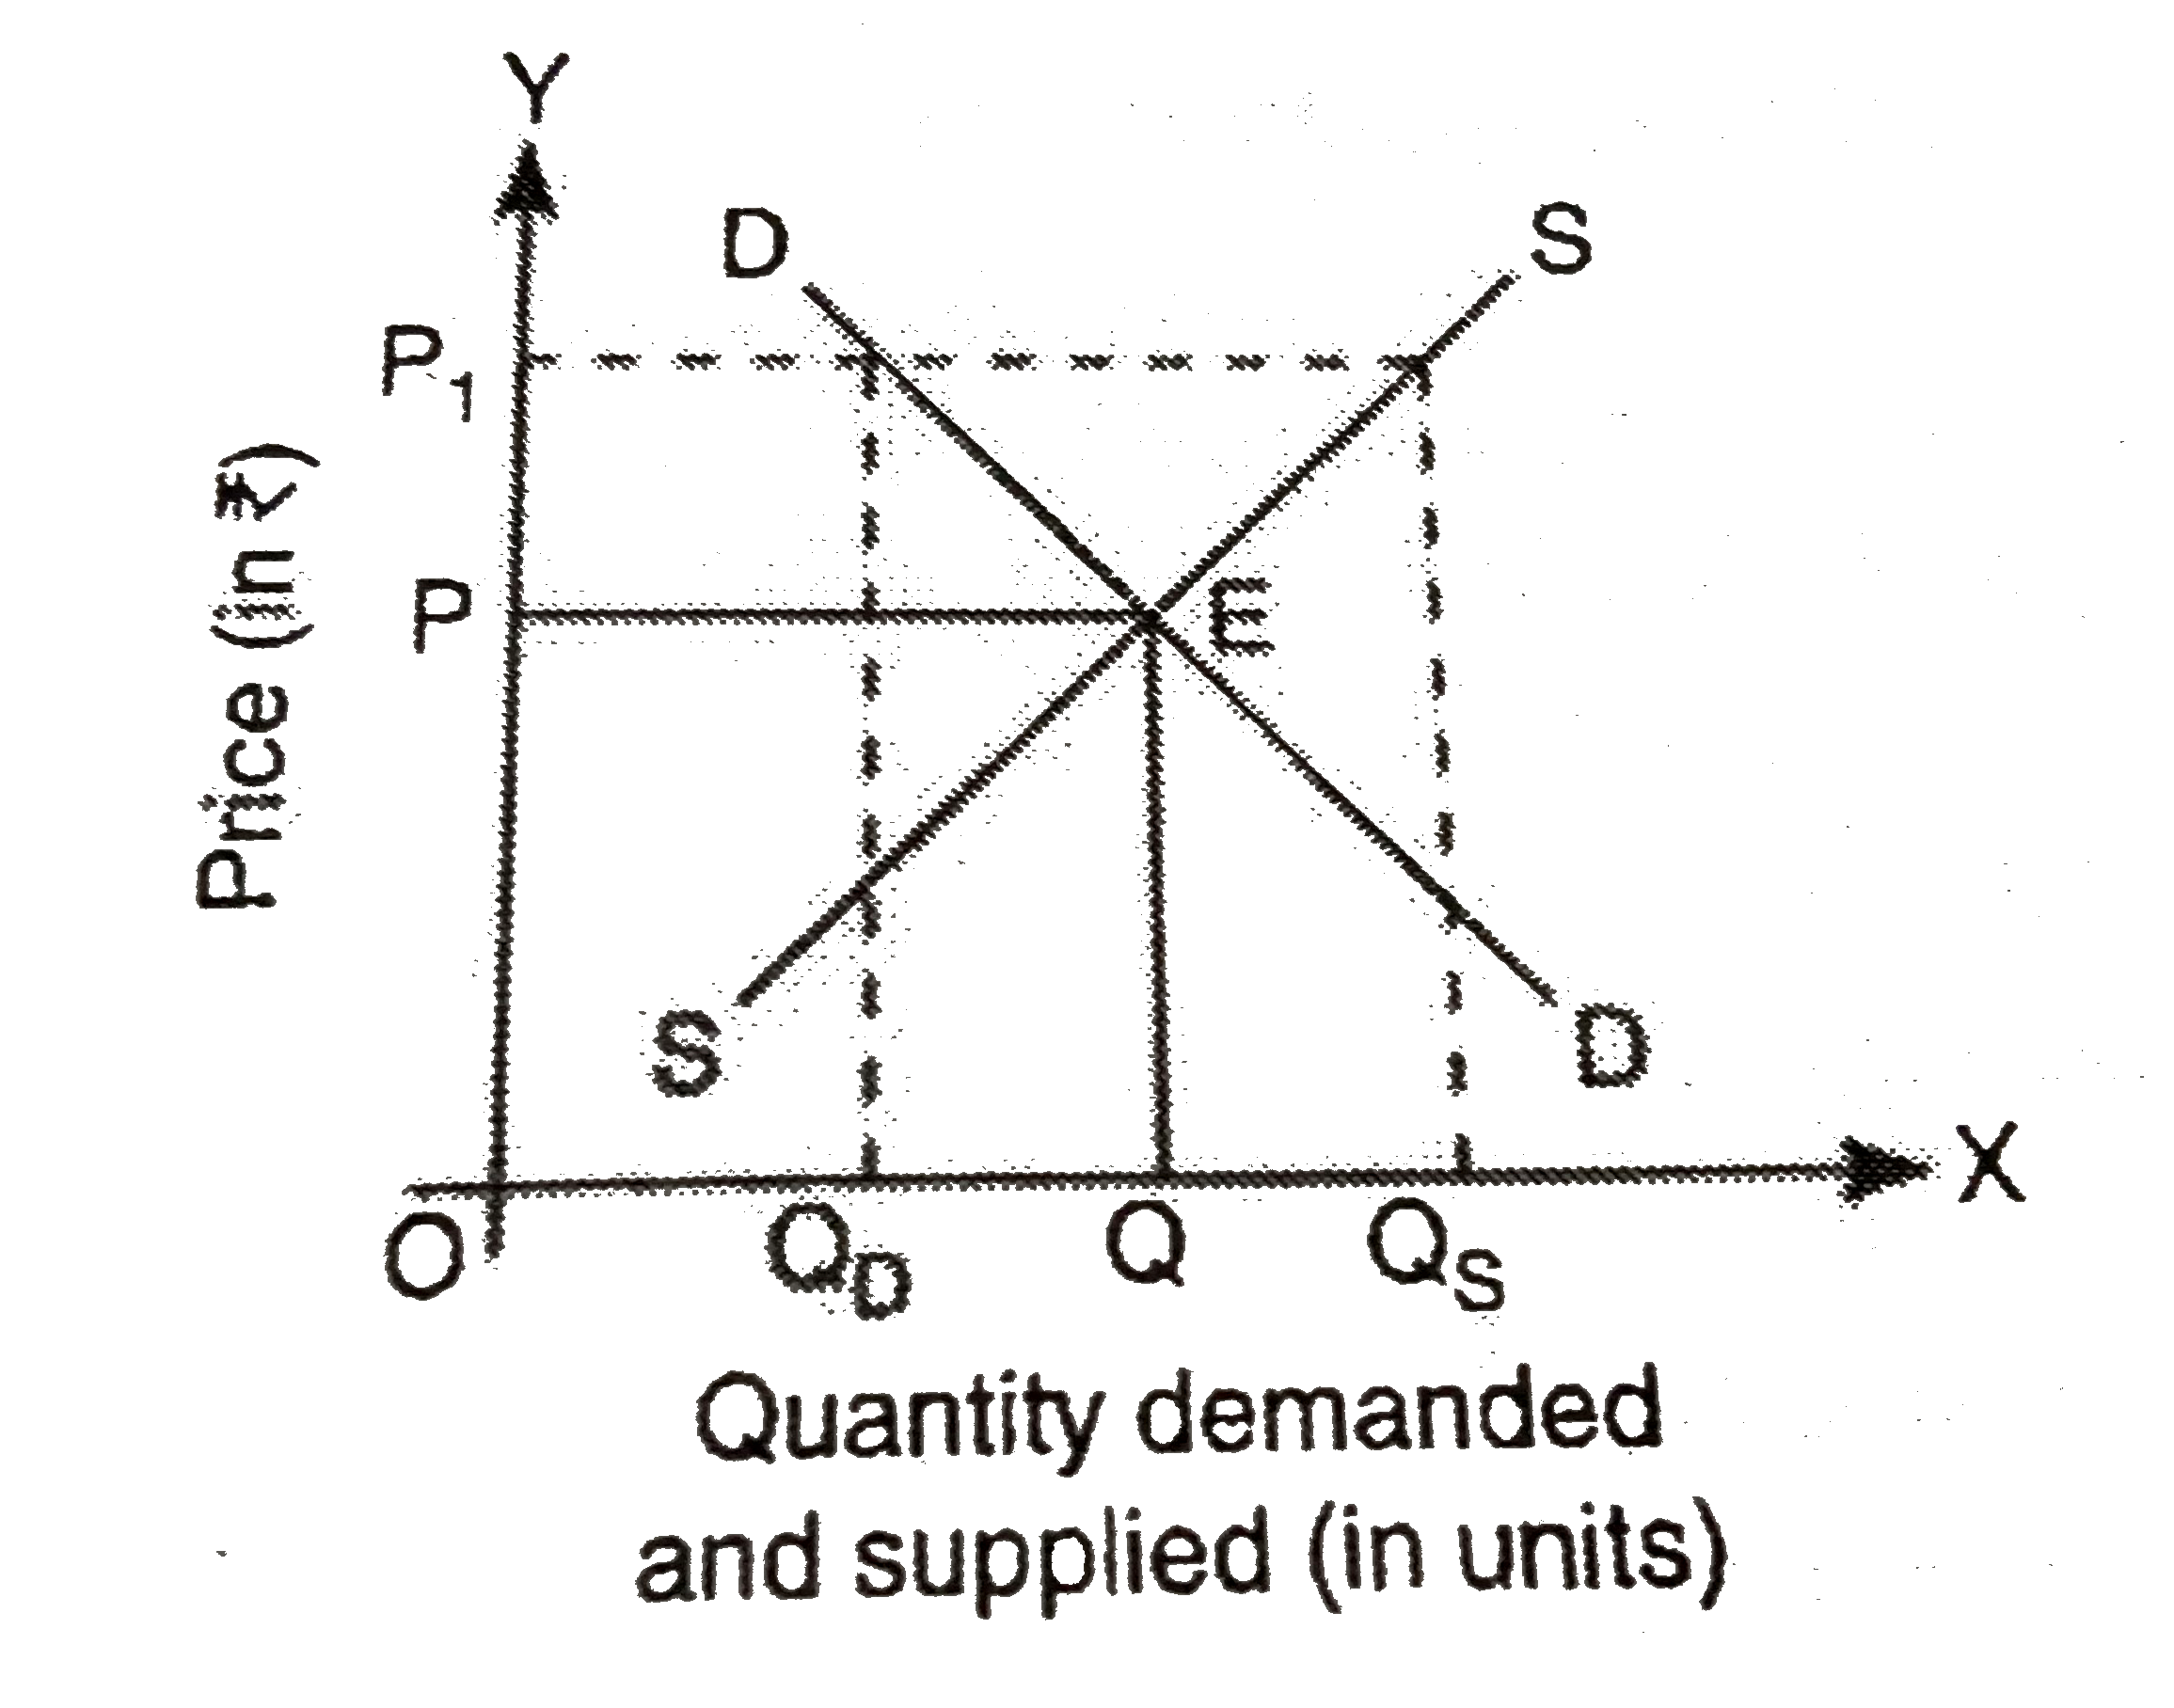
The following diagram depicts the situation of :
 AExcess SupplyBExcess DemandCEquilibrium ConditionDNone of these
At the Point of Satiety,
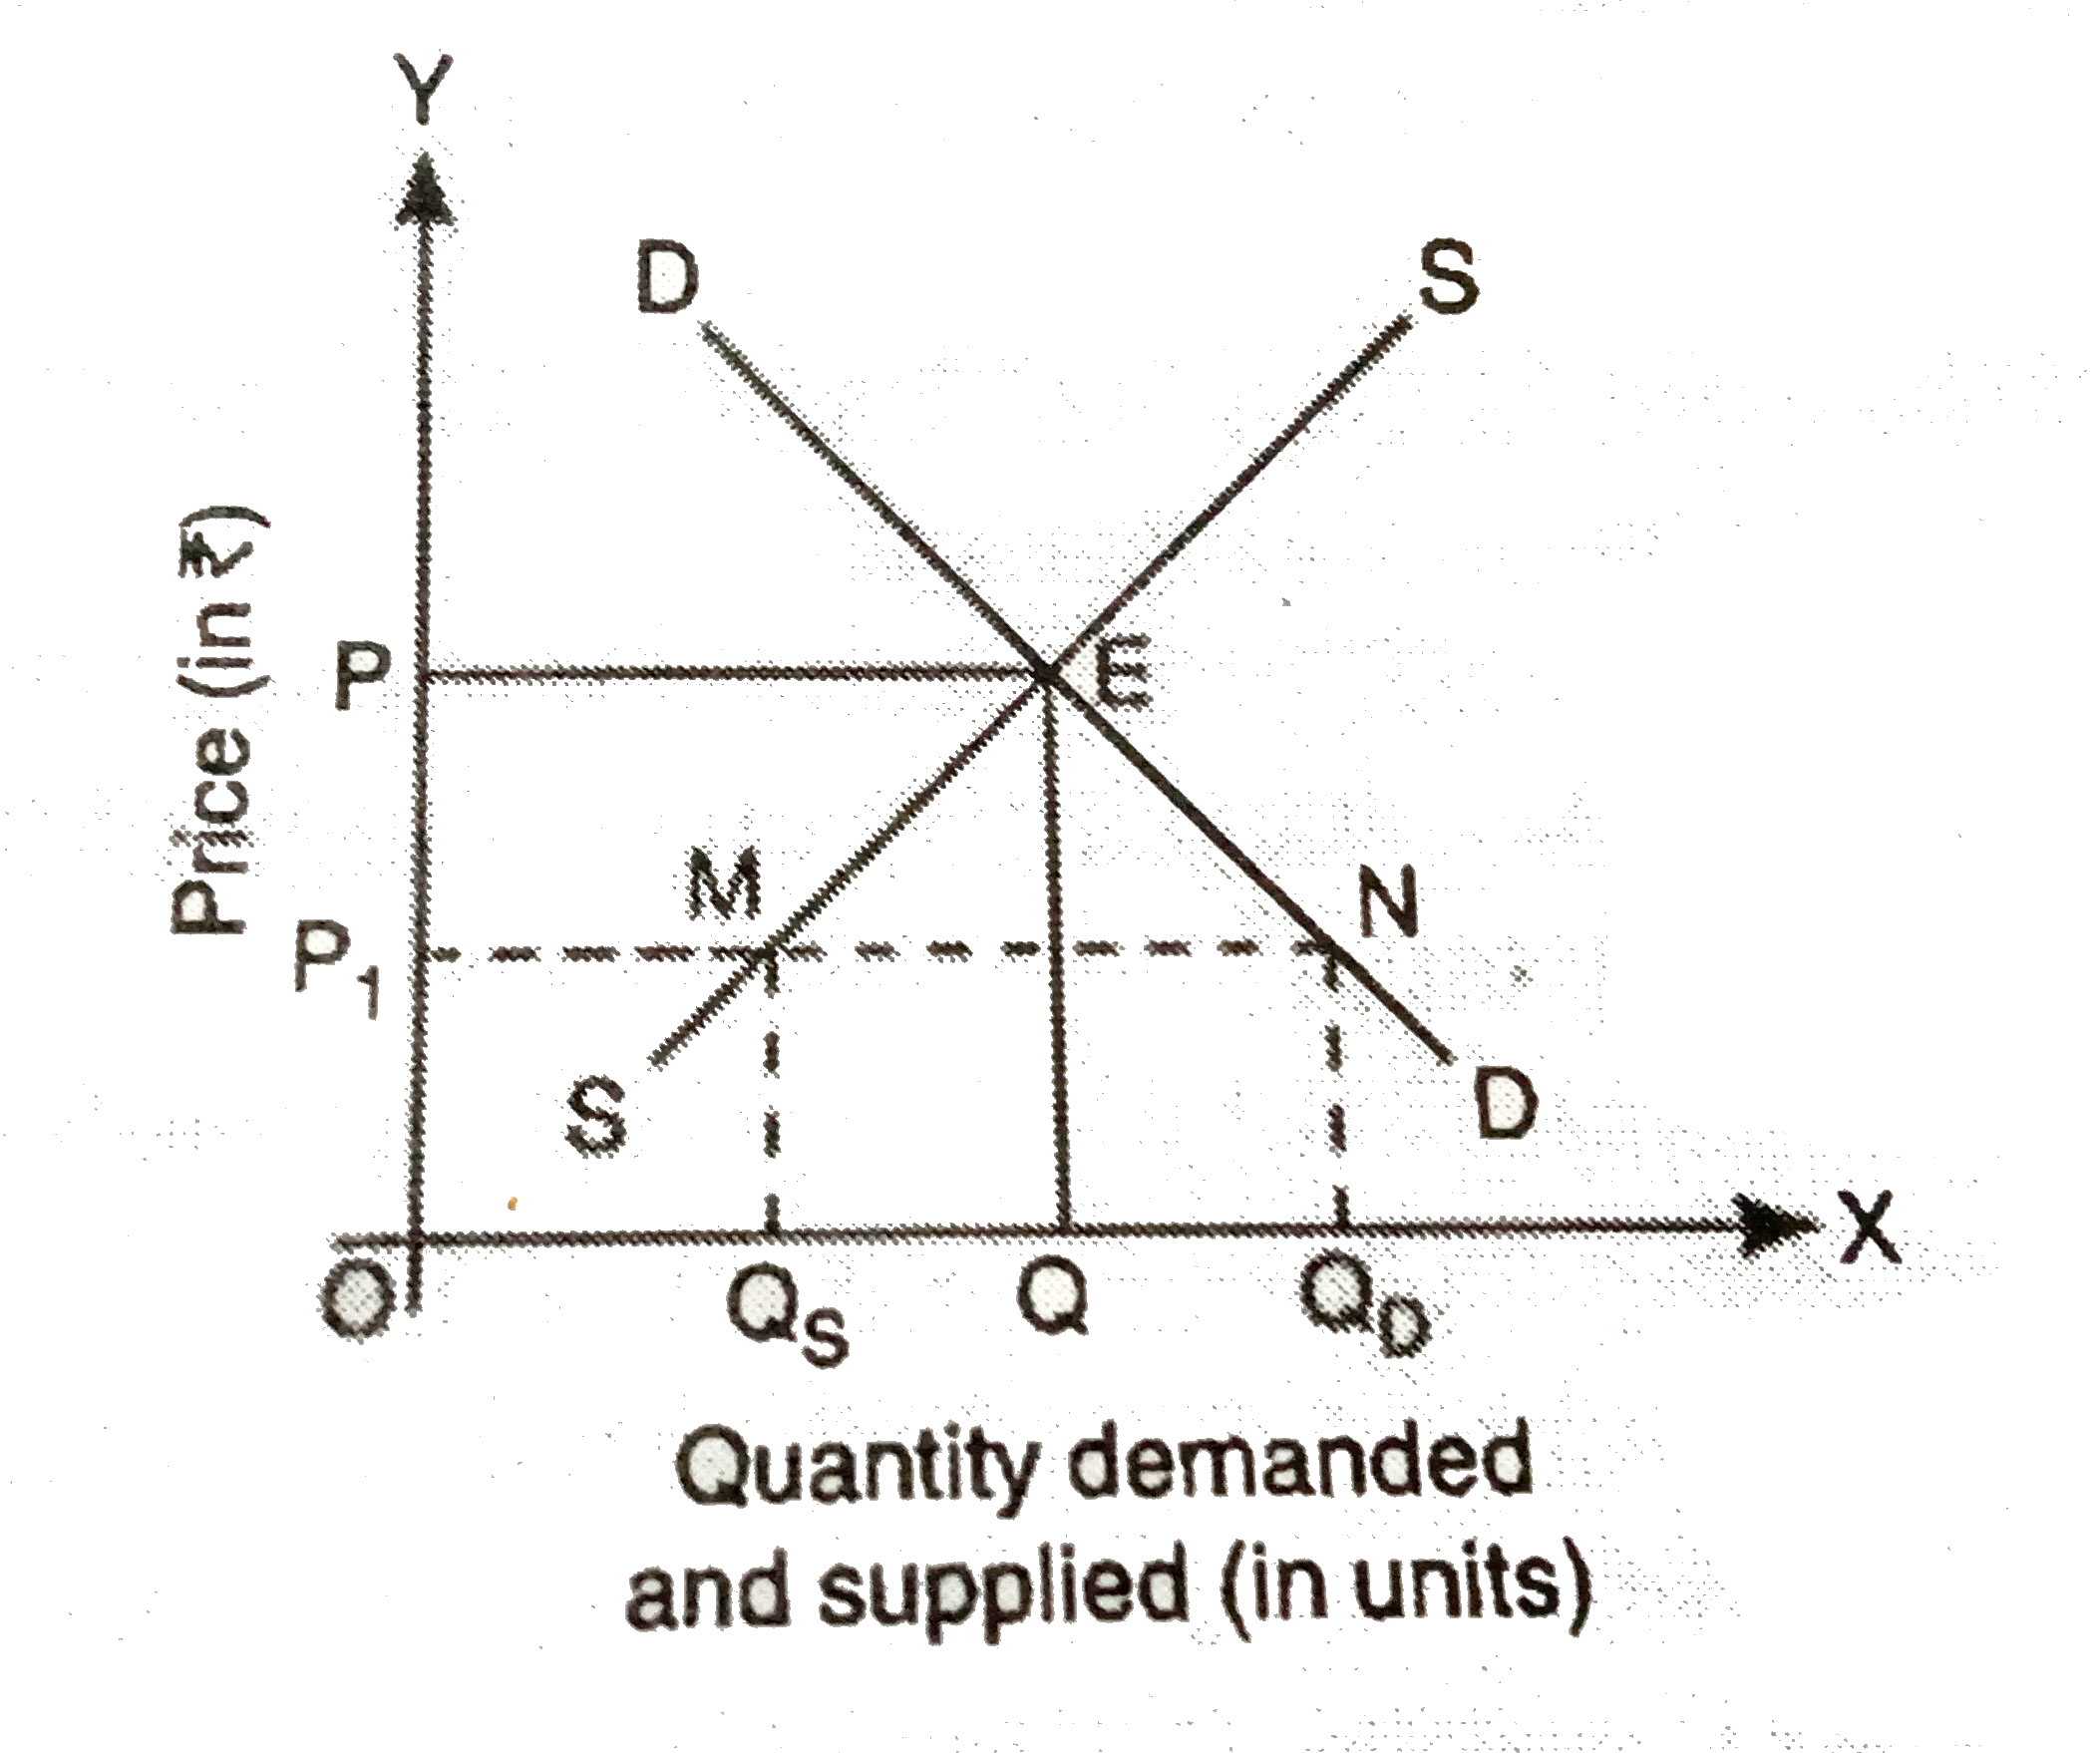
AMU is NegativeBMU is zeroCMU is RisingDNone of theseThe following diagram represents the situation of:
 APrice FloorBPrice CeilingCEither (a) or (b)DNeither (a) nor (b)
What is consumer equilibrium ?
View SolutionWhat is meant by consumer's equilibrium ?
View SolutionConsumers Equilibrium Utility Analysis
View SolutionThe following diagram represents:

a) Adaptive radiation
b) Divergent evolution
c) Convergent evolution
d) Both (a) and (b)
View SolutionFor consumer's equilibrium to be stable, the requirement is:
View Solution
