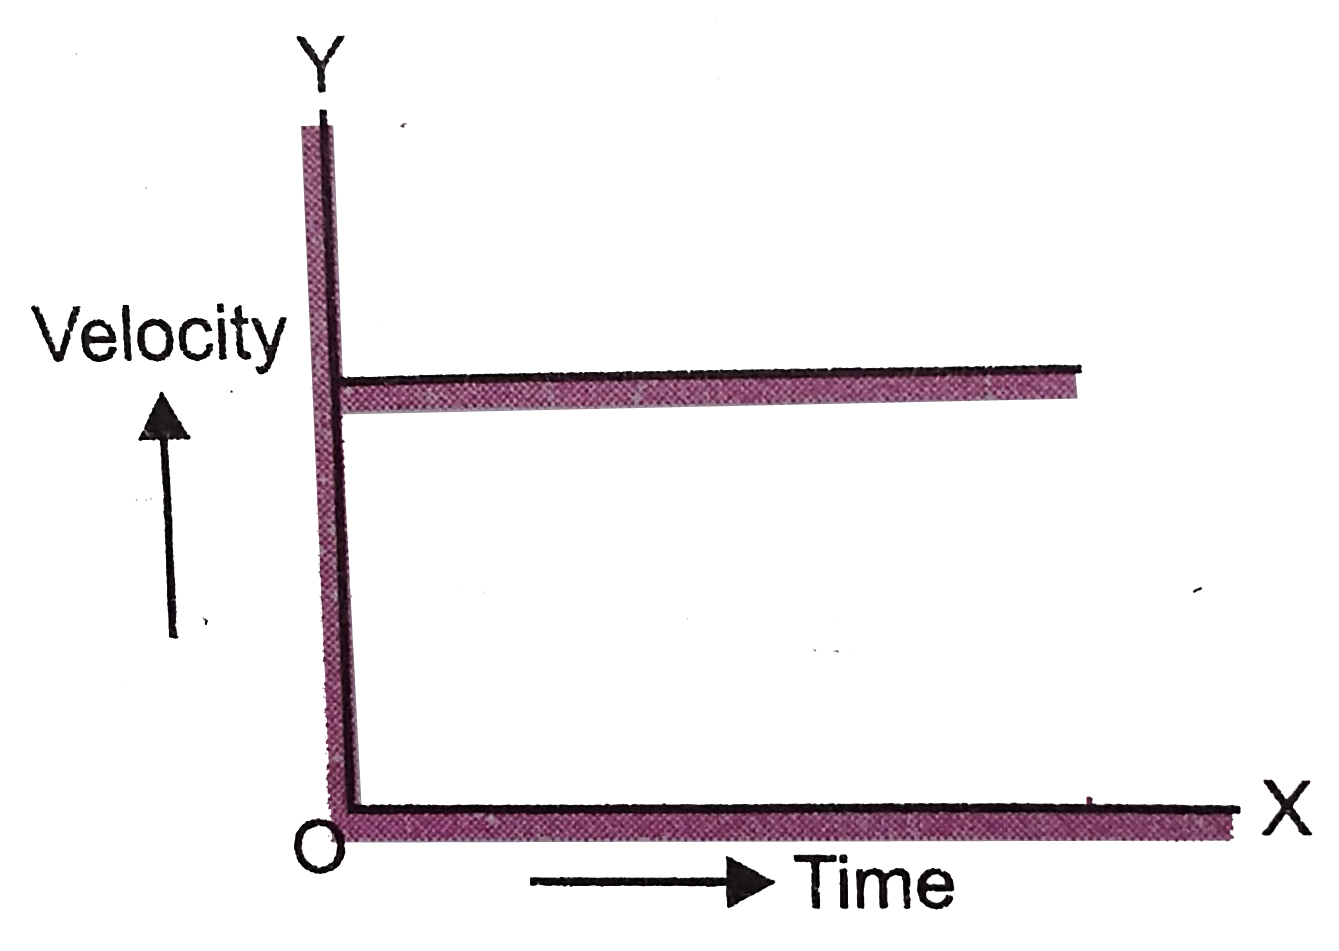
The velocity of a boedy increases for some time, then attains a constnat value and finally the velocity decreases until the body stops. What will be the shape of the velocity-time graph ?
Straight line
Square
Circle
Trapezium
The correct Answer is:D
To solve the problem of determining the shape of the velocity-time graph based on the described motion of the body, we can break it down into three distinct phases as follows:
1. Phase 1: Velocity Increases
- The body starts with an initial velocity and then its velocity increases over time. This means that as time progresses, the velocity is increasing. On a velocity-time graph, this will be represented as a straight line with a positive slope.
- Graph Representation: This part of the graph will be a straight line sloping upwards from the origin (or initial point).
2. Phase 2: Constant Velocity
- After the velocity has increased, the body then attains a constant velocity. This means that even as time continues to increase, the velocity remains unchanged.
- Graph Representation: This will be represented as a horizontal line parallel to the time axis on the graph, indicating that the velocity is constant over this period.
3. Phase 3: Velocity Decreases to Stop
- Finally, the velocity decreases until the body comes to a stop. This means that as time progresses, the velocity decreases until it reaches zero.
- Graph Representation: This will be represented as a straight line with a negative slope, sloping downwards until it intersects the time axis at the point where the velocity is zero.
4. Combining the Phases
- When we combine all three phases, we can visualize the entire velocity-time graph. The first phase is an upward sloping line, the second phase is a horizontal line, and the third phase is a downward sloping line that ends at the time axis.
- Final Shape: The overall shape of the graph resembles a trapezium (or trapezoid), where the first and last segments are sloped lines and the middle segment is a flat line.
Conclusion:
The shape of the velocity-time graph for the described motion is a trapezium.
---
- The body starts with an initial velocity and then its velocity increases over time. This means that as time progresses, the velocity is increasing. On a velocity-time graph, this will be represented as a straight line with a positive slope.
- Graph Representation: This part of the graph will be a straight line sloping upwards from the origin (or initial point).
- After the velocity has increased, the body then attains a constant velocity. This means that even as time continues to increase, the velocity remains unchanged.
- Graph Representation: This will be represented as a horizontal line parallel to the time axis on the graph, indicating that the velocity is constant over this period.
- Finally, the velocity decreases until the body comes to a stop. This means that as time progresses, the velocity decreases until it reaches zero.
- Graph Representation: This will be represented as a straight line with a negative slope, sloping downwards until it intersects the time axis at the point where the velocity is zero.
- When we combine all three phases, we can visualize the entire velocity-time graph. The first phase is an upward sloping line, the second phase is a horizontal line, and the third phase is a downward sloping line that ends at the time axis.
- Final Shape: The overall shape of the graph resembles a trapezium (or trapezoid), where the first and last segments are sloped lines and the middle segment is a flat line.
The shape of the velocity-time graph for the described motion is a trapezium.
Similar Questions
Knowledge Check
In relation to a velocity-time graph
Athe curve can be a circleBthe area under the curve and above the time axis between any two instants gives the average acceleration.Cthe slope at any instant gives the rate of change of acceleration at that instantDthe area under the curve and above the time axis gives the displacement.If the velocity of a body decreases gradually with time, then it is said to be in
AAccelerationBDecelerationCRetardationDBoth (b) and (c)If the velocity of a body decreases gradually with time, then it is said to be in
AAccelerationBDecelerationCRetardationDBoth (b) and (c )
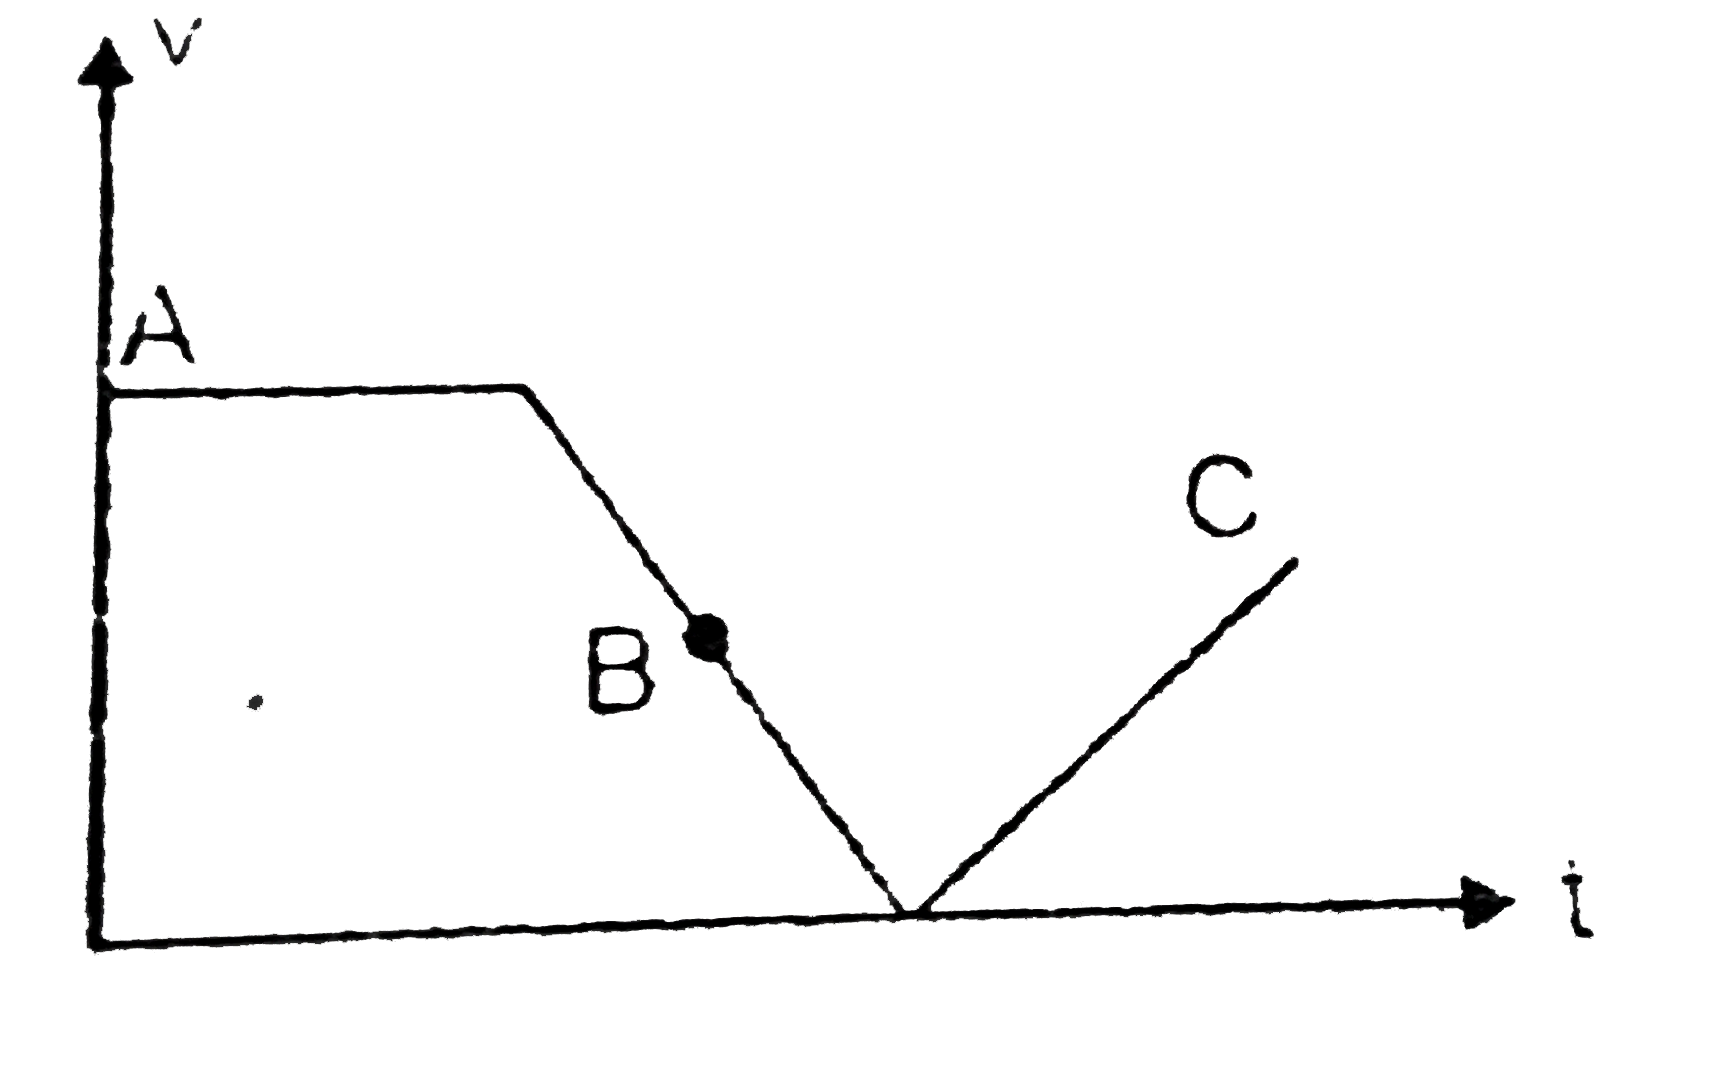
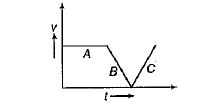
The velocity time graph of a body is shown in fig. it indicates that :
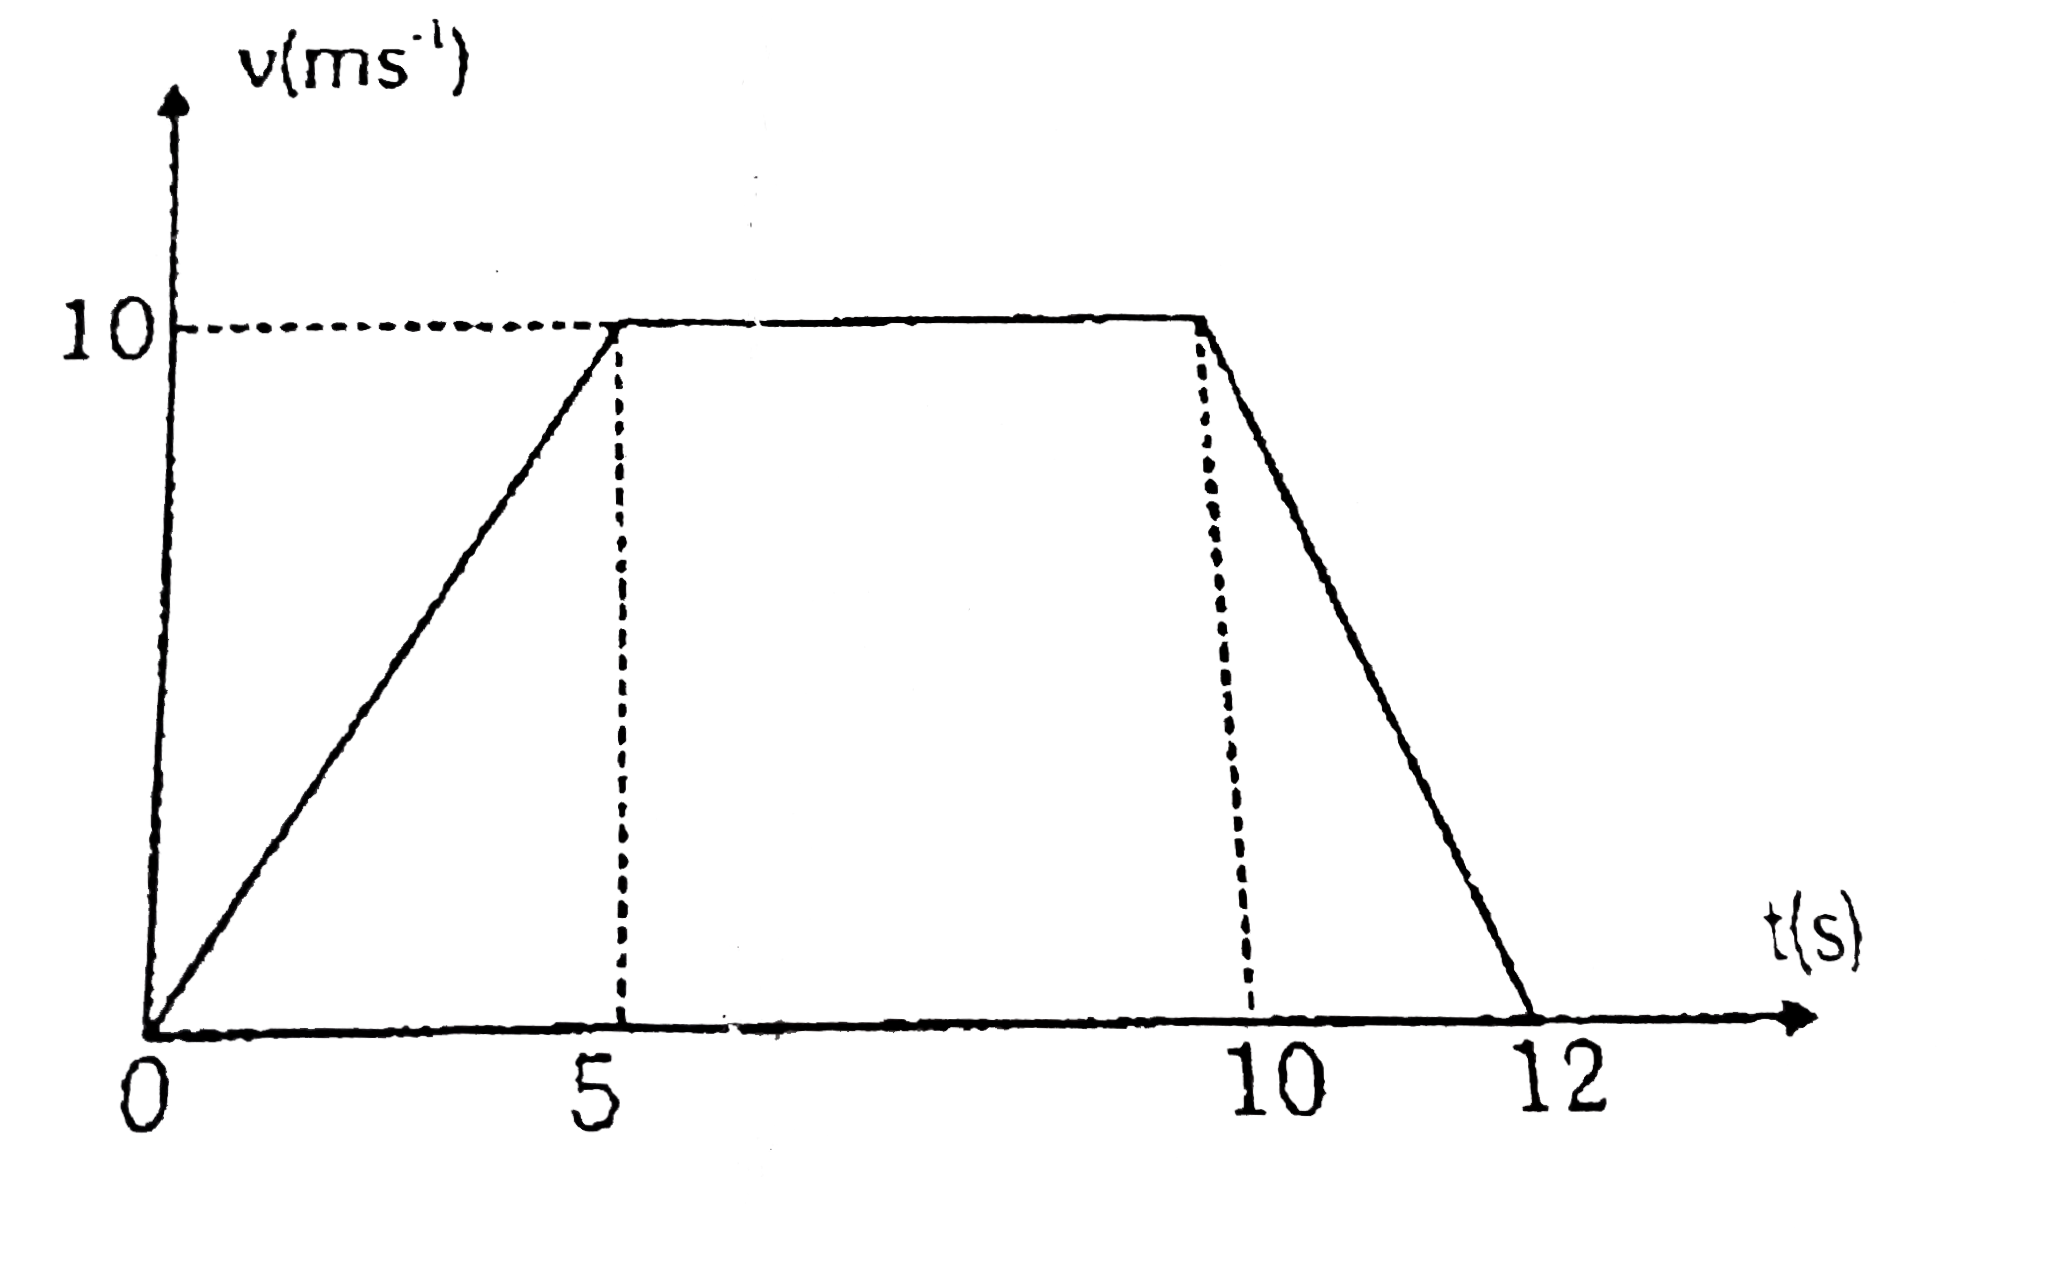
View SolutionDraw displacement time and acceleration -time graph for the given velocity-time graph
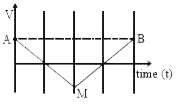
View SolutionIf the velocity-time graph has the shape AMB, what would be the shape of the corresponding acceleration-time graph ?
View SolutionThe velocity -time graph for a body with non-uniform motion is a
View SolutionThe velocity-time graph of a body is shown in the figure, it implies that at point B
View Solution

