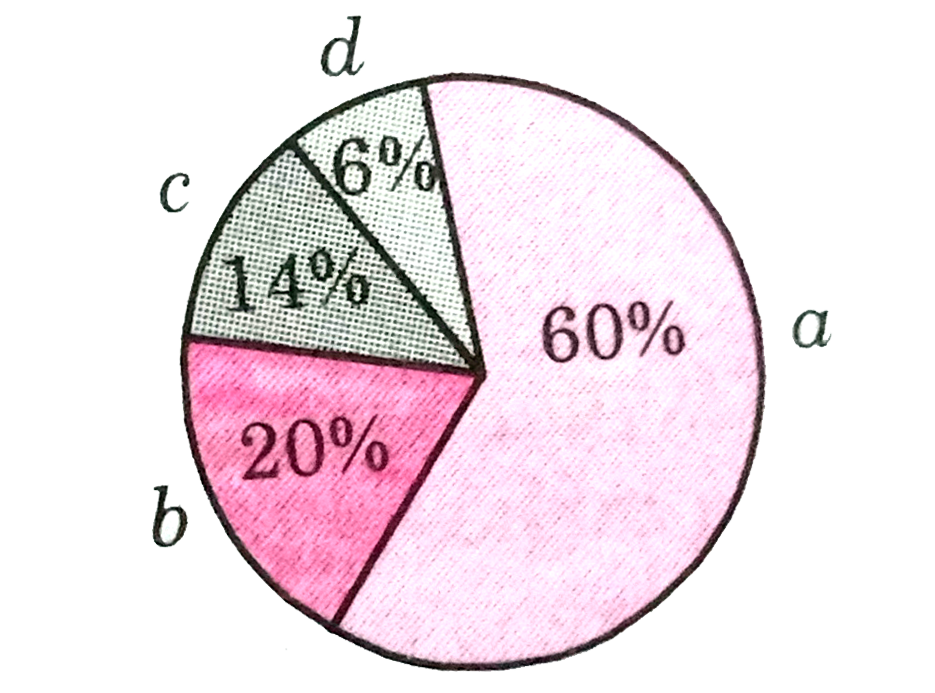
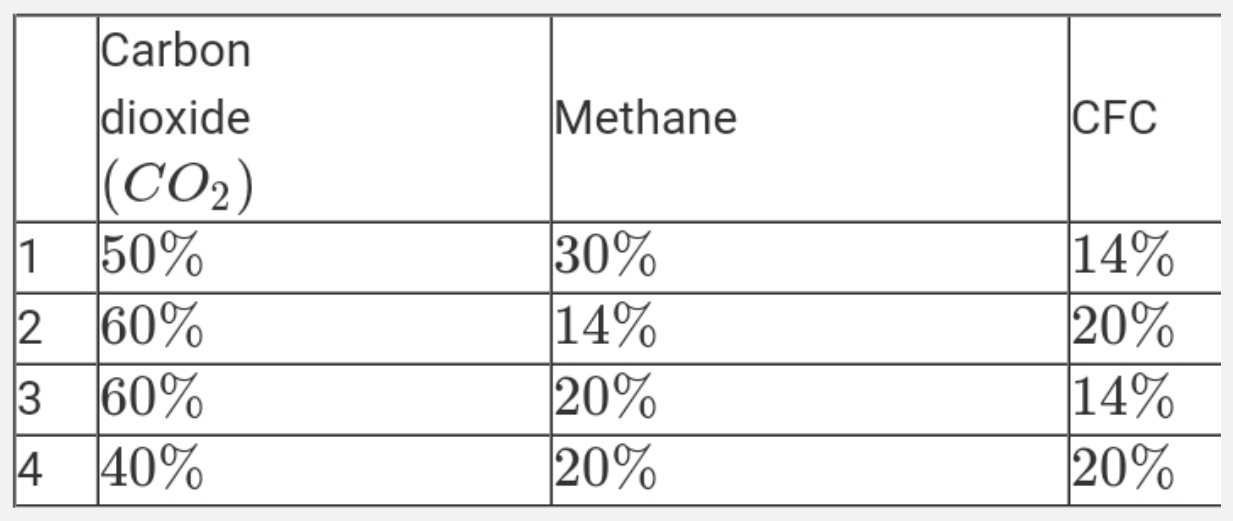
Given pie-diagram represents the relative contribution of various greenhouse gases to total global warming. Identify the gases P, Q, R and S.
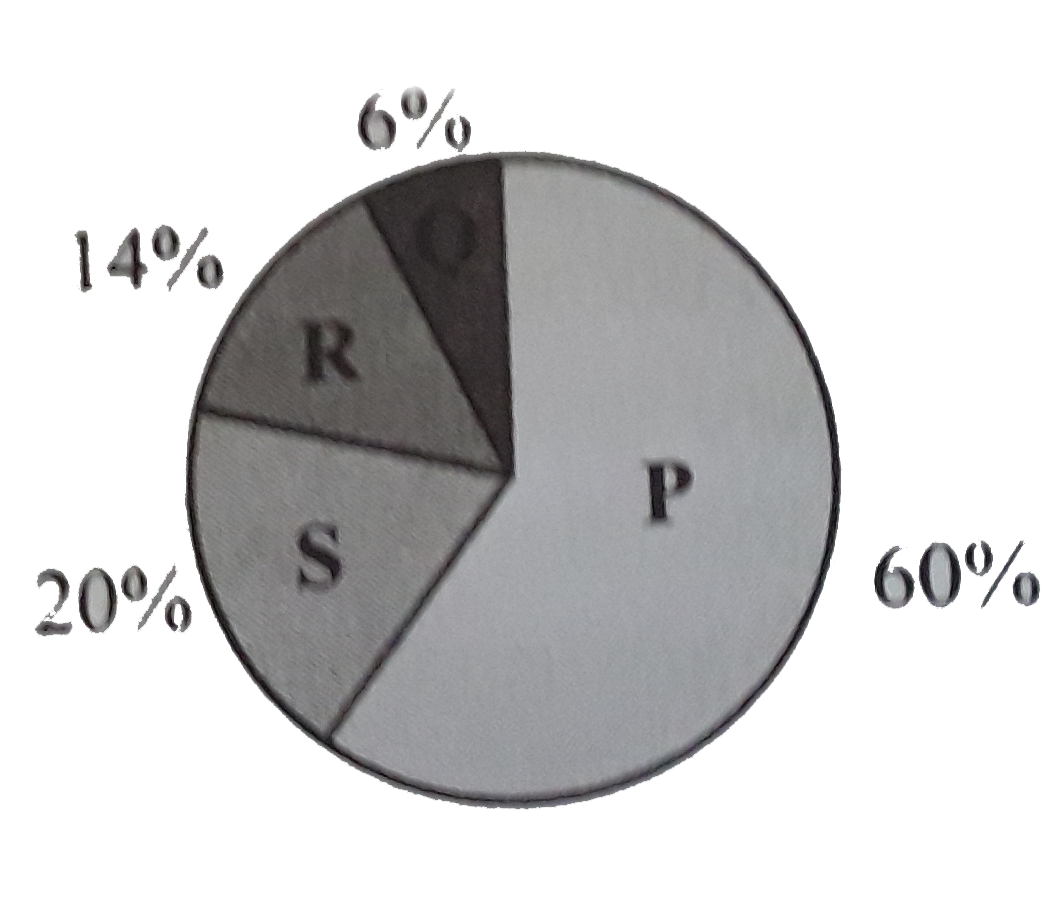
ABCDN2OCO2MethaneCFCs
ABCDCO2MethaneCFCsN2O
ABCDMethaneCO2CFCsN2O
ABCDCO2MethaneN2OCFCs
The correct Answer is:B
Step by step video, text & image solution for Given pie-diagram represents the relative contribution of various greenhouse gases to total global warming. Identify the gases P, Q, R and S. by Biology experts to help you in doubts & scoring excellent marks in Class 12 exams.
Updated on:21/07/2023Topper's Solved these Questions
- ENVIRONMENTAL ISSUESBOOK - GRB PUBLICATIONCHAPTER - ENVIRONMENTAL ISSUESEXERCISE - Assertion & Reason Type Questions
30 Videos
- ENVIRONMENTAL ISSUESBOOK - GRB PUBLICATIONCHAPTER - ENVIRONMENTAL ISSUESEXERCISE - Assertion & Reason Type Questions
30 Videos
- ECOSYSTEM BOOK - GRB PUBLICATIONCHAPTER - ECOSYSTEM EXERCISE - EXEMPLAR PROBLEMS
41 Videos
- GENE EXPRESSION AND REGULATIONBOOK - GRB PUBLICATIONCHAPTER - GENE EXPRESSION AND REGULATIONEXERCISE - NCERT Corner(Exemplar Problems)
46 Videos
Similar Questions
Knowledge Check
Given pie-diagram represents the relative contribution of various GHGs to total global warming. Select the correct statements(s) regarding A, B and C.
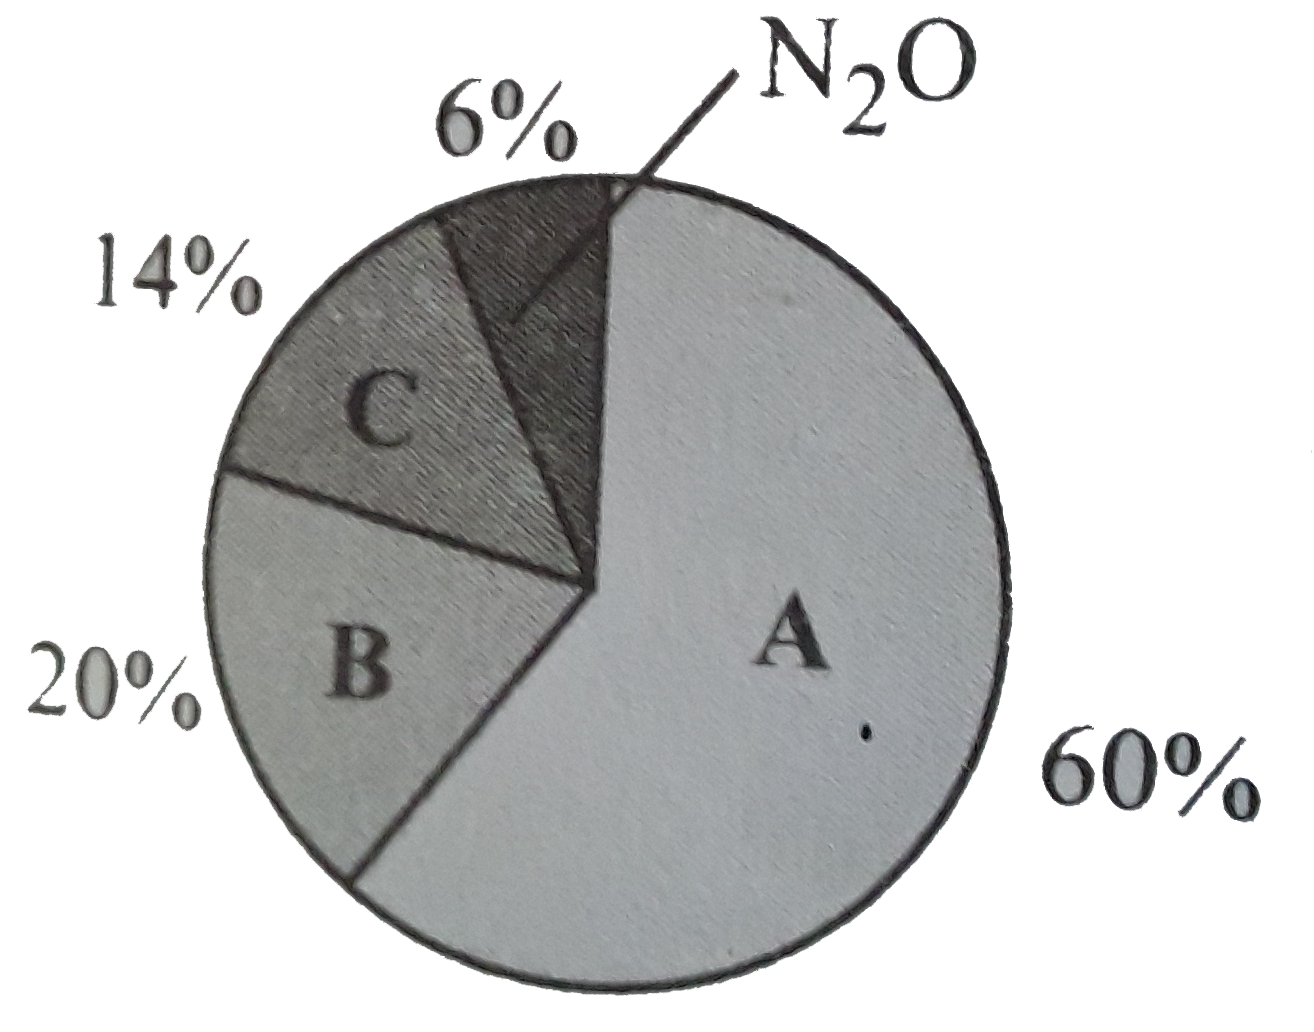 AA is the gas which is produced during the combustion of fossil fuels.BB are the chemicals which are used as coolants in refrigerators.CC is the gas which is the major constituent of biogas.DAll of these
Select the correct option for A, B , C and D given in the figure with respect to the relative contribution of various greenhouse gases to global warming.
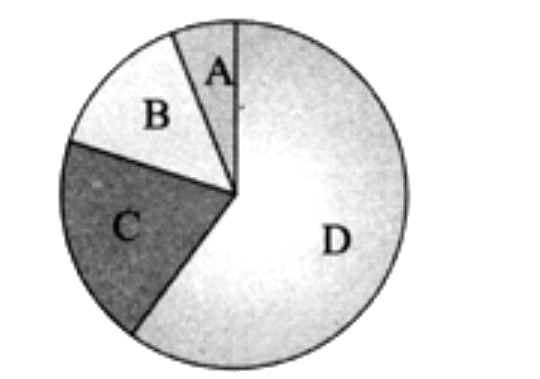 A(A−CO2),(B−CFCs),(C−CH4),(D−NO2)B(A−NO2),(B−CFCs),(C−CH4),(D−CO2)C(A−NO2),(B−CH4),(C−CFCs),(D−CO2)D(A−CH4),(B−CFCs),(C−NO2),(D−CO2)
Which of the following figures shows correct relative contribution of greenhouse gases to global warming?
A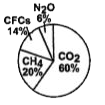 B
B C
C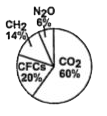 D
D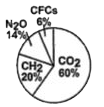
The figure shows relative contributions of various green house gases to the total global warming.
(i) Name the gases (a) and (b)
(ii) Explain how increase in green-house gases in earth's atmosphere leads to rise in sea level?
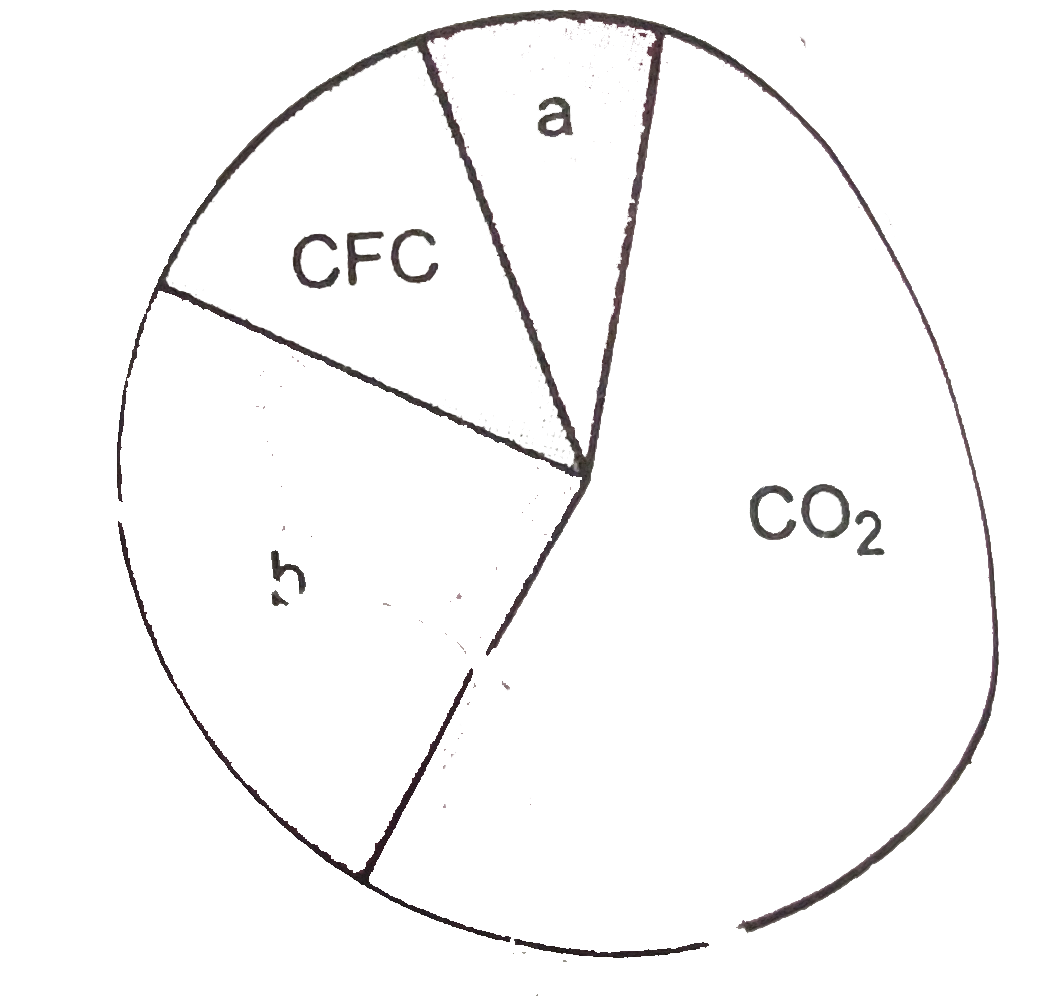
View SolutionThe figure is showing relative contribution of various green house gases to total global warming.
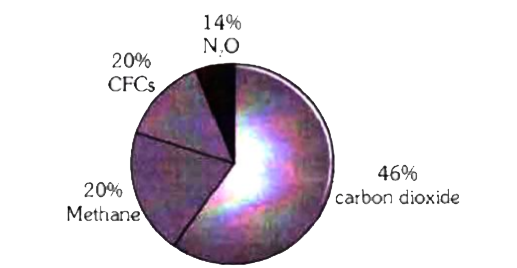
In above diagram find out correct gaseous contribution
View SolutionThe two gases making highest relative contribution to the greenhouse gases are:
View SolutionThe two gases making highest relative contribution to the greenhouse gases are:
View SolutionSelect the mismatched pairs w.r.t. relative contribution of various green house gases to totral global warming: (a) CFCs - 20% (b) N2O-6% © Carbon dioxide - 60% (d) Methane - 14%
View Solution

