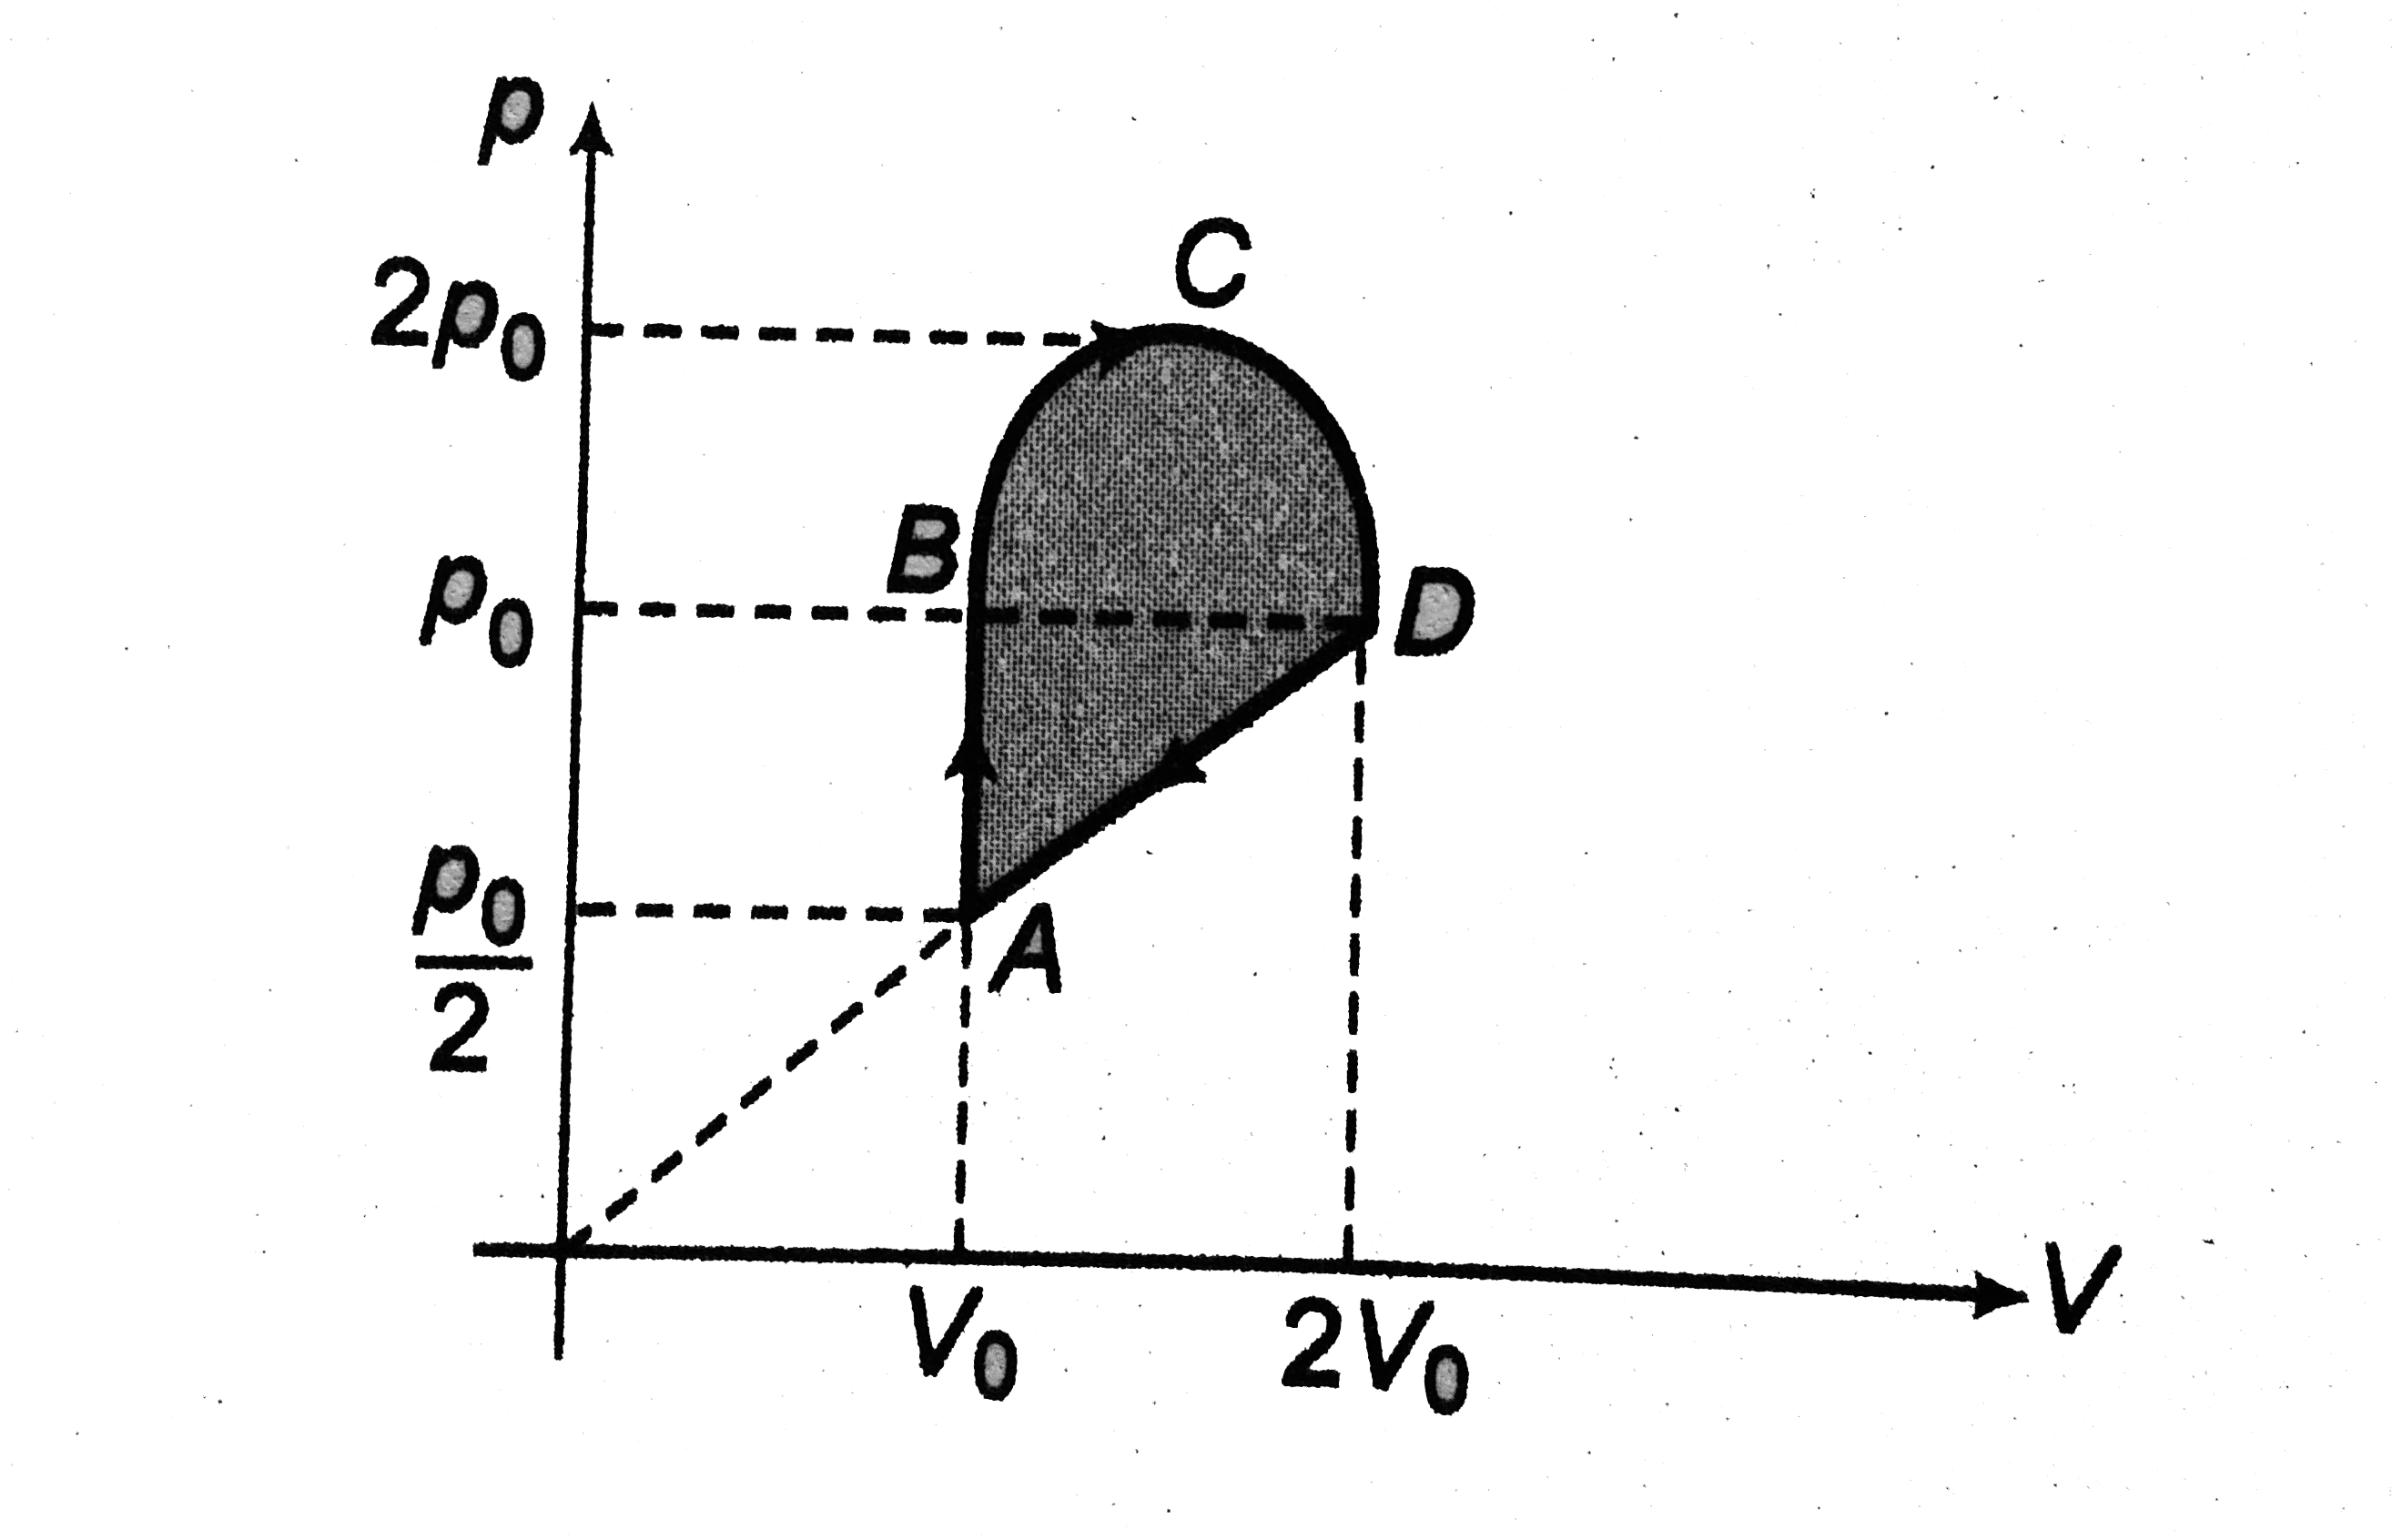
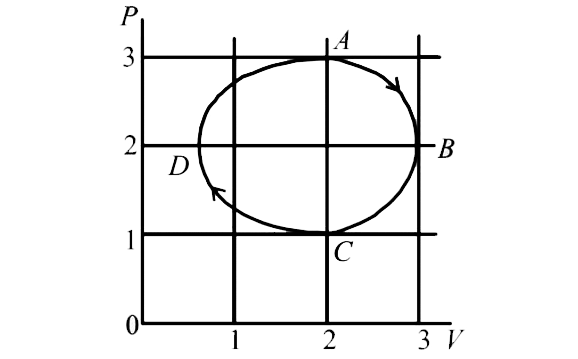
The figure shows the P-V plot of an ideal gas taken through a cycle ABCDA. The part ABC is a semi-circle and CDA is half of an ellipse. Then,
A
The process during the path A→B is isothermal
B
Heat flows out of the gas during the path B→C→D
C
Work done during the path A→B→C is zero
D
Positive work is done by the gas in the cycle ABCDA
Video Solution
Text Solution
The correct Answer is:B, D
ΔQ=ΔU+W
Fro process B→C→D
ΔU is is negative and W is also negative, so is also negative, hence heat flows out during this process.
A to B, work is +ve. B to C work is –ve. But +ve work is more, so net work is not zero in process A→B→C.
|
Updated on:21/07/2023
Similar Questions
Knowledge Check
- Question 1 - Select One or More
The figure shows the P−V plot of an ideal gas taken through a cycle ABCDA. The part ABC is a semi-circle and CDA is half of an ellipseThen
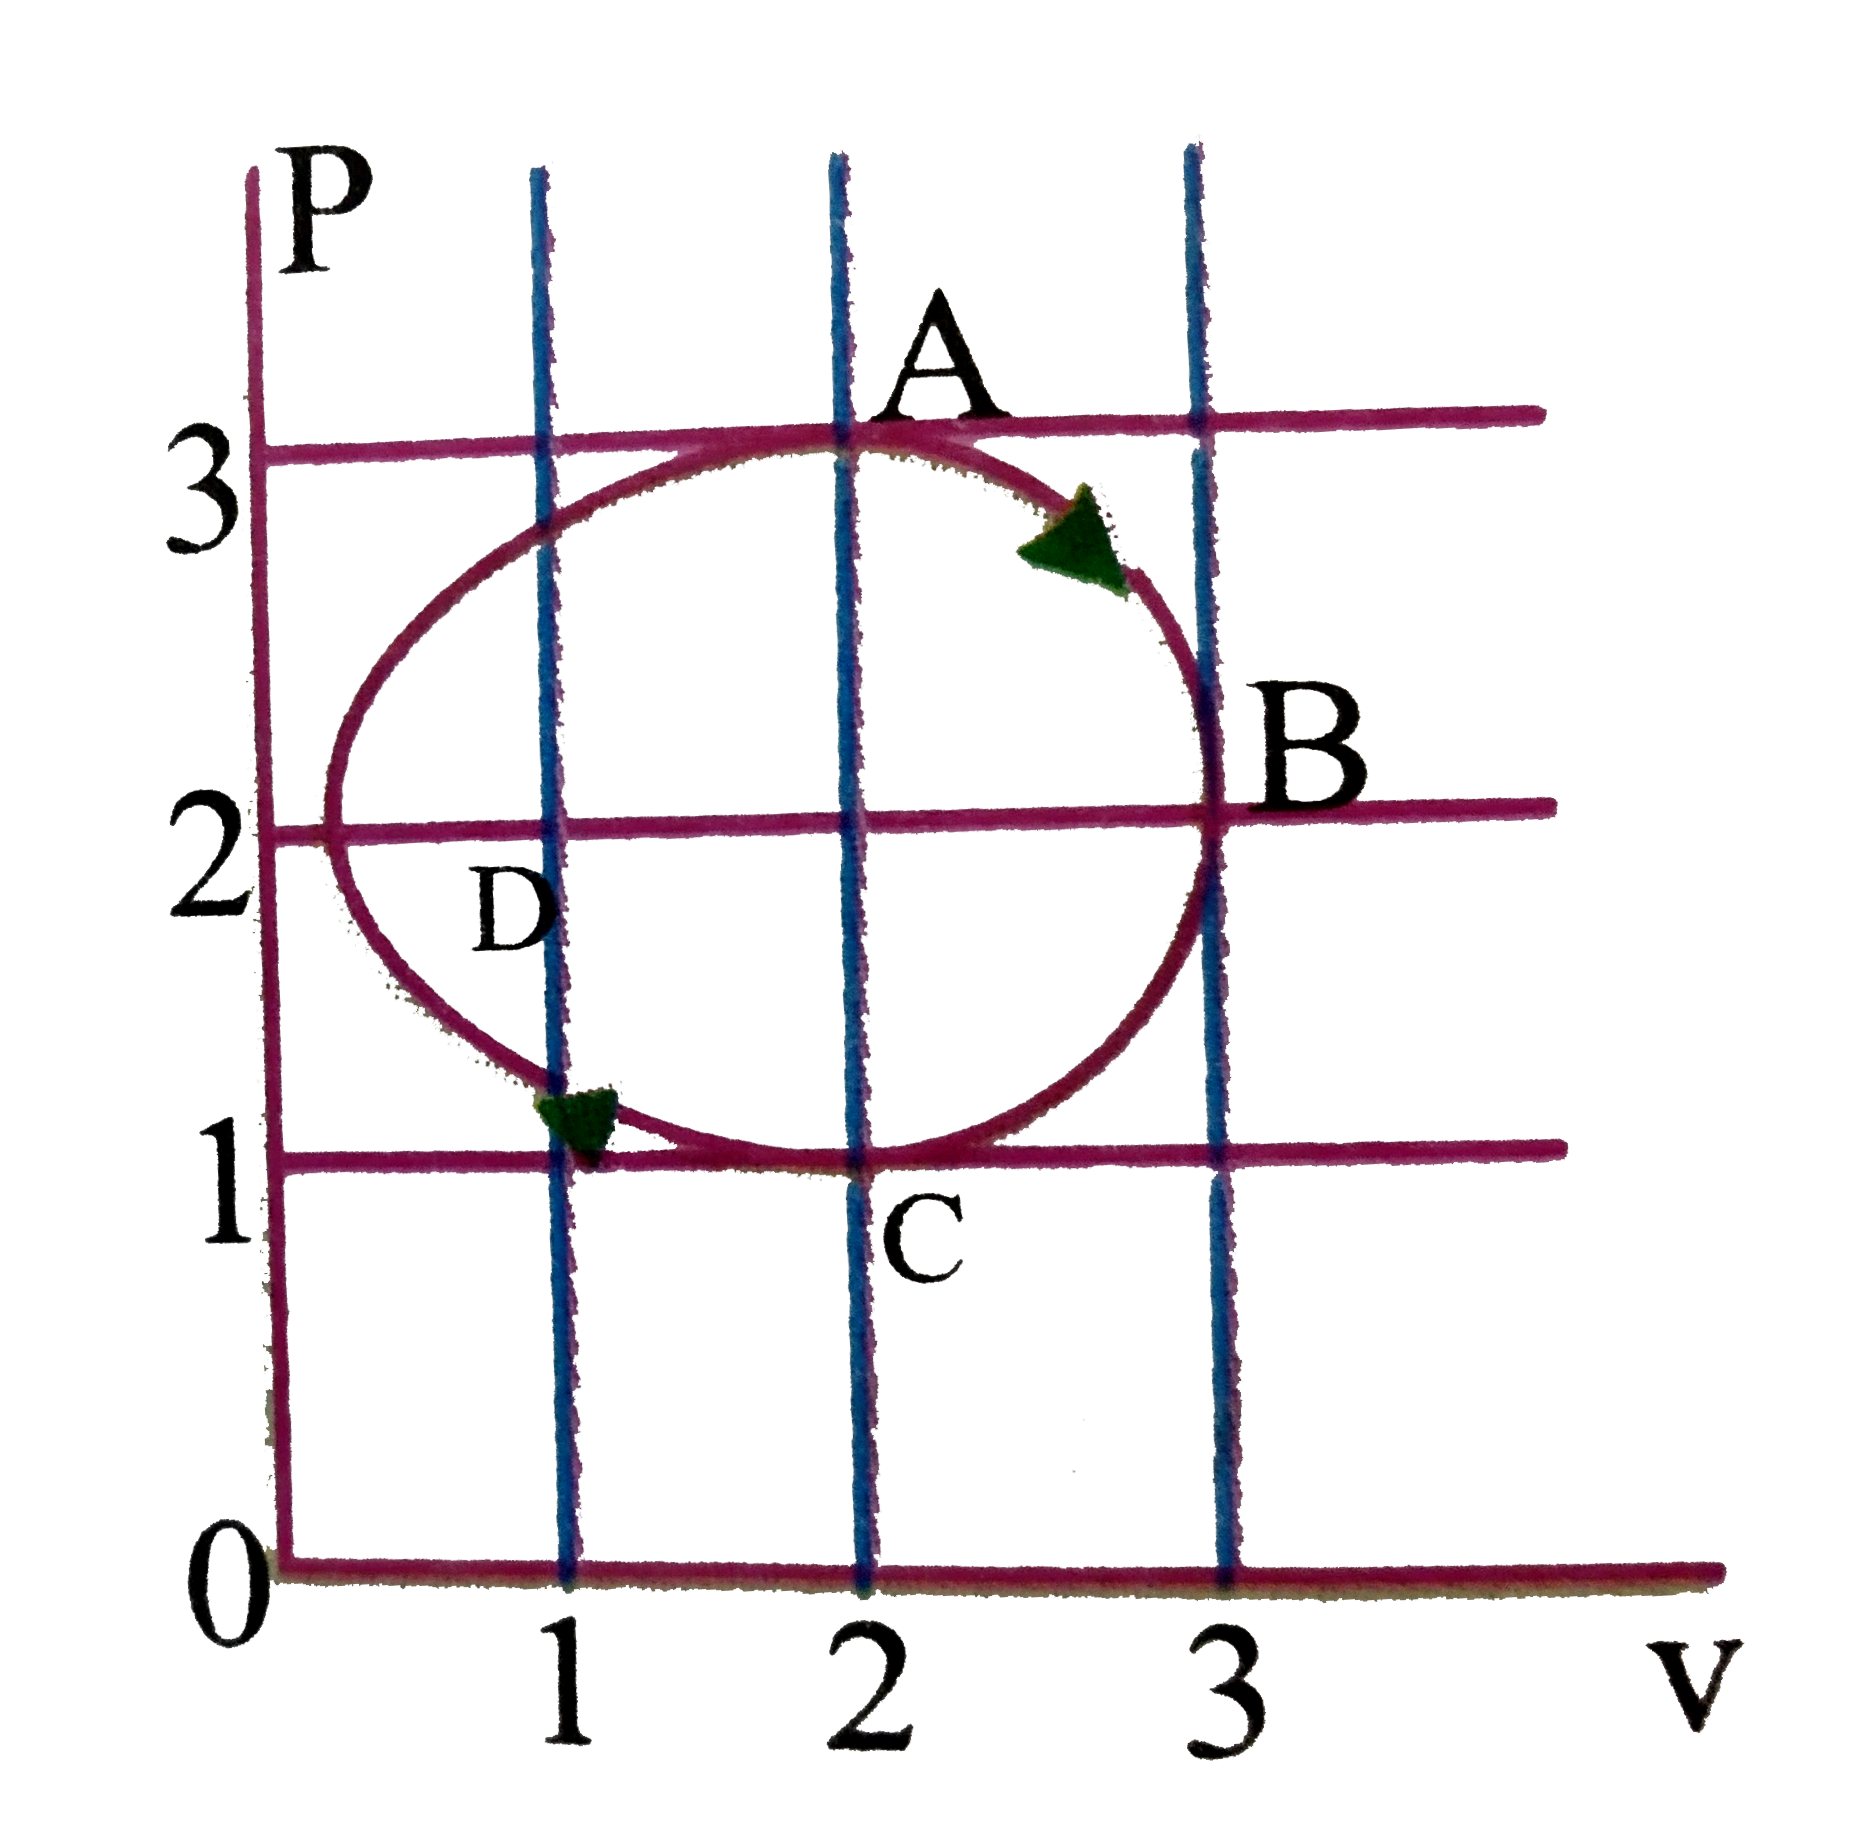 AThe process during the path A→B is isthermalBHeat flows out of the gas during then path B→C→DCWork done during the path A→B→C is zeroDPositive work is done by the gas in cycle ABCDA
 - Question 2 - Select One
An enclosed ideal gas is taken through a cycle as shown in the figure. Then
 AAlong AB, temperature decreases while along BC temperature increasesBAlong AB, temperature increases while along BC the temperature decreases.CAlong CA work is done by the gas and the internal energy reamins constant.DAlong CA workd is done on the gas and internal energy of the gas increases
 - Question 3 - Select One
Ideal gas is taken through process shown in figure
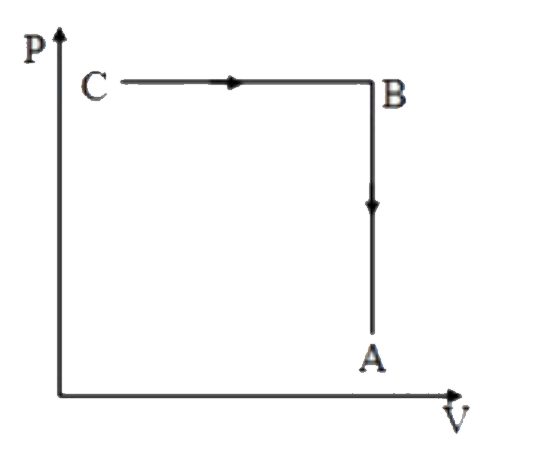
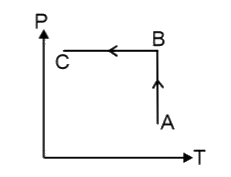 Aln process AB, work done by system is positiveBIn process AB, heat is rejected out of the system.CIn process AB, internal energy increasesDIn process AB internal energy decreases and
in process BC internal energy increases
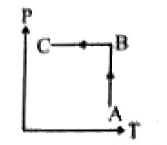
Ideal gas is taken through process shown in figure :
 View Solution
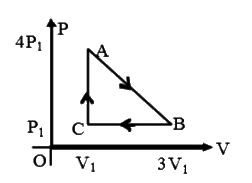
An ideal gas is taken through series of changes ABCA. The amount of work involved in the cycle is –
 View Solution
An ideal gas is taken through series of changes ABCA The amount of work involved in the cycle is:
 View Solution
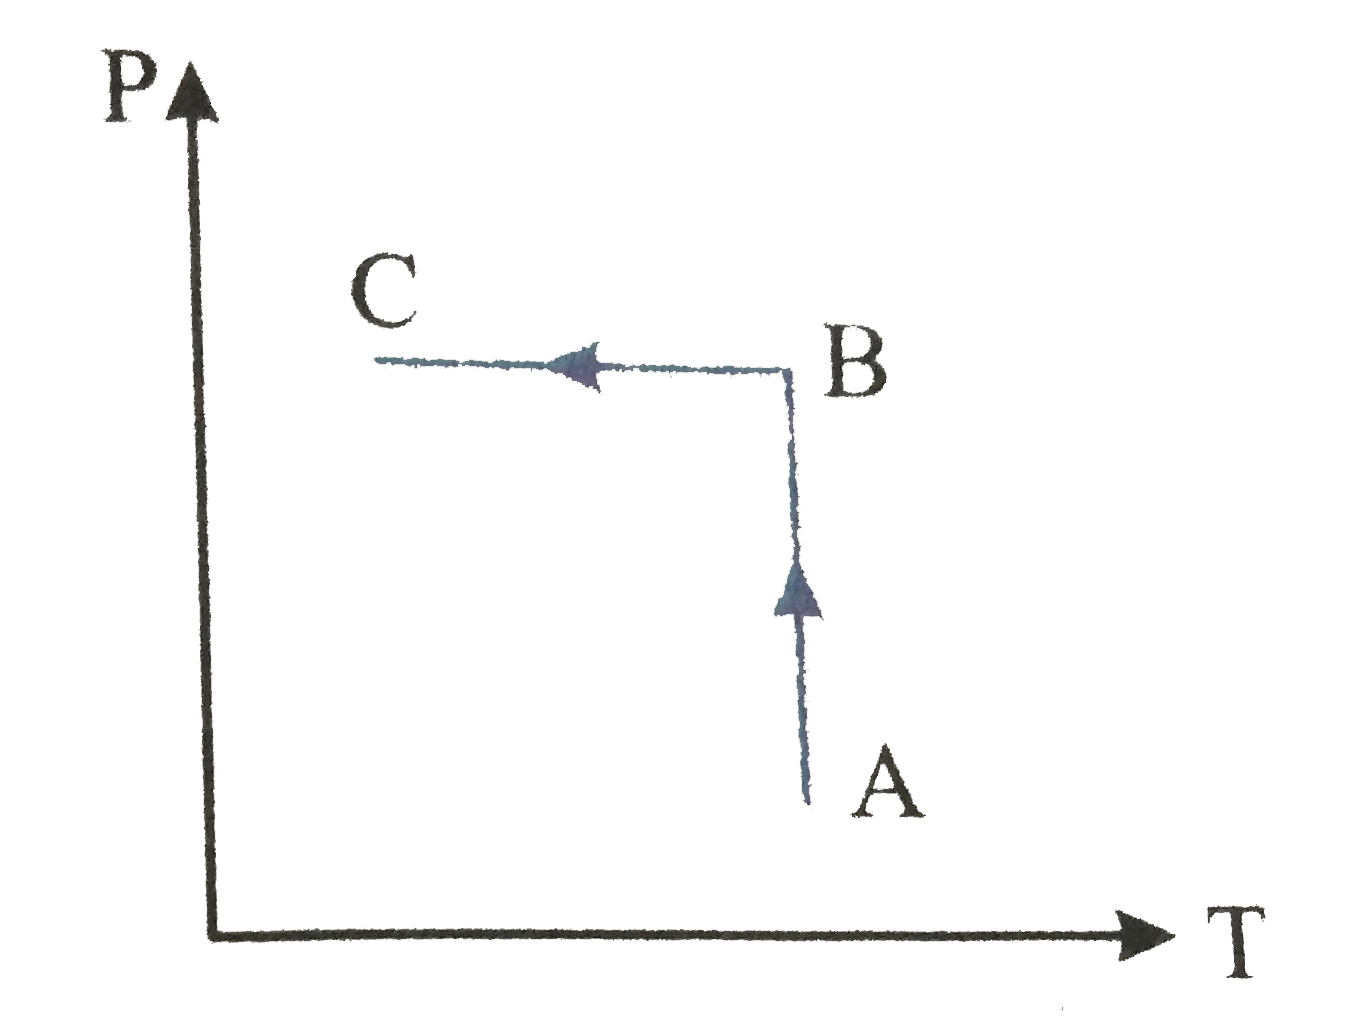
Ideal gas is taken through the process shown in the figure :
 View Solution
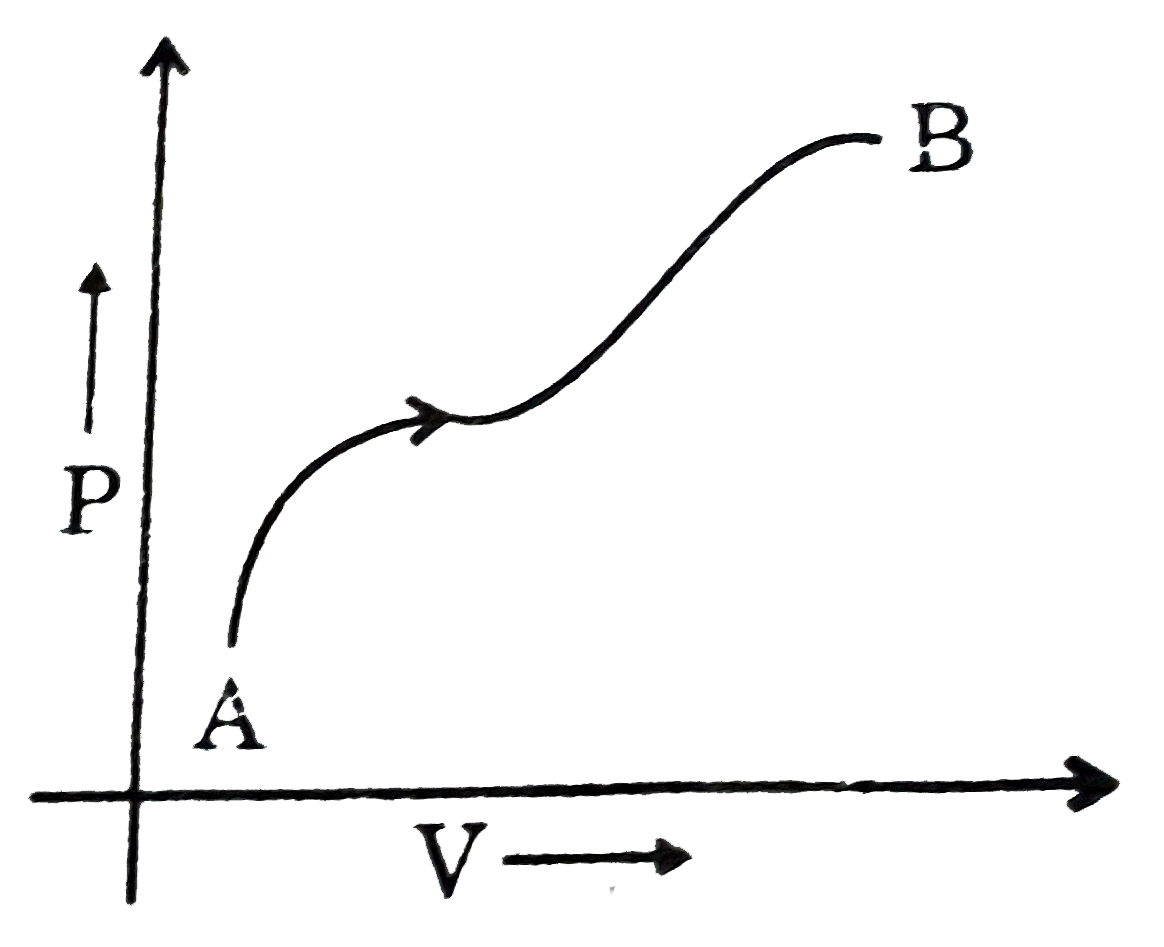
The graph given below shows the P-V plot for a process on an ideal gas. Select the correct statement.
 View Solution

