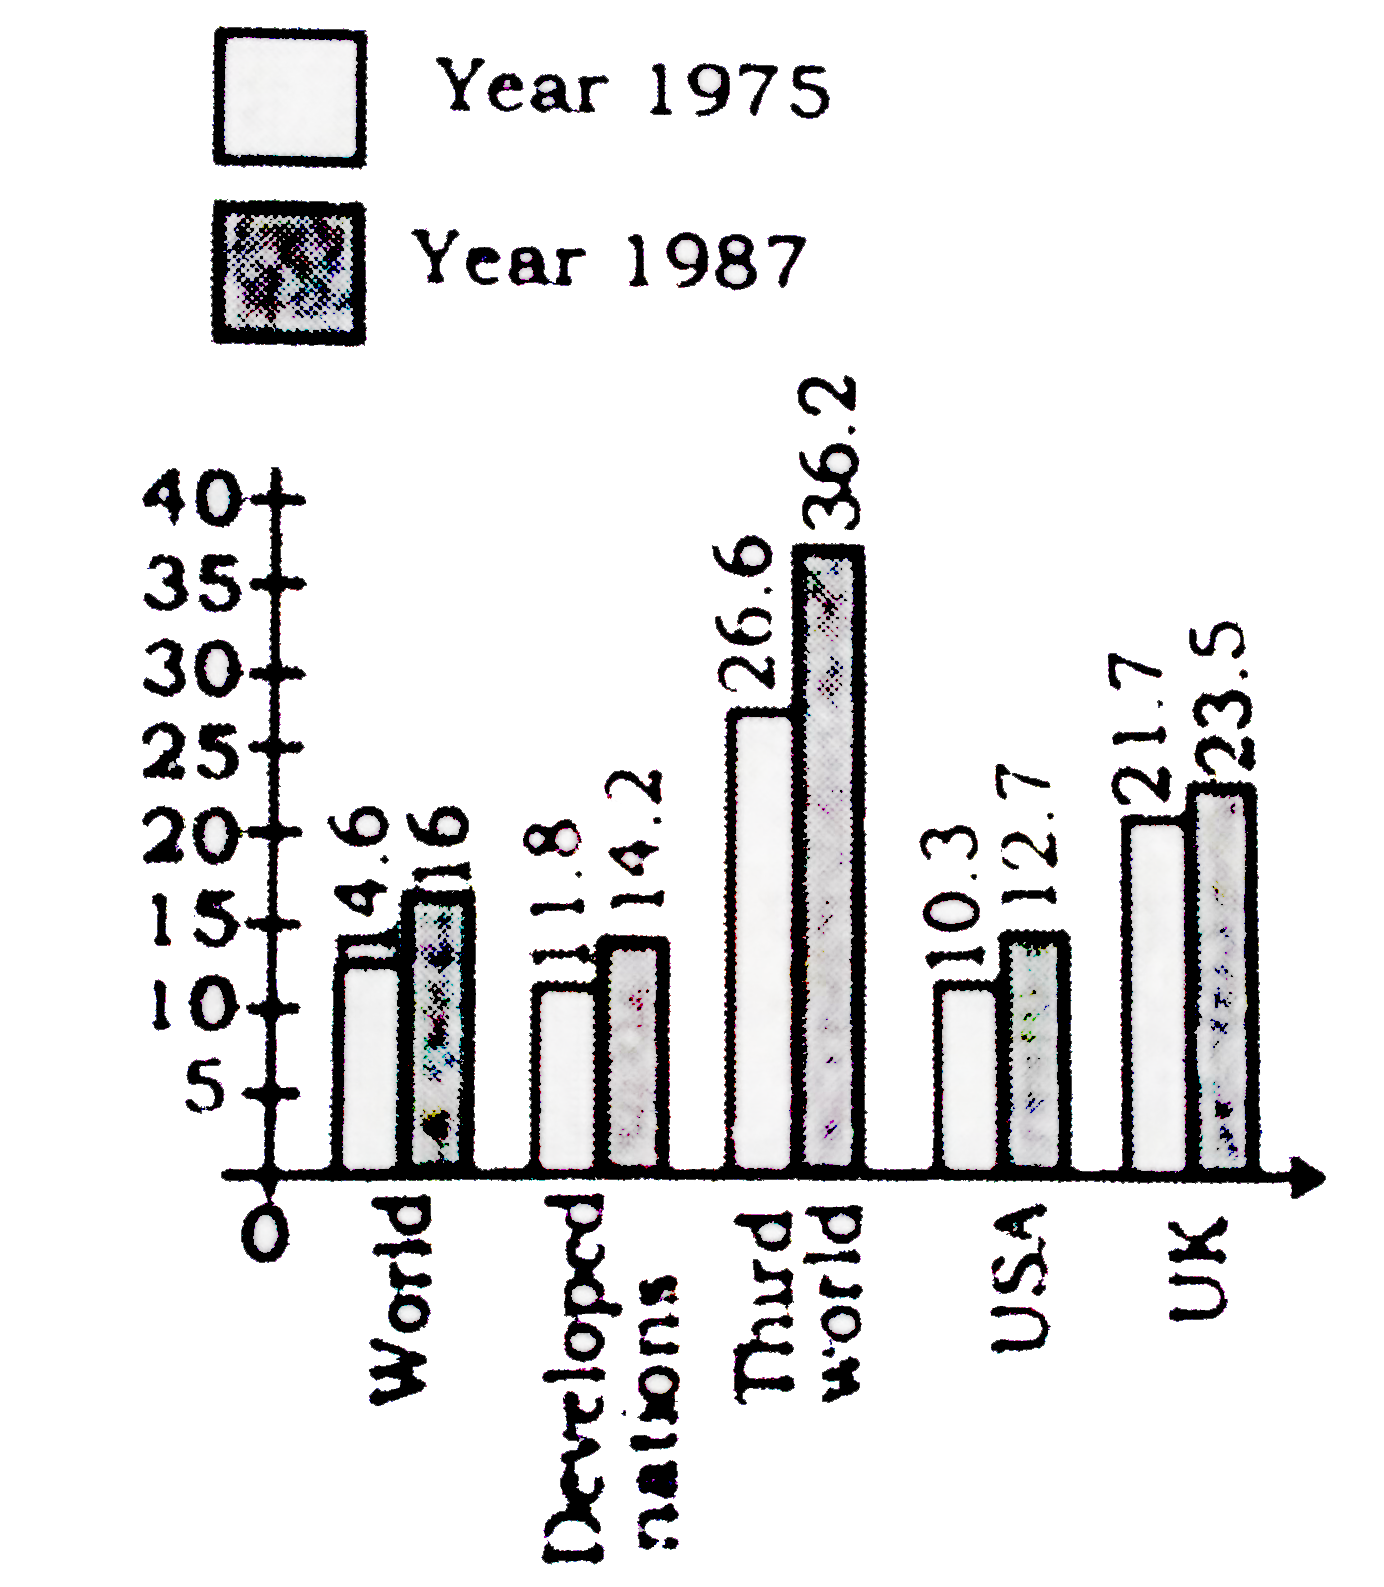
निम्नलिखित बान-ग्राफ का अध्ययन करें और प्रश्नों का उत्तर दें। बार-ग्राफ में वर्ष 1975 से 1987 तक प्रतिशत में मुद्रा-स्फीति की वार्षिक दर प्रतिशत में दी गई है ?

विकसित देशों के ऑकडों की तुलना संयुक्त राज्य अमेरिका के आंकडों से करने पर यह निष्कर्ष निकाला जा सकता है कि
संयुक्त राज्य अमेरिका का मुद्रा स्फीति पर बेहतर नियन्त्रण था।
विकसित देशों का मुद्रा स्फीति पर बेहतर नियन्त्रण था।
संयुक्त राज्य अमेरिका और विकसित देशों में मुद्रा स्फीति दर एक जैसी ही रही है।
कोई निर्णय नहीं निकाला जा सकता है
From graph it is clear that U.S.A had better central on inflation.
Similar Questions
Study the graph and answer the questions based on the graph:
आरेख का अध्ययन करें और आरेख के आधार पर प्रश्नों के उत्तर दें: What was the percentage decline in the production from Friday to Saturday?
शुक्रवार से शनिवार तक उत्पादन में कितने प्रतिशत की गिरावट रही?
View SolutionStudy the given chart and answer the following questions:
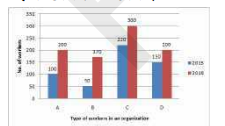
दिए गए चार्ट का अध्ययन करें और निम्नलिखित प्रश्नों के उत्तर दें: The percentage increase in the number of workers in 2018 is maximum as compared to that is
2015 in case of workers of type:
2018 में श्रमिकों की संख्या में प्रतिशत वृद्धि 2015 की तुलना में अधिकतम है, जो कि किस प्रकार के श्रमिकों के मामले में है?
View SolutionStudy the chart and answer the questions:
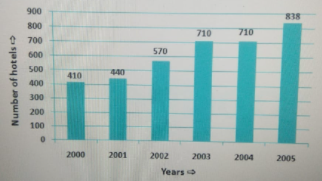
In which of the given years is the percentage increase in the number of hotels in comparison to the previous year, is the maximum?
चार्ट का अध्ययन करें और प्रश्नों का उत्तर दें:पिछले वर्ष की तुलना में होटलों की संख्या में किस वर्ष में अधिकतम प्रतिशत वृद्धि हुई है?
View SolutionThe following figure shows the number of students (in thousands) admitted and passed out per your in a college during years 2000 to 2004, study the figure and answer the questions : : निम्नलिखित आकृति में किसी कॉलेज में वर्ष 2000 से वर्ष 2004 तक प्रति वर्ष भर्ती हुए और उर्तीण हुए छात्रों की संख्या (हजार में) दर्शायी गई है। आकृति का अध्ययन कर प्रश्नों के उत्तर दीजिए : The percent increase in the number of students admitted in the year 2003 over that in 2001 is वर्ष 2001 की तुलना में वर्ष 2003 में भर्ती हुए छात्रों की संख्या में हुई प्रतिशत वृद्धि कितनी है ?
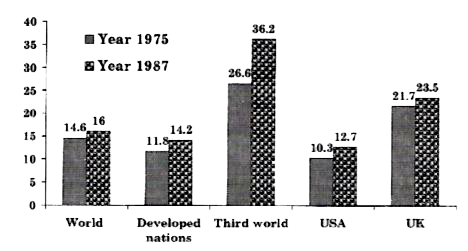
View SolutionStudy the following Bar graph and answer the question. The Bar graph gives the annual rates of inflation in percentages for 1975 and 1987:
निम्नलिखित बार-ग्राफ का अध्ययन करें और प्रश्नों का उत्तर दें। बार-ग्राफ में वर्ष 1975 से 1987 तक प्रतिशत में मुद्रा स्फीति की वार्षिक दर प्रतिशत में दी गई है :

The change in rate of inflation was least in which of the following.
मुद्रास्फीति के परिवर्तन की निम्नतम दर इन में से कहाँ थी?
View Solutionनिम्नलिखित में से कौन सा ग्राफ बॉयल के नियम का प्रतिनिधित्व करता है?
View SolutionH_2Se का क्वथनांक H_2S की तुलना में अधिक होता है। यह किसके द्वारा अच्छी तरह से समझाया जा सकता है?
View Solutionएक अभिक्रिया की सक्रियण ऊर्जा को निम्न में से किस ग्राफ की प्रवणता से निर्धारित किया जा सकता है?
View Solution
