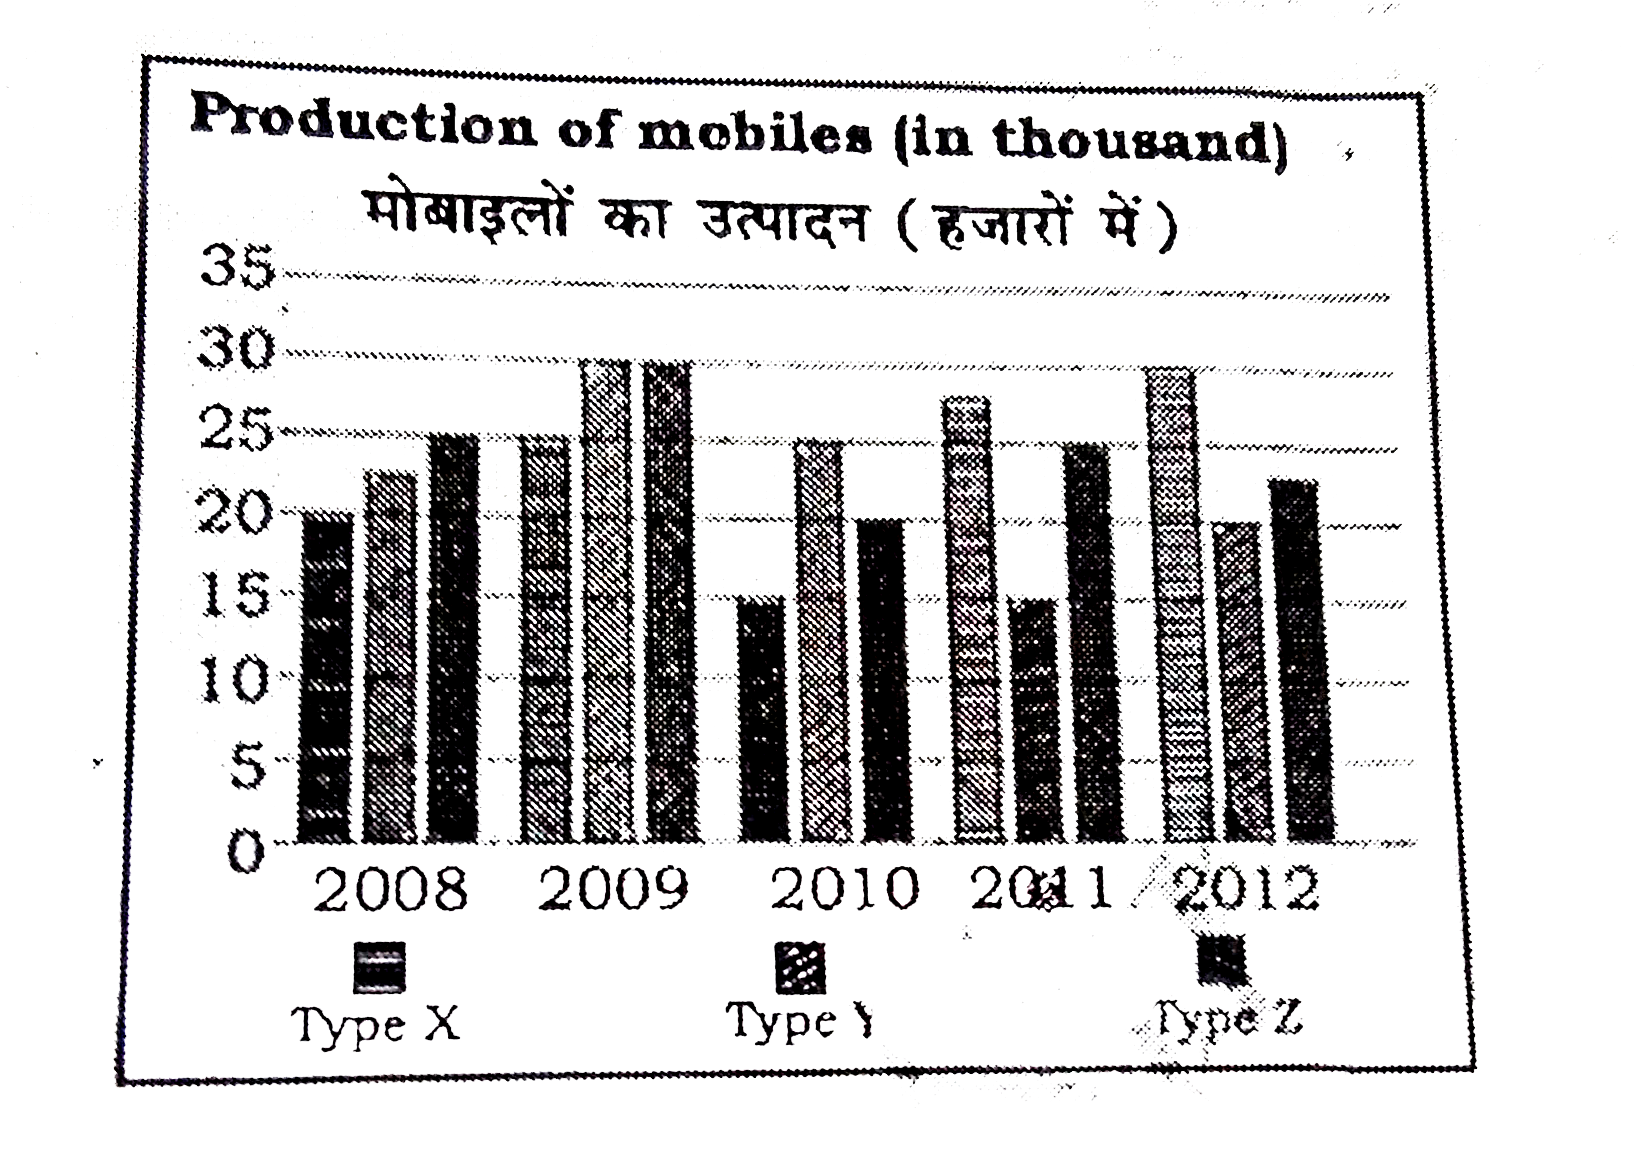
निमिन ग्राफ को ध्यानपूर्वक पढ़े और निचे दिए गए पर्सन का उतर दे?

वर्ष 2009-2010 से वर्ष तक बनाये गए Z प्रकार के मोबाइल की संख्या में कितने प्रतिसत की गिरावट हुई है?
0.25
0.5
0.333
0.3
2009 में बने Z प्रकार के मोबाइल की संख्या =30 हजार
2010 में बने Z प्रकार के मोबाइल की संख्या =20 हजार
गिरावट =30-20=10 हजार
गिरावट % =1030×100=33.33%
Similar Questions
The area of the shaded part in the figure given below is ______.

View SolutionThe inequation represented by the graph given below is :
View SolutionThe inequation that best describes the graph given below is _________
View SolutionThe inequation that best describes the following graph is _________
View SolutionWhich inequations represent the shaded region in the given figure
View SolutionMatch the followings (column I with column II)
ltimg src="https://d10lpgp6xz60nq.cloudfront.net/physics_images/NCERT_BIO_XI_C03_E01_011_Q01.png" width="80%"gt
View SolutionThe following line diagram represents the yearly sales figure of a company in the years 2001-2010. Examine the diagram and answer the question. निम्नलिखित रेखा आरेख किसी कंपनी की वर्ष 2007-2010 के दौरान वार्षिक बिक्री के आंकड़ों को दर्शाता है। आरेख का अध्ययन करें और नीचे दिए गए प्रश्नों के उत्तर दें- The ratio of sales in 2002 to that in 2007 is वर्ष 2002 में बिक्री का वर्ष 2007 में बिक्री के साथ अनुपात है-
View SolutionThe following line diagram represents the yearly sales figure of a company in the years 2001-2010. Examine the diagram and answer the question. निम्नलिखित रेखा आरेख किसी कंपनी की वर्ष 2007-2010 के दौरान वार्षिक बिक्री के आंकड़ों को दर्शाता है। आरेख का अध्ययन करें और नीचे दिए गए प्रश्नों के उत्तर दें- ............................................................................................................................................. Total sales (in crore of Rs.) from 2005 to 2008 is वर्ष 2005 से वर्ष 2008 तक कुल बिक्री (रु. करोड में) है-
View Solution
