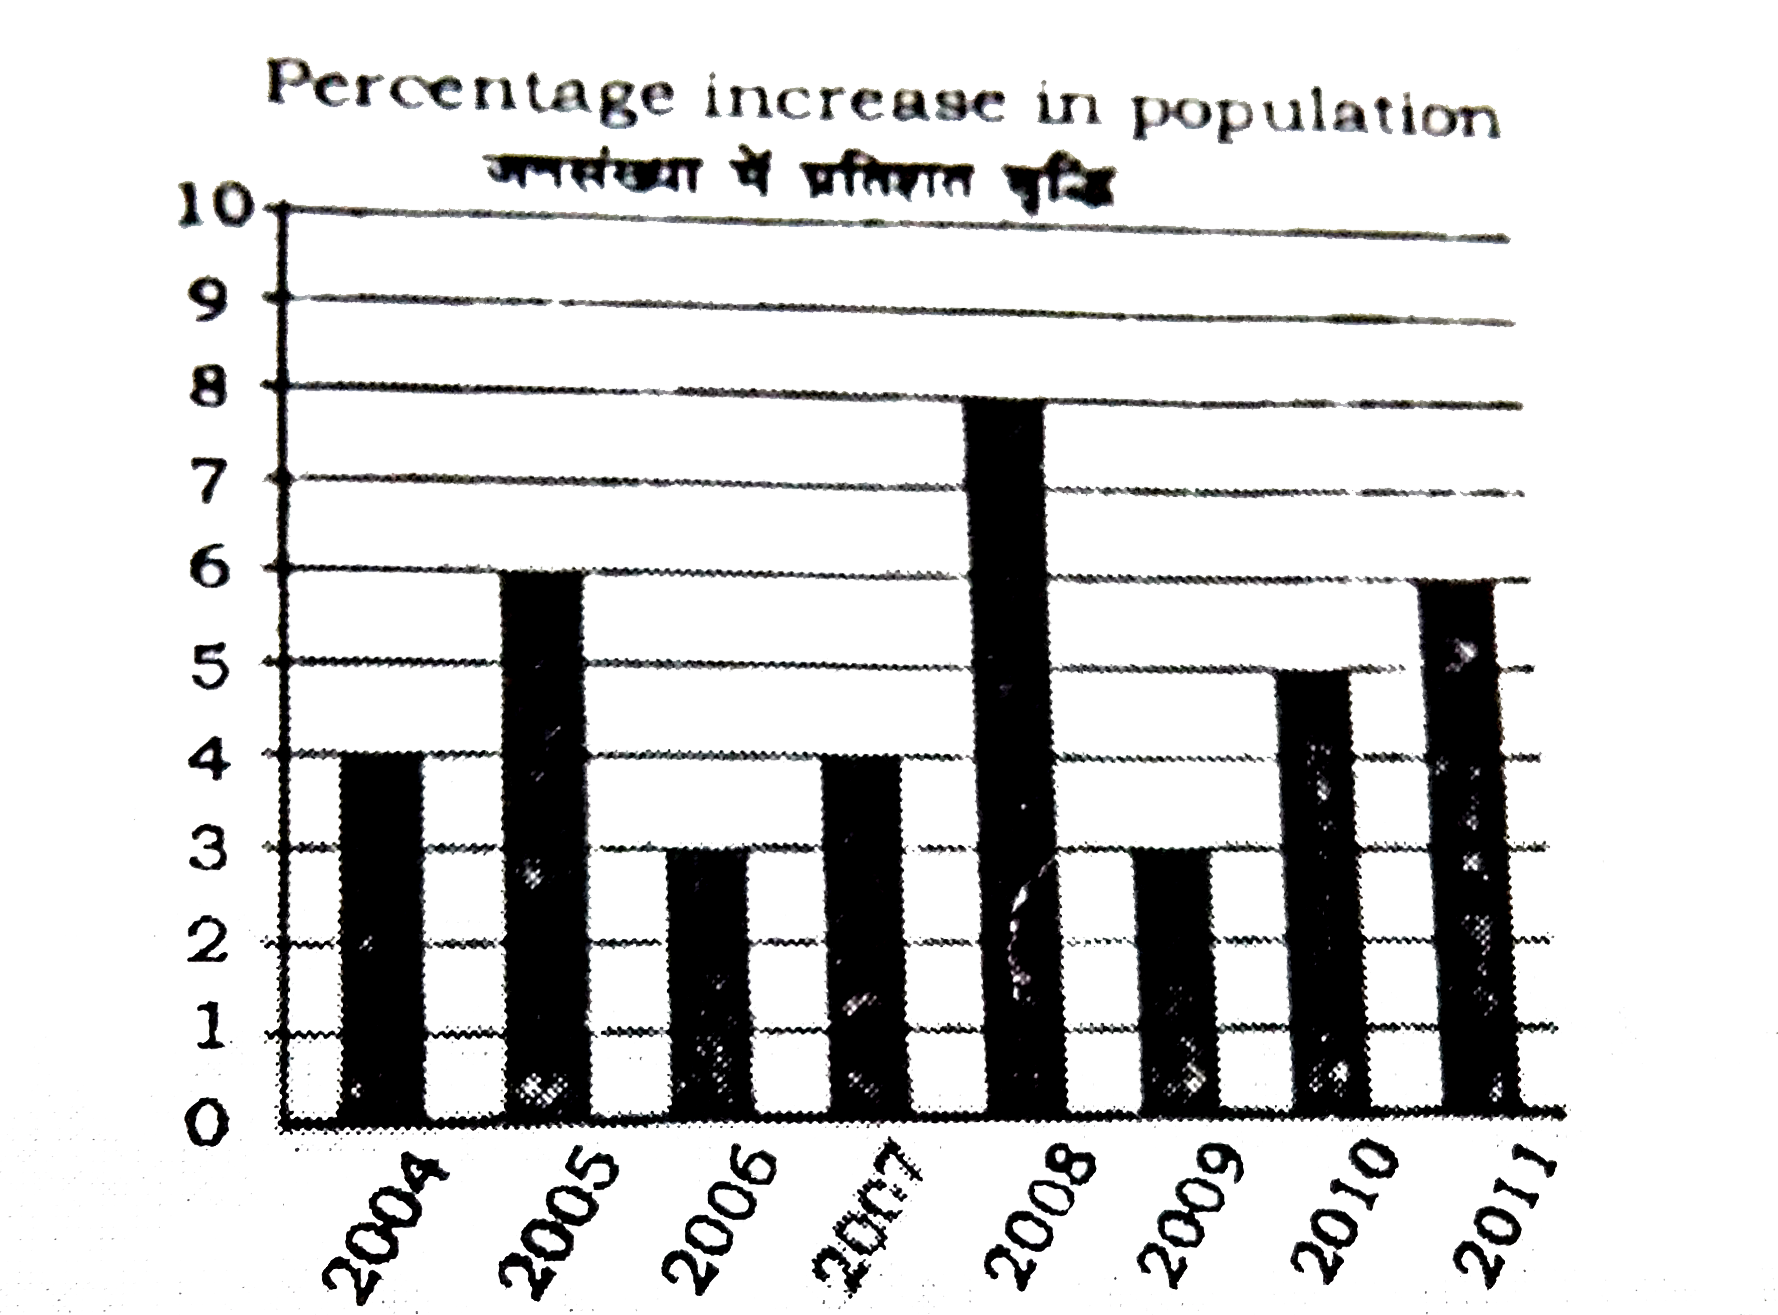
निमिन्लिखित तालिका दिए गए वर्षो में किसिस नगर की जनसख्या के प्रतिसत परिवर्तन को दर्शाती है! दिए गए चार्ट को पढ़े और पर्सन उतर दे!

2009 में नगर की जनसँख्या कितनी थी?
A
3
B
5
C
4
D
can't be determined
Video Solution
Text Solution
can't be dtermined
|
Similar Questions
The inequation that best describes the graph given below is _________
View SolutionThe inequation that best describes the following graph is _________
View SolutionWhich inequations represent the shaded region in the given figure
View Solutionभाषा की पाठ्य-पुस्तकों में दिए गए अभ्यास
View Solution'A' is the portion of adenophypophysis which secrets different hormones 'A' is____
View SolutionIdentify A,B,C and D,E
View SolutionConsider the following reactions.
View Solutionस्तंभ II में दिए गए आवर्त के साथ स्तंभ I में दिए गए तत्वों के परमाणु क्रमांक का मिलान कीजिए और उपयुक्त चयन को चिह्नित कीजिए।
View Solution
