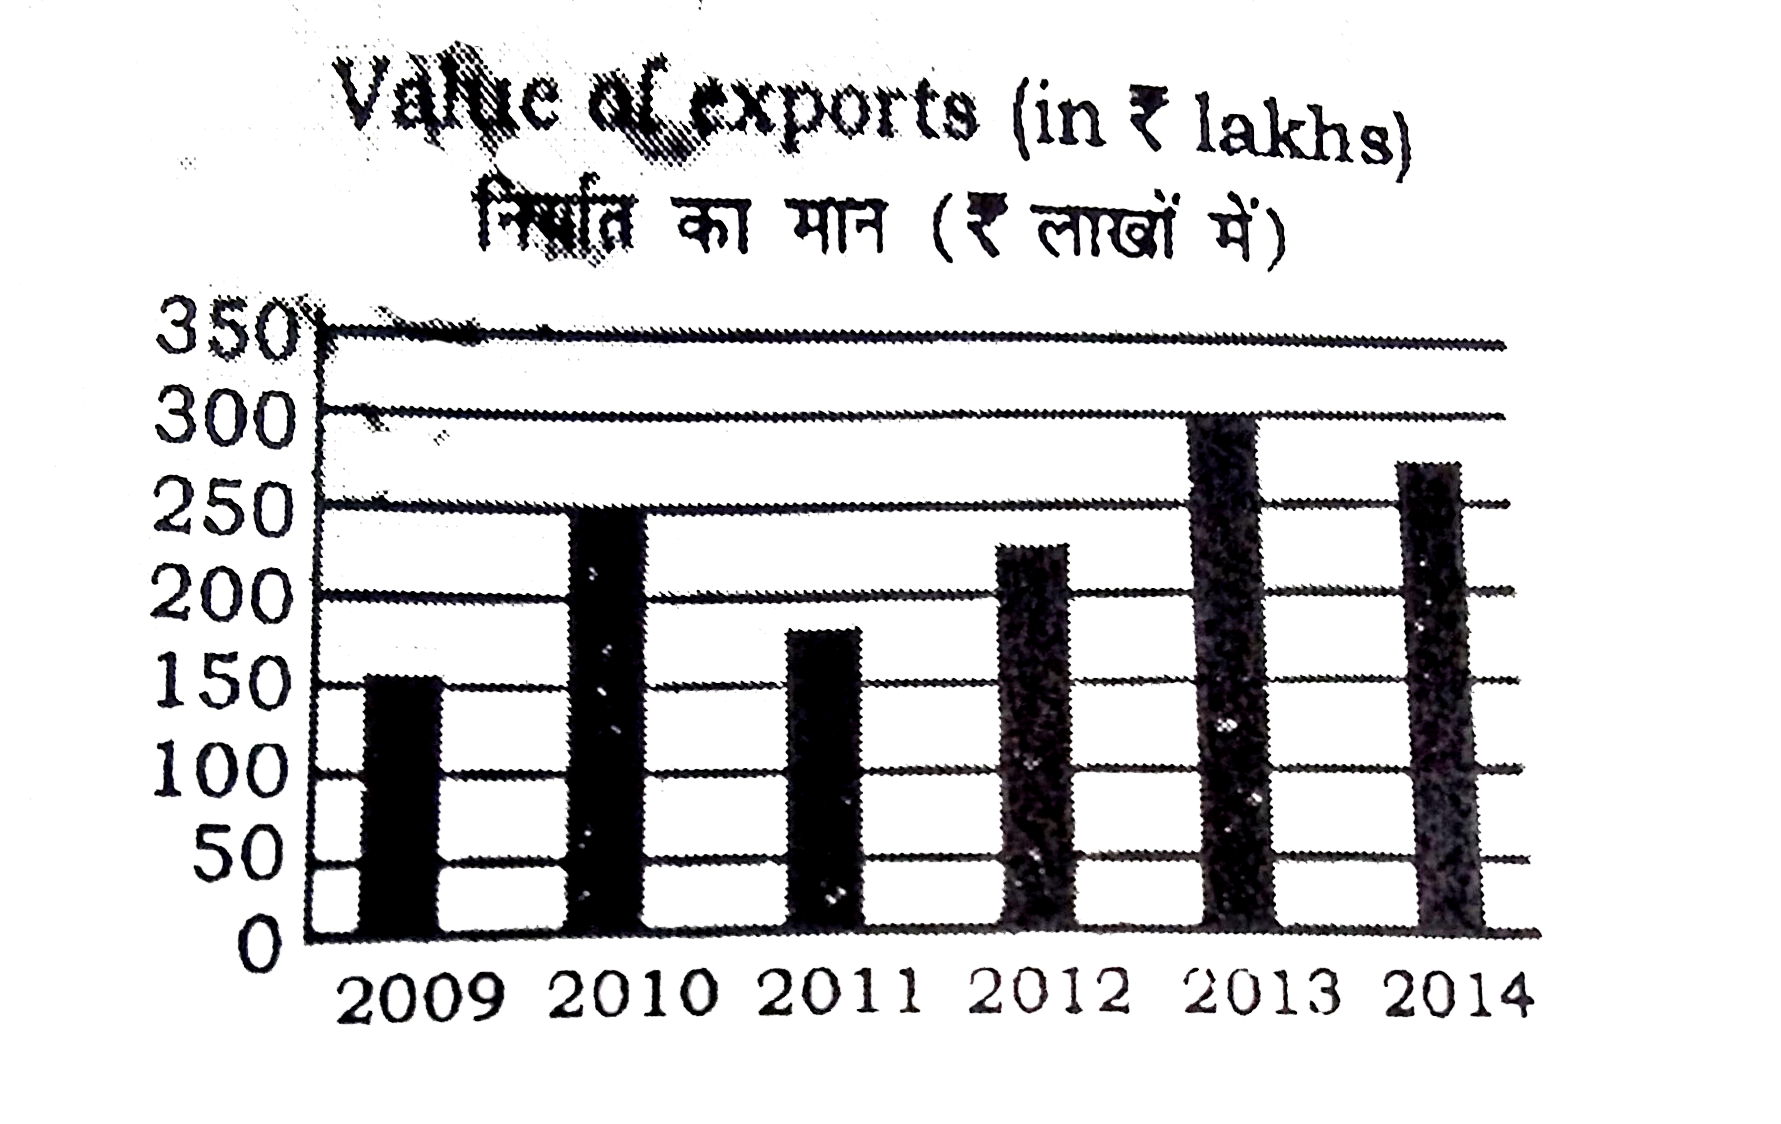
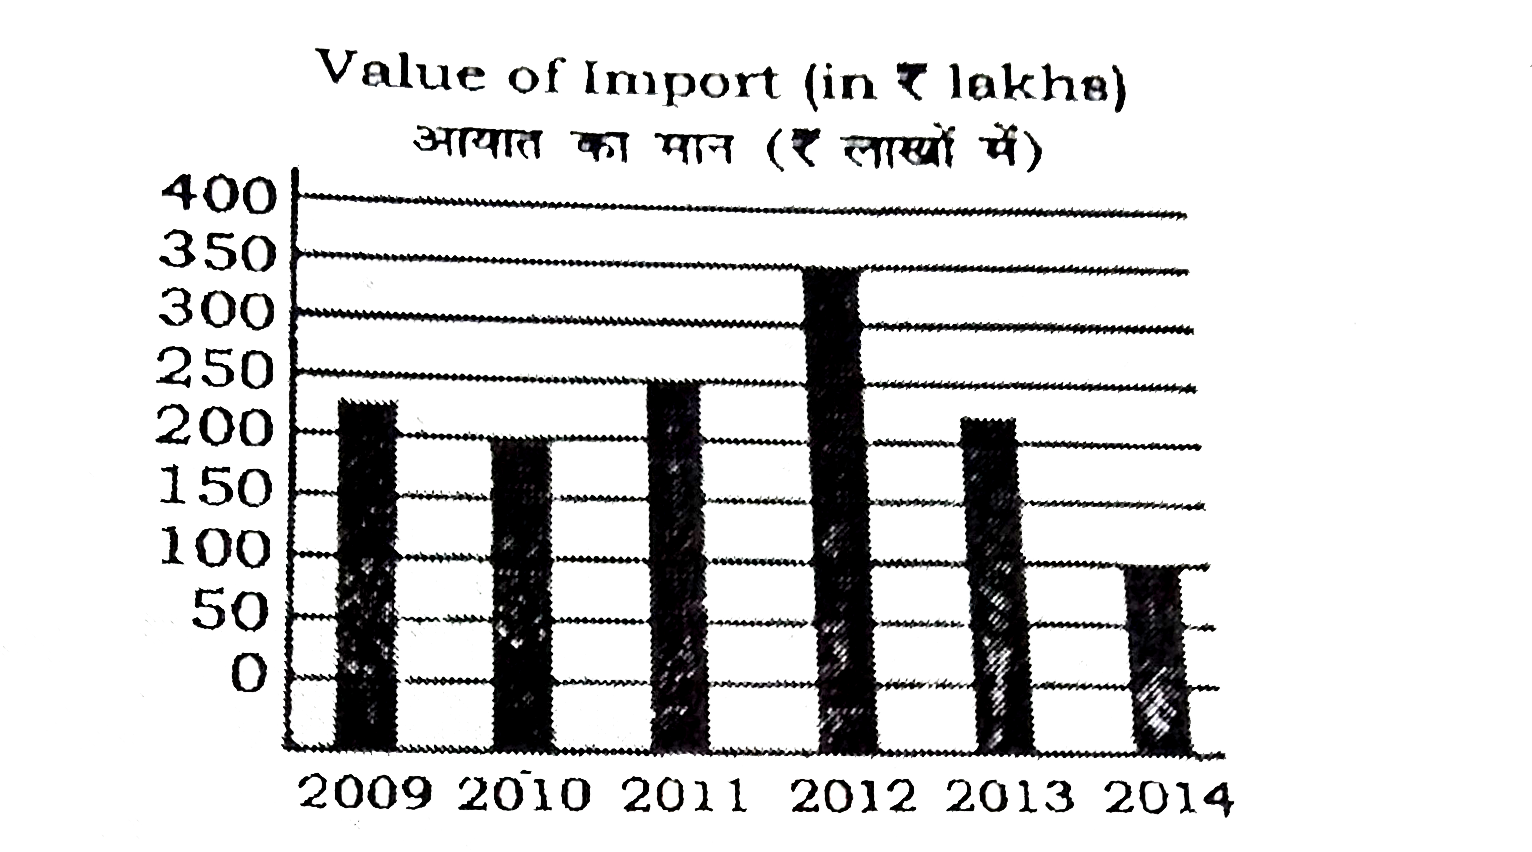
निमिन्लिखित आकड़े विगत वर्षो में एक कंपनी की आयत और निर्यात को दर्शाता है!निचे दिए गए पर्सेनो की उतर दे!


किस वर्ष आयात और निर्यात के बीच का अंतर सबसे काम था?
A
2009
B
2010
C
2011
D
2012
Video Solution
Text Solution
YearExports ImportsDifference2009150225752010250200502011175250752012225350125
In 2010 difference b/ w imports and exports is minimum
(2010 में निर्यात और आयत का अंतर सबसे काम है )
|
Similar Questions
Find the area of the figure given below.

View SolutionThe area of the shaded part in the figure given below is ______.

View SolutionThe inequation represented by the graph given below is :
View SolutionThe inequation that best describes the graph given below is _________
View SolutionThe inequation that best describes the following graph is _________
View SolutionWhich inequations represent the shaded region in the given figure
View SolutionIn the chemical reactions,
ltimg src="https://d10lpgp6xz60nq.cloudfront.net/physics_images/JM_10_CHE_P1_E01_009_S01.png" width="80%"gt
the compounds 'A' and 'B' respectively are
View SolutionMatch the followings (column I with column II)
ltimg src="https://d10lpgp6xz60nq.cloudfront.net/physics_images/NCERT_BIO_XI_C03_E01_011_Q01.png" width="80%"gt
View Solution
