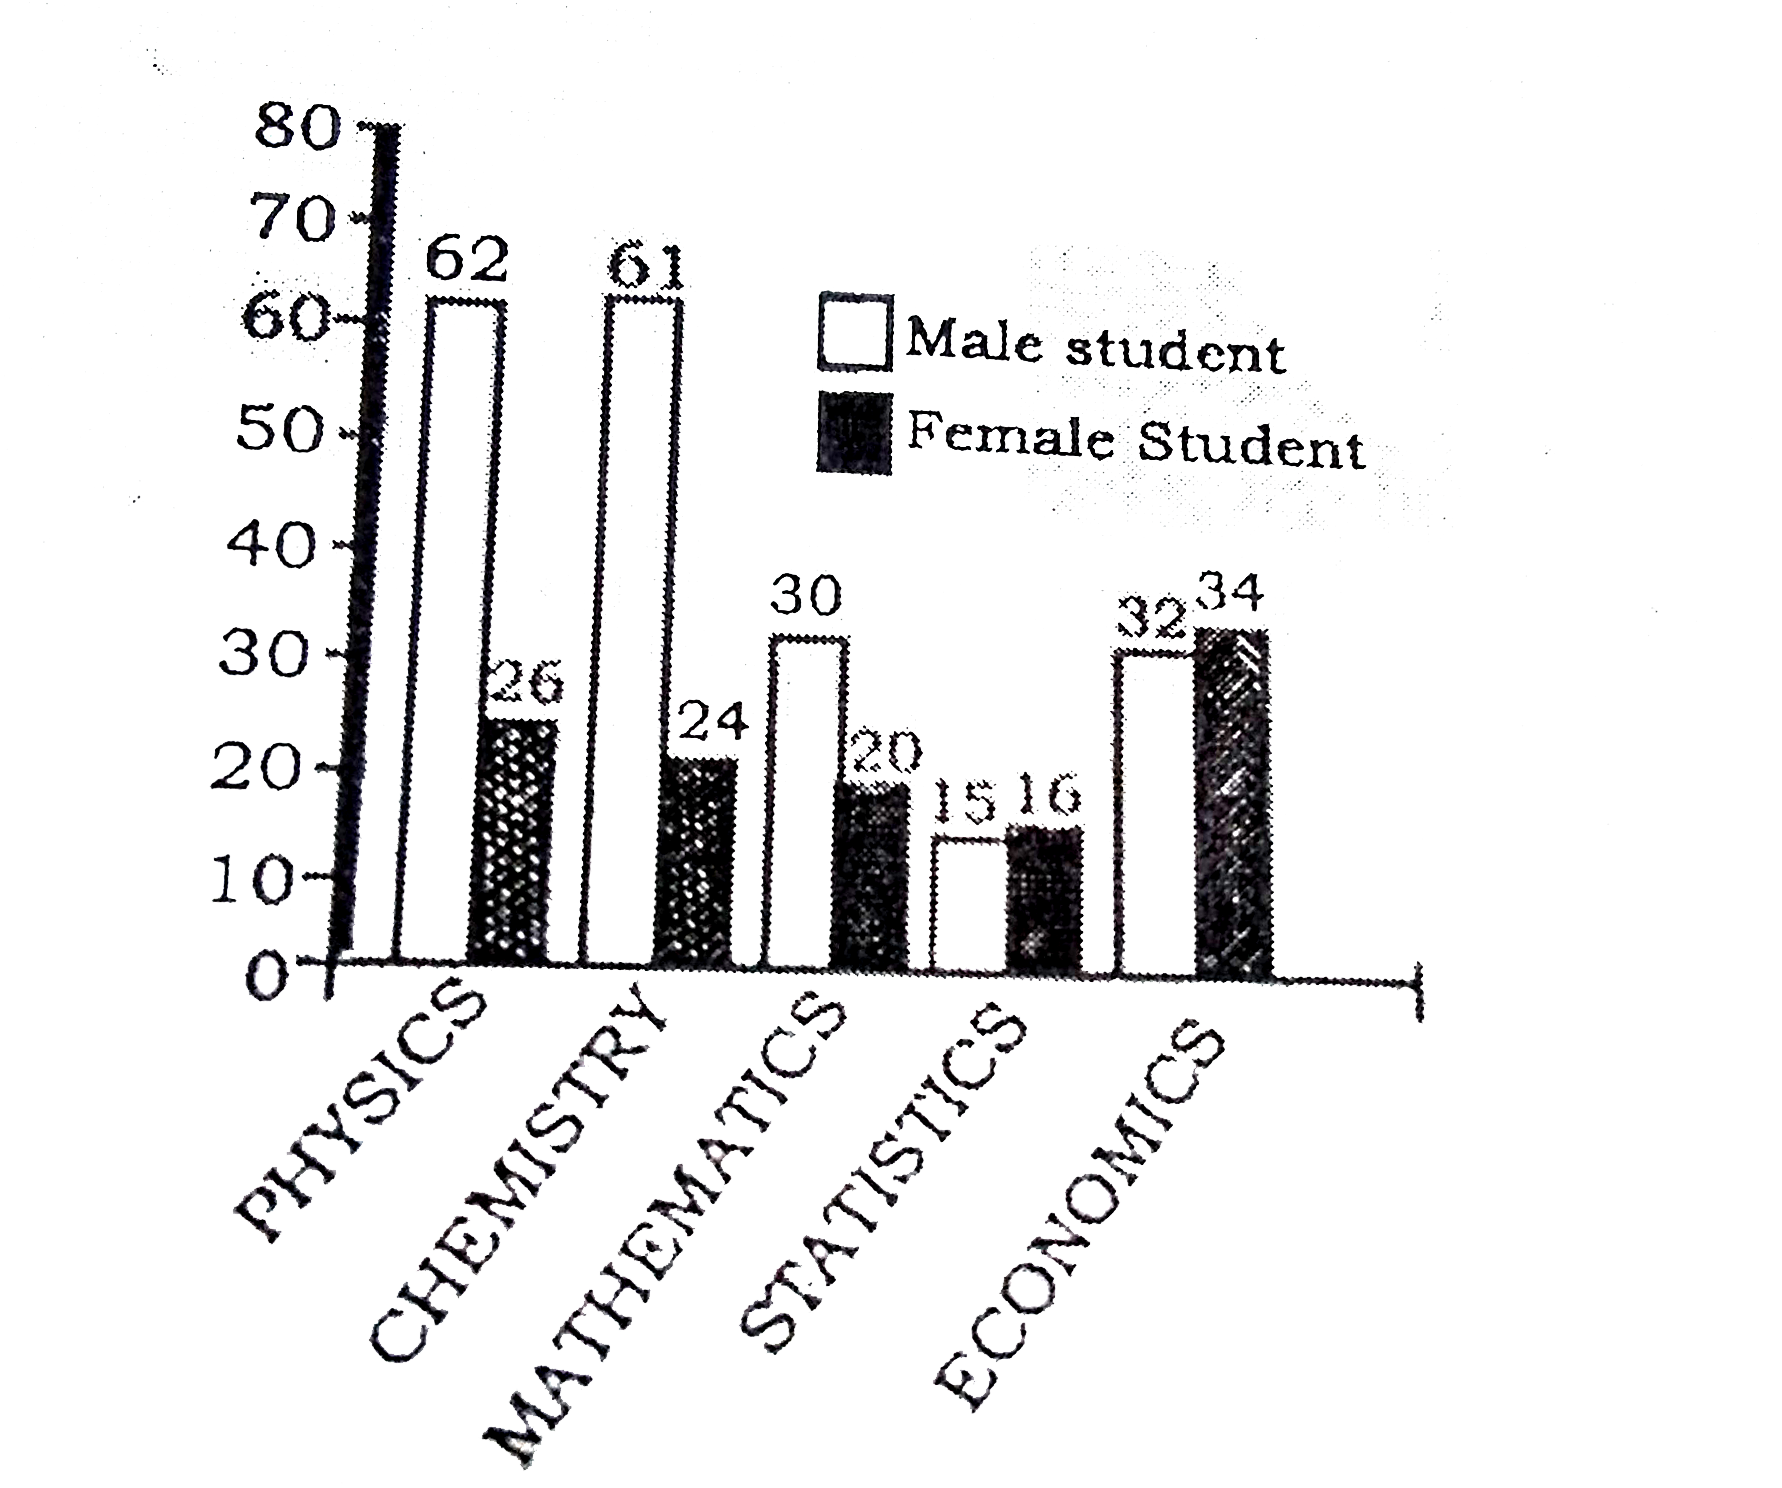
बार डायग्राम में दिए गए आकड़े किसी कॉलेज को बी ऐश सी (अनार्ष)प्रथम वर्ष की कक्षाओं में 320 छात्रों के पांच विषयो में विभागवार प्रवेश से सम्बंधित है प्राप्त का अध्यन कीजिये और पर्सेनो के उतर दीजिये?

गणित और अर्थशास्त्र में प्रवेश लेने वाली (महिला) छात्रों की कुल संख्या की तुलना में गणित और अर्थशास्त्र में प्रवेश लेने वाले (पुरुष ) छात्रों की कुल संख्या कितनी है?
more by 4.2%
more by 12.8%
more by 14.8%
less by 17%
Total number of male students students in Mathemal-ics and Economics =30+32=62
Total number of female students in mathematics
& Economics =20+34=54
Required %=62.5454×100
=854×100=40027%=14.8% more
Similar Questions
The table below shows the number of students enrolled in five colleges over the five years (2010 to 2014). यह तालिका पांच कॉलेजों में पांच वर्षों ( 2010 से 2014 ) के दौरान नामांकन लेने वाले छात्रों की संख्या दर्शाती है | The number of students studying in college E in the year 2013 is approximately what percent of the number of students studying in colleges B, C and D taken together in the year 2013 (nearest to one decimal place) वर्ष 2013 में कॉलेज E में पढ़ रहे छात्रों की संख्या वर्ष 2013 में कॉलेज B, C एवं D में पढ़ने वाले छात्रों की कुल संख्या का लगभग कितना प्रतिशत है ? ( एक दशमलव स्थान के निकटतम )
View SolutionThis table shows the number of students studying in various streams in different colleges. निम्नलिखित तालिका पांच कॉलेजों के तीन विषयों में पढ़ने वाले छात्रों की संख्या दर्शाती है | The number of students in the science stream of college C is approximately what percentage of students studying in that college? कॉलेज C में विज्ञान विषय में छात्रों की संख्या उस कॉलेज में पढ़ने वाले छात्रों की संख्या का लगभग कितना प्रतिशत है ?
View SolutionThe given Bar Graph presents the number of students enrolled for a vocational course in institutes A and B during a period of five years. दिया गया दंड आरेख A और B संस्थानों में पांच वर्षों की अवधि के दौरान व्यावसायिक पाठ्यक्रमों नामांकन लेने वाले छात्रों की संख्या को दर्शाता है | The average number of students (per year) enrolled in B during 2015, 2016 and 2018 is what percentage more than the number of students enrolled in A during 2017? 2015, 2016 और 2018 में B में नामांकन ( प्रति वर्ष ) लेने वाले छात्रों की औसत संख्या 2017 के दौरान A में नामांकन लेने वाले छात्रों की संख्या से कितना प्रतिशत अधिक है ?
View SolutionThe given Bar Graph presents the number of students enrolled for a vocational course in institutes A and B during a period of five years. दिया गया दंड आरेख A और B संस्थानों में पांच वर्षों की अवधि के दौरान व्यावसायिक पाठ्यक्रमों नामांकन लेने वाले छात्रों की संख्या को दर्शाता है | The total number of students enrolled in A during 2014, 2016 and 2018 is what percentage (correct to one decimal place) of the total number of students enrolled in B during the five years? 2014, 2016 और 2018 में A में नामांकन लेने वाले छात्रों की कुल संख्या इन पांच वर्षों के दौरान B में नामांकन लेने वाले छात्रों की कुल संख्या का कितना प्रतिशत ( एक दशमलव स्थान तक सही ) है ?
View SolutionThe given Bar Graph presents the number of students of two schools for six years. दिया गया दंड आरेख छः वर्ष की अवधि में दो विद्यालयों में छात्रों की संख्या को दर्शाता है | In which year, the percentage increase in students in school B is the highest in comparison to its previous year? किस वर्ष में, विद्यालय B में छात्रों की संख्या में प्रतिशत वृद्धि इसके पिछले वर्ष की तुलना में सबसे अधिक रही है?
View SolutionThe given Bar Graph presents the number of students of two schools for six years. दिया गया दंड आरेख छः वर्ष की अवधि में दो विद्यालयों में छात्रों की संख्या को दर्शाता है | In which year, the percentage increase of students in school A is the highest in comparison to its previous year? किस वर्ष, विद्यालय A में छात्रों की संख्या में प्रतिशत वृद्धि पिछले वर्ष की तुलना में सर्वाधिक है ?
View SolutionIn the given bar graph, the percentage decrease in the number of students in Institute A in 2016 is what percent of students in 2015. इस दंड आरेख में संस्थान A में 2016 में छात्रों की संख्या में प्रतिशत कमी 2015 के छात्रों की संख्या का क्या प्रतिशत है ?
View SolutionThe Table shows the number of students from different schools playing different games. यह तालिका अलग-अलग विद्यालयों के छात्रों की संख्या को दर्शाती है जो अलग-अलग खेल खेलते हैं ? What is the ratio of the total students who play cricket in schools A and B together to the total students who play hockey in schools C and D ? विद्यालय A और B में क्रिकेट खेलने वाले छात्रों की कुल संख्या का विद्यालय C और D में हॉकी खेलने वाले छात्रों की कुल संख्या के साथ क्या अनुपात है ?
View Solution
