Given graph is drawn on the parameters of growth versus time. Here A,B and C respetively represent
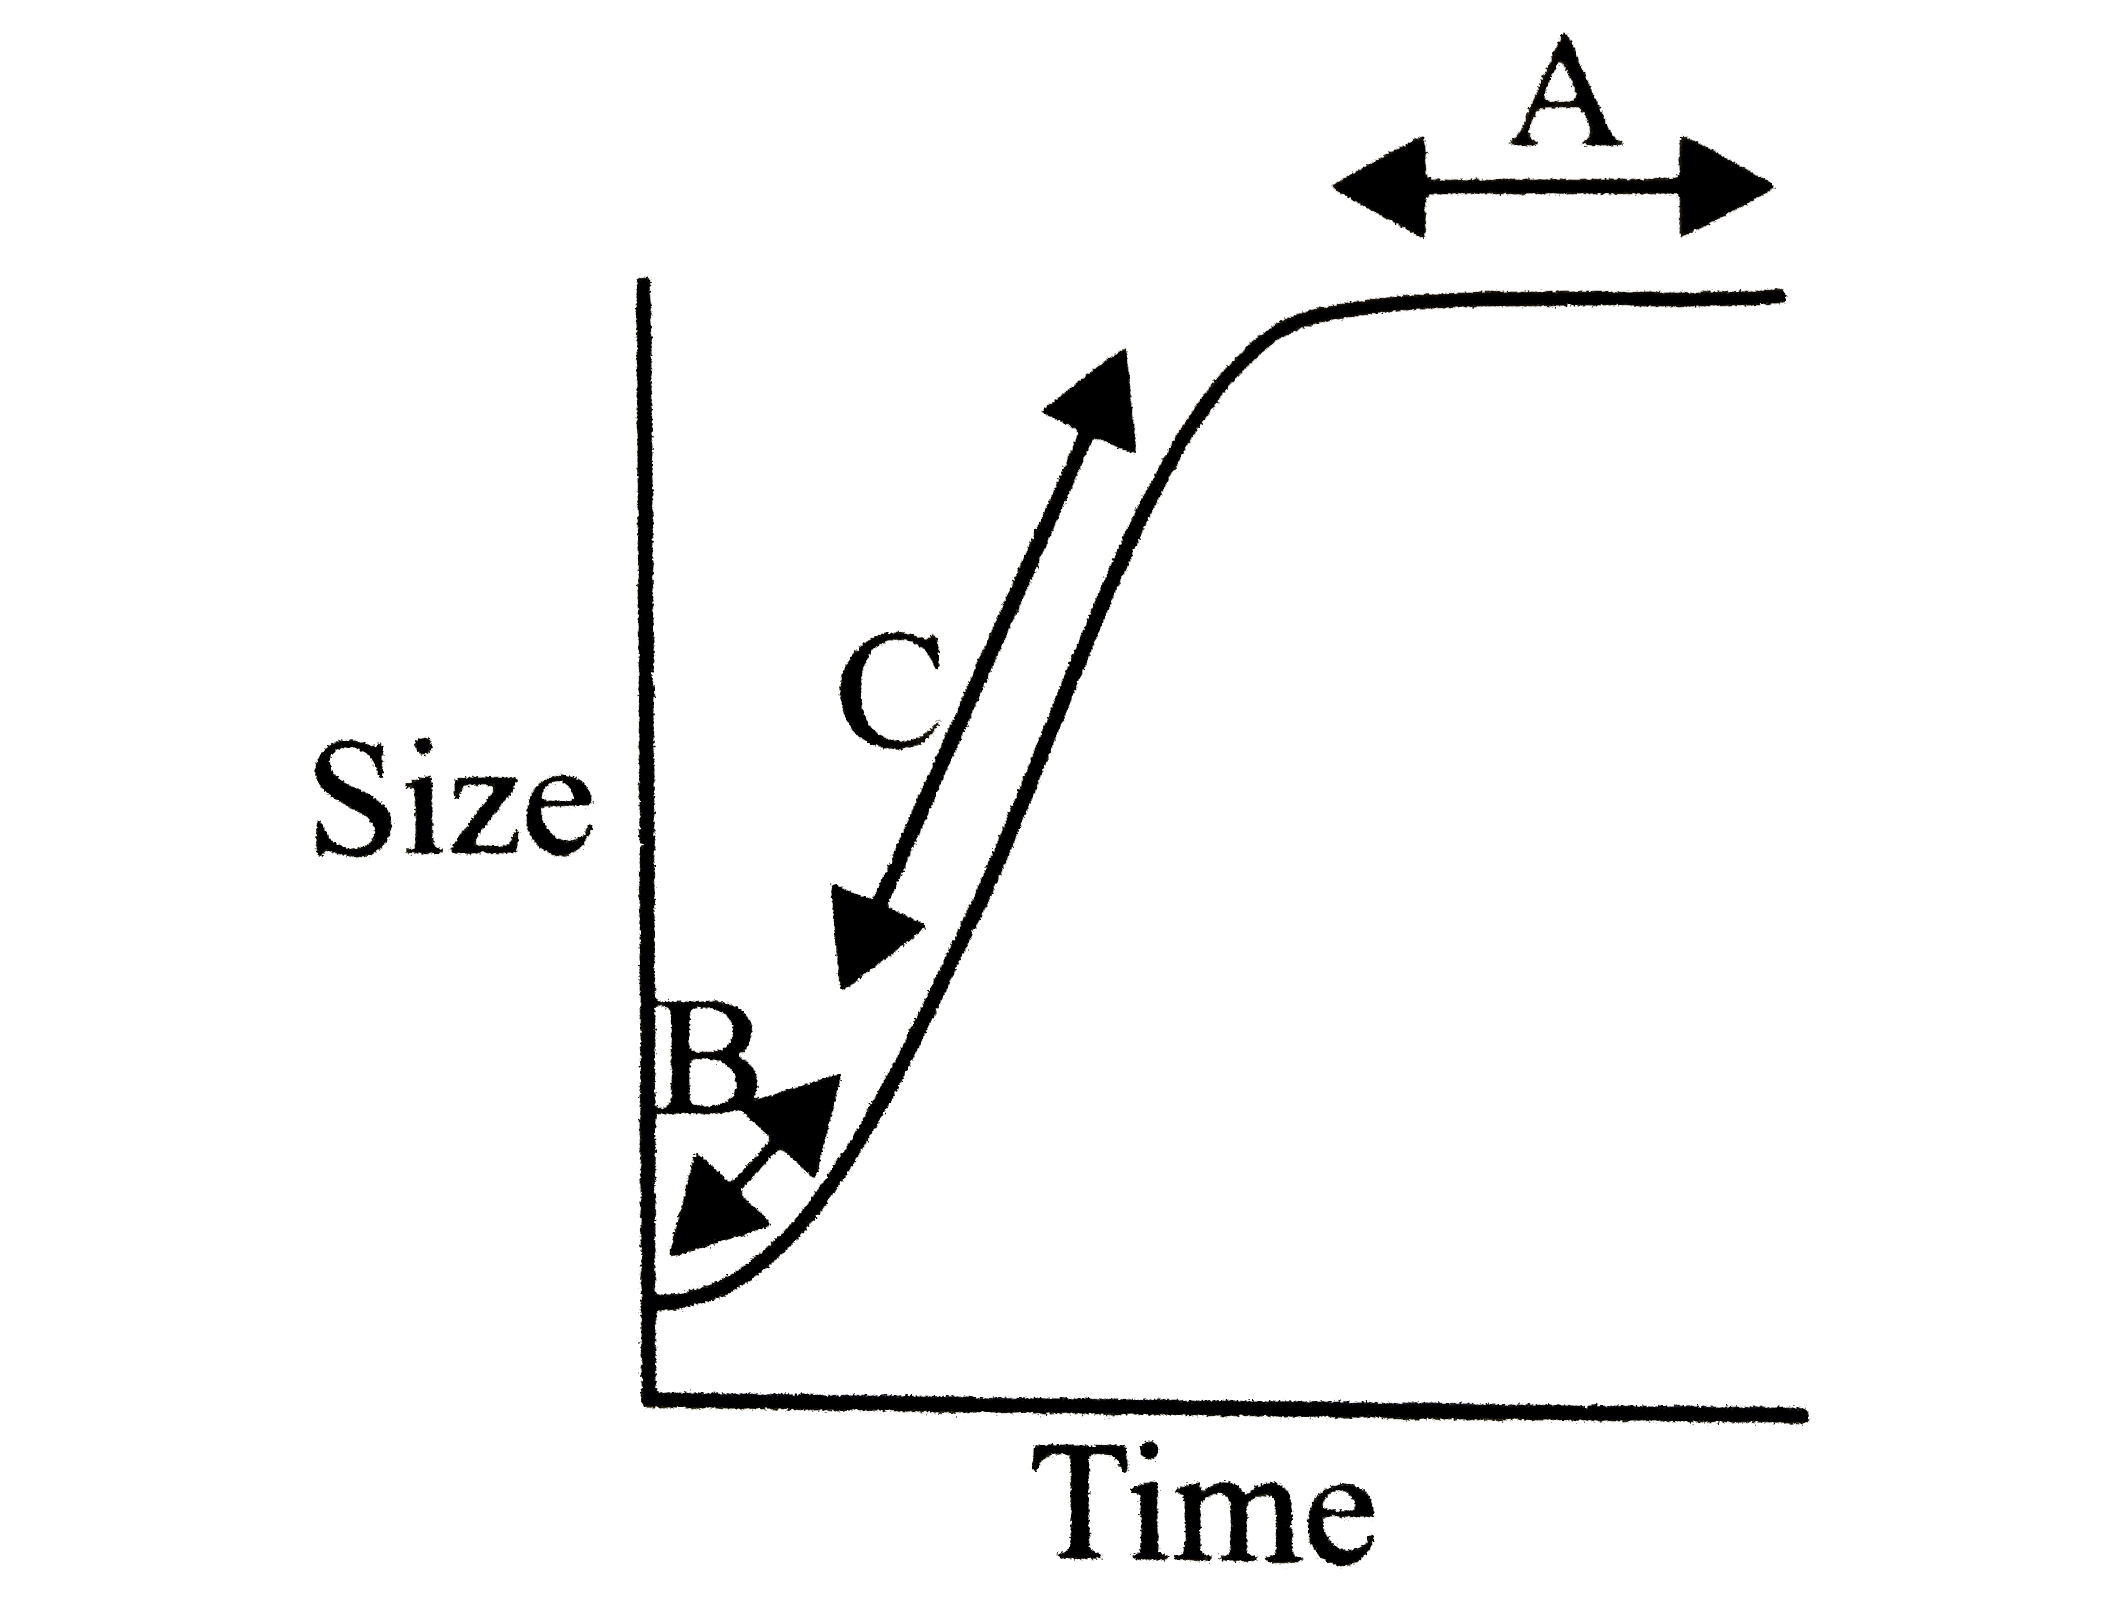
Steady state phase, Lag phase and Log phase
Lag phase, Log phase and Steady state phase
Exponential phase, Log phase and Steady state phase
Slow growing phase, Lag phase and Steady state phase
The correct Answer is:A
Step by step video, text & image solution for Given graph is drawn on the parameters of growth versus time. Here A,B and C respetively represent by Biology experts to help you in doubts & scoring excellent marks in Class 12 exams.
Updated on:21/07/2023Topper's Solved these Questions
- POPULATION : INTERACTIONS AND ATTRIBUTESBOOK - GRB PUBLICATIONCHAPTER - POPULATION : INTERACTIONS AND ATTRIBUTESEXERCISE - NCERT Corner (Exemplar Problems)
32 Videos
- PLANT BREEDING AND TISSUE CULTUREBOOK - GRB PUBLICATIONCHAPTER - PLANT BREEDING AND TISSUE CULTUREEXERCISE - NCERT CORNER
15 Videos
- REPRODUCTION IN ORGANISMSBOOK - GRB PUBLICATIONCHAPTER - REPRODUCTION IN ORGANISMSEXERCISE - EXEMPLAR PROBLEMS
33 Videos
Similar Questions
Knowledge Check
Given below is a graph drawn on the parameters of growth versus time A,B and C respectively represent.
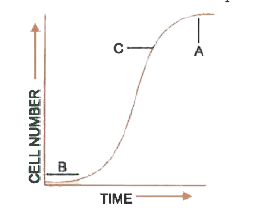 AExponential phase, lag phase nd steady state phaseBSteady state phase, lag phase and log phaseCSlow growing phase, lag phase and steady state phaseDLag phase, steady state phase and log phase
Given below is a graph drawn on the parameters of growth versus time A,B and C respectively represent.
 AExponential phase, log phase and steady state phaseBSteady state phase, lag phase and log phaseCLog phase, steady state phase and logarithmic phaseDLog phase, lag phase and steady state phase
Given below is a graph on the parametes of growth versus time A,B , C respectively represent
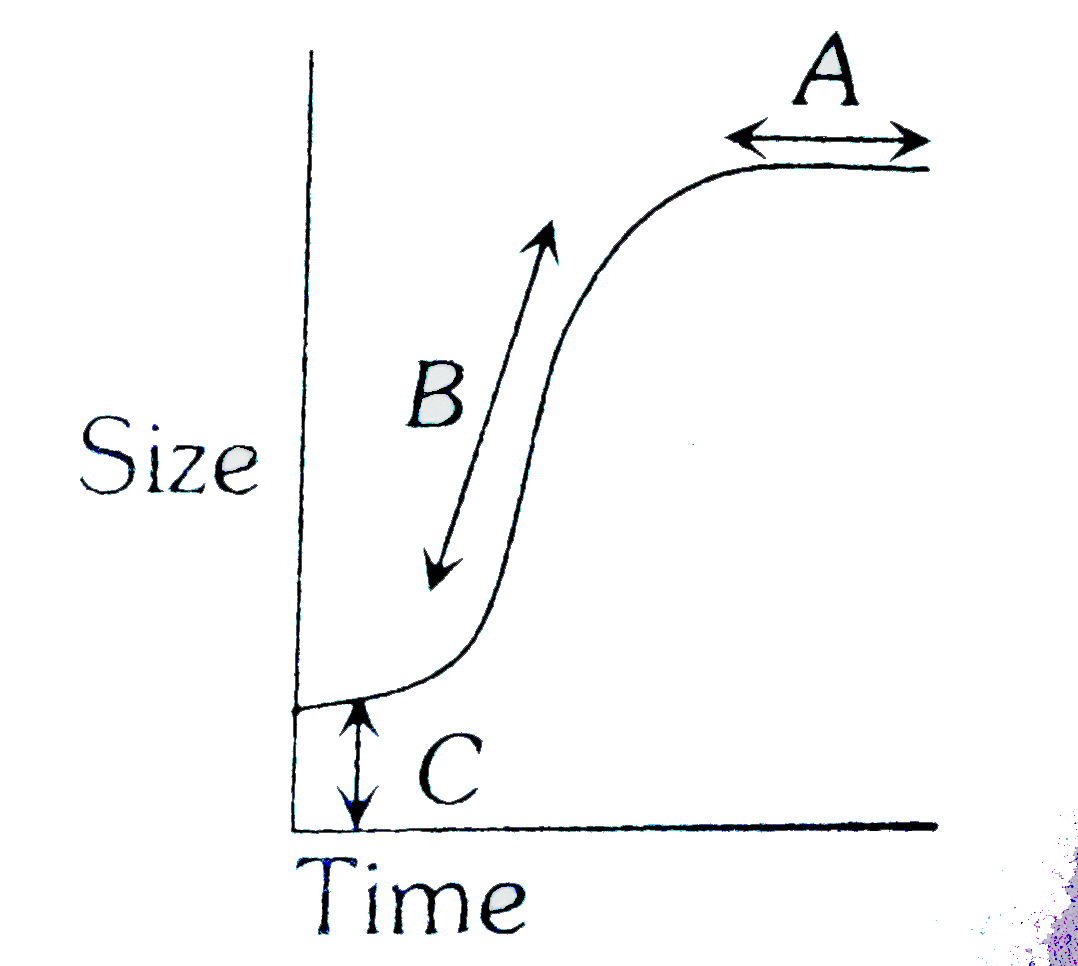 AExponential phase ,log phase and steasdy state phaseBSteady state phase ,log phase and log phaseCSlow growing phase , log phase and steady atate state phaseDLag phase , steady state phase and logarithmic phase
For the given graph, which parameters will be zero?

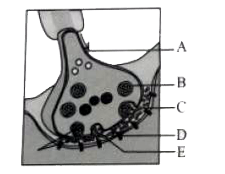
View SolutionThe given diagram shows axon terminal and synapse. Here A,B,C,D and E respectively represent
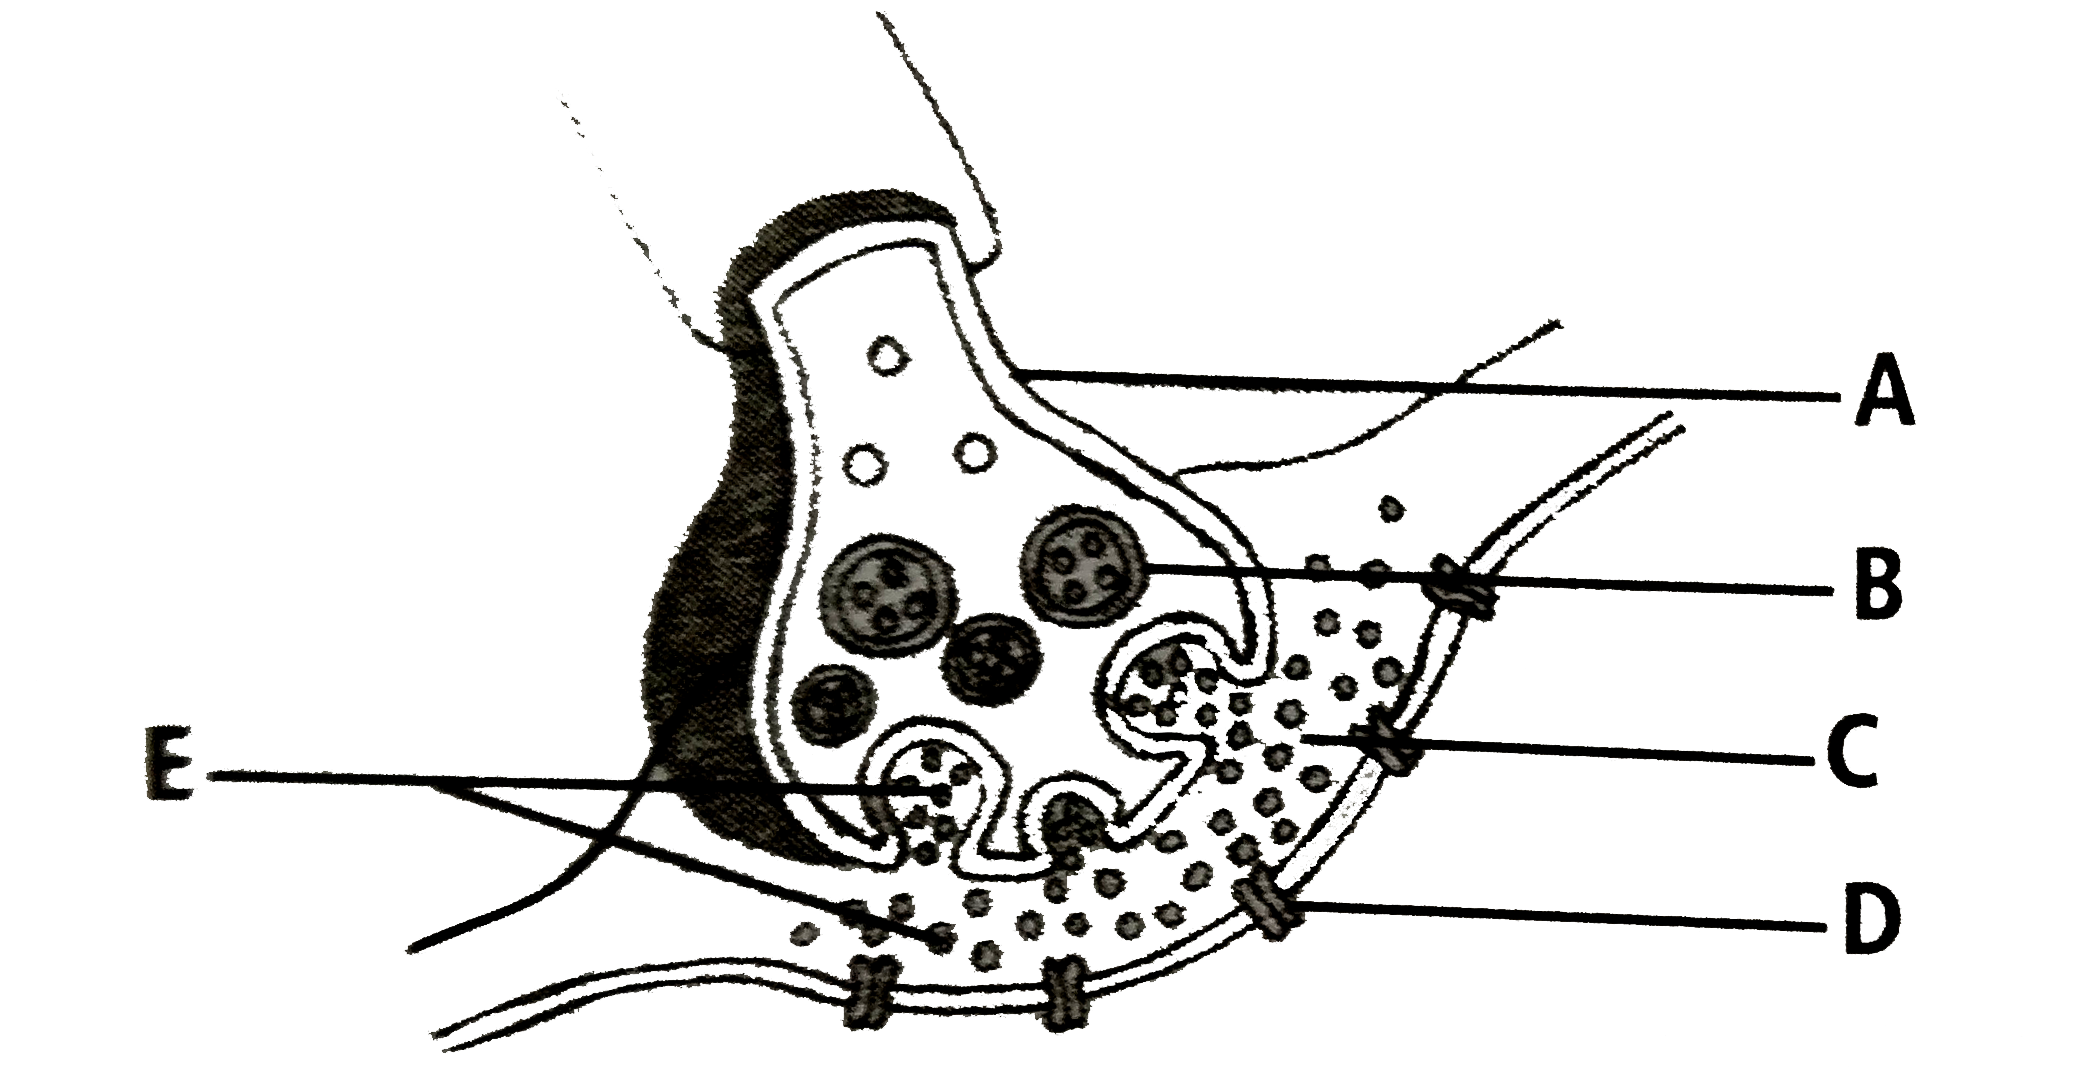
View SolutionThe given diagram shows axon terminal and synapse. Here A,B,C,D and E, respectively represent.
View SolutionIf we plot the parameter of growth against time the curve obtained is known as,
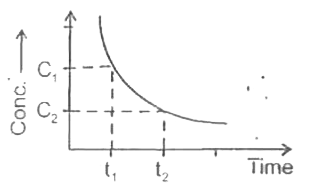
View SolutionThe graph plotted between concentration versus time
View Solution
