Diagrammatic representation of Miller's experiment is given below.
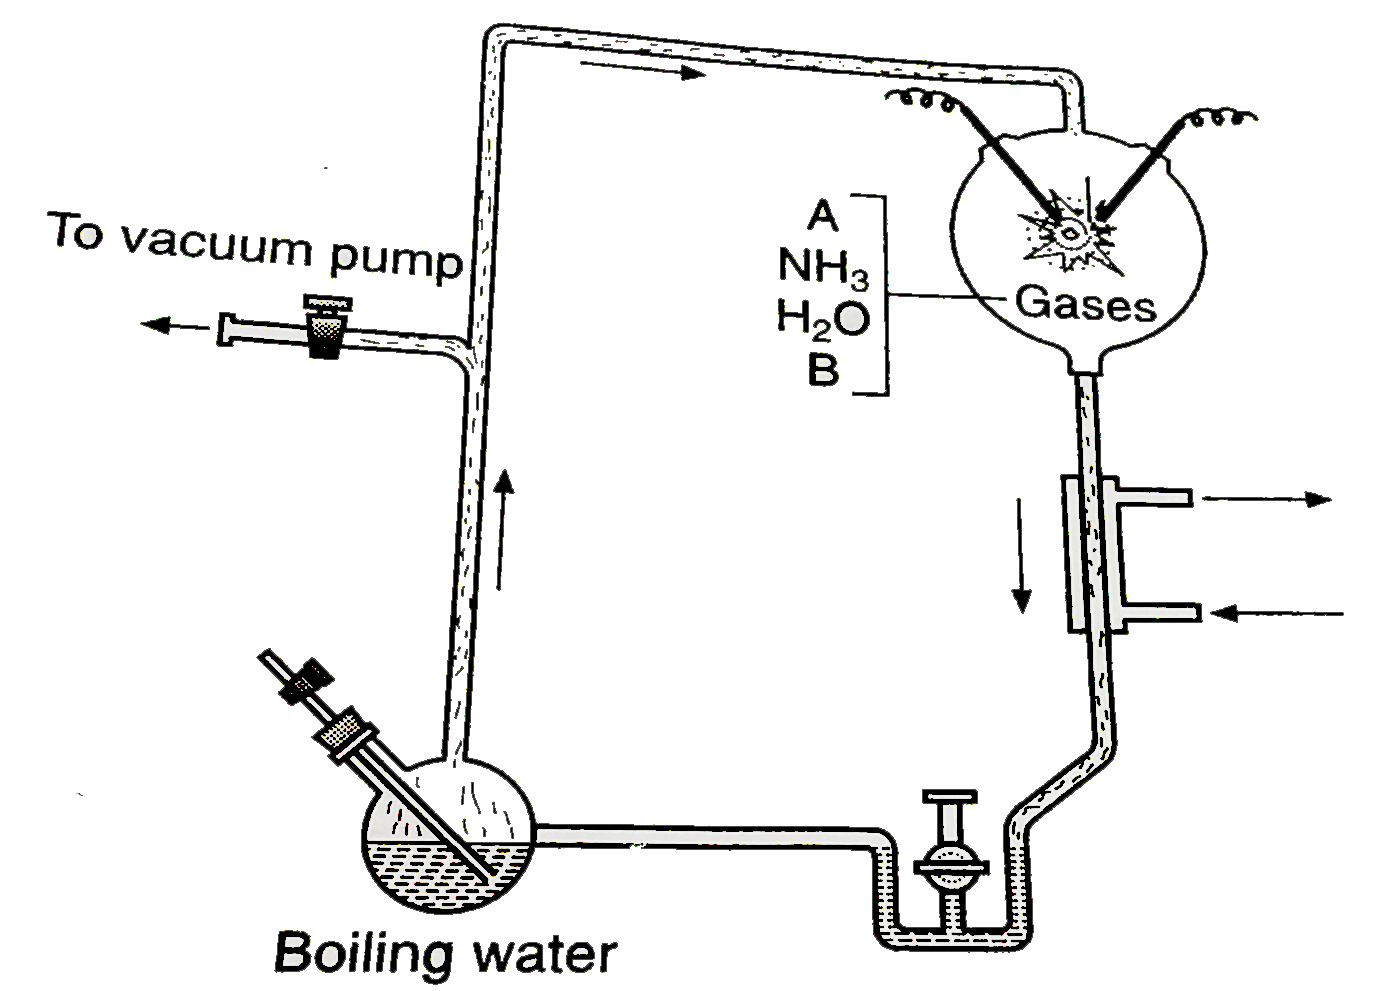
Identify the gases marked A and B:
Hydrogen and oxygen
Hydrogen and nitrogen
Methane and hydrogen
Methane and carbon dioxide
The correct Answer is:C
Step by step video, text & image solution for Diagrammatic representation of Miller's experiment is given below. Identify the gases marked A and B: by Biology experts to help you in doubts & scoring excellent marks in Class 12 exams.
Updated on:21/07/2023Topper's Solved these Questions
- Human Evolution BOOK - GRB PUBLICATIONCHAPTER - Human Evolution EXERCISE - Assertion-Reason Type Questions
86 Videos
- Human Evolution BOOK - GRB PUBLICATIONCHAPTER - Human Evolution EXERCISE - Assertion-Reason Type Questions
86 Videos
- GENE EXPRESSION AND REGULATIONBOOK - GRB PUBLICATIONCHAPTER - GENE EXPRESSION AND REGULATIONEXERCISE - NCERT Corner(Exemplar Problems)
46 Videos
- HUMAN GENETICSBOOK - GRB PUBLICATIONCHAPTER - HUMAN GENETICSEXERCISE - EXEMPLAR PROBLEMS
1 Videos
Similar Questions
Study the diagrammatic representation of S.L. Miller's experiment given below and answer the questions that follow: (a) How did S.L. Miller create the conditions which existed before the origin of any life on Earth (b) Name the organic compound formed and collected at the end of his experiment. (c)Mention the kind of evolution is experiment supports

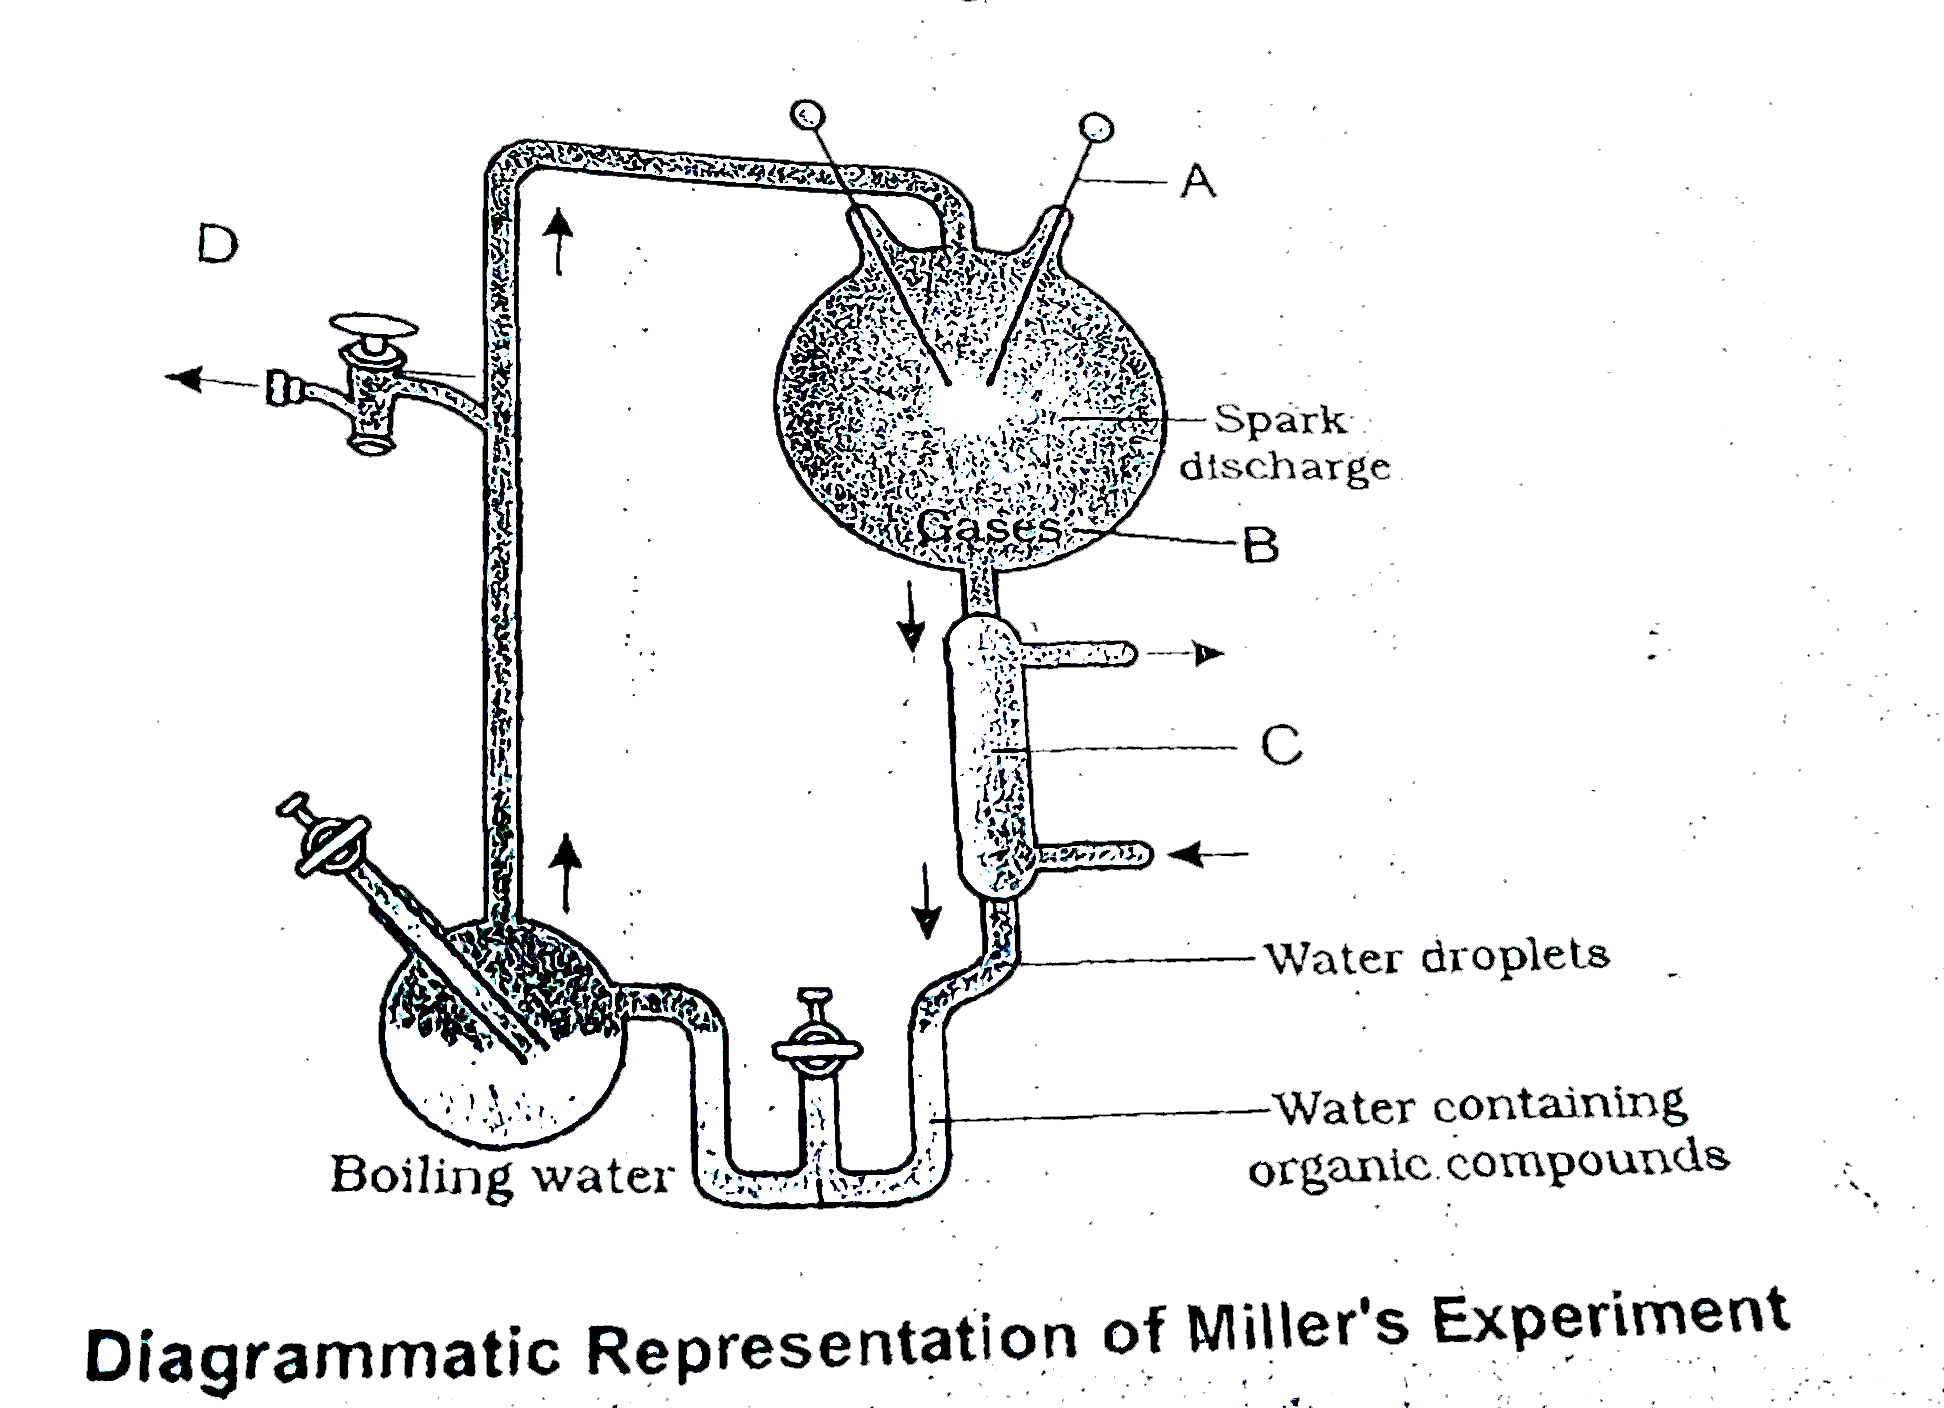
View SolutionFollowing is the diagrammatic representation of Miller's experiment. What is correct labelling? Choose the correct option.
View Solution
Knowledge Check
Diagrammatic representation of trophic levels in an ecosystem is given below. Identify A, B, C and D by selecting correct option:
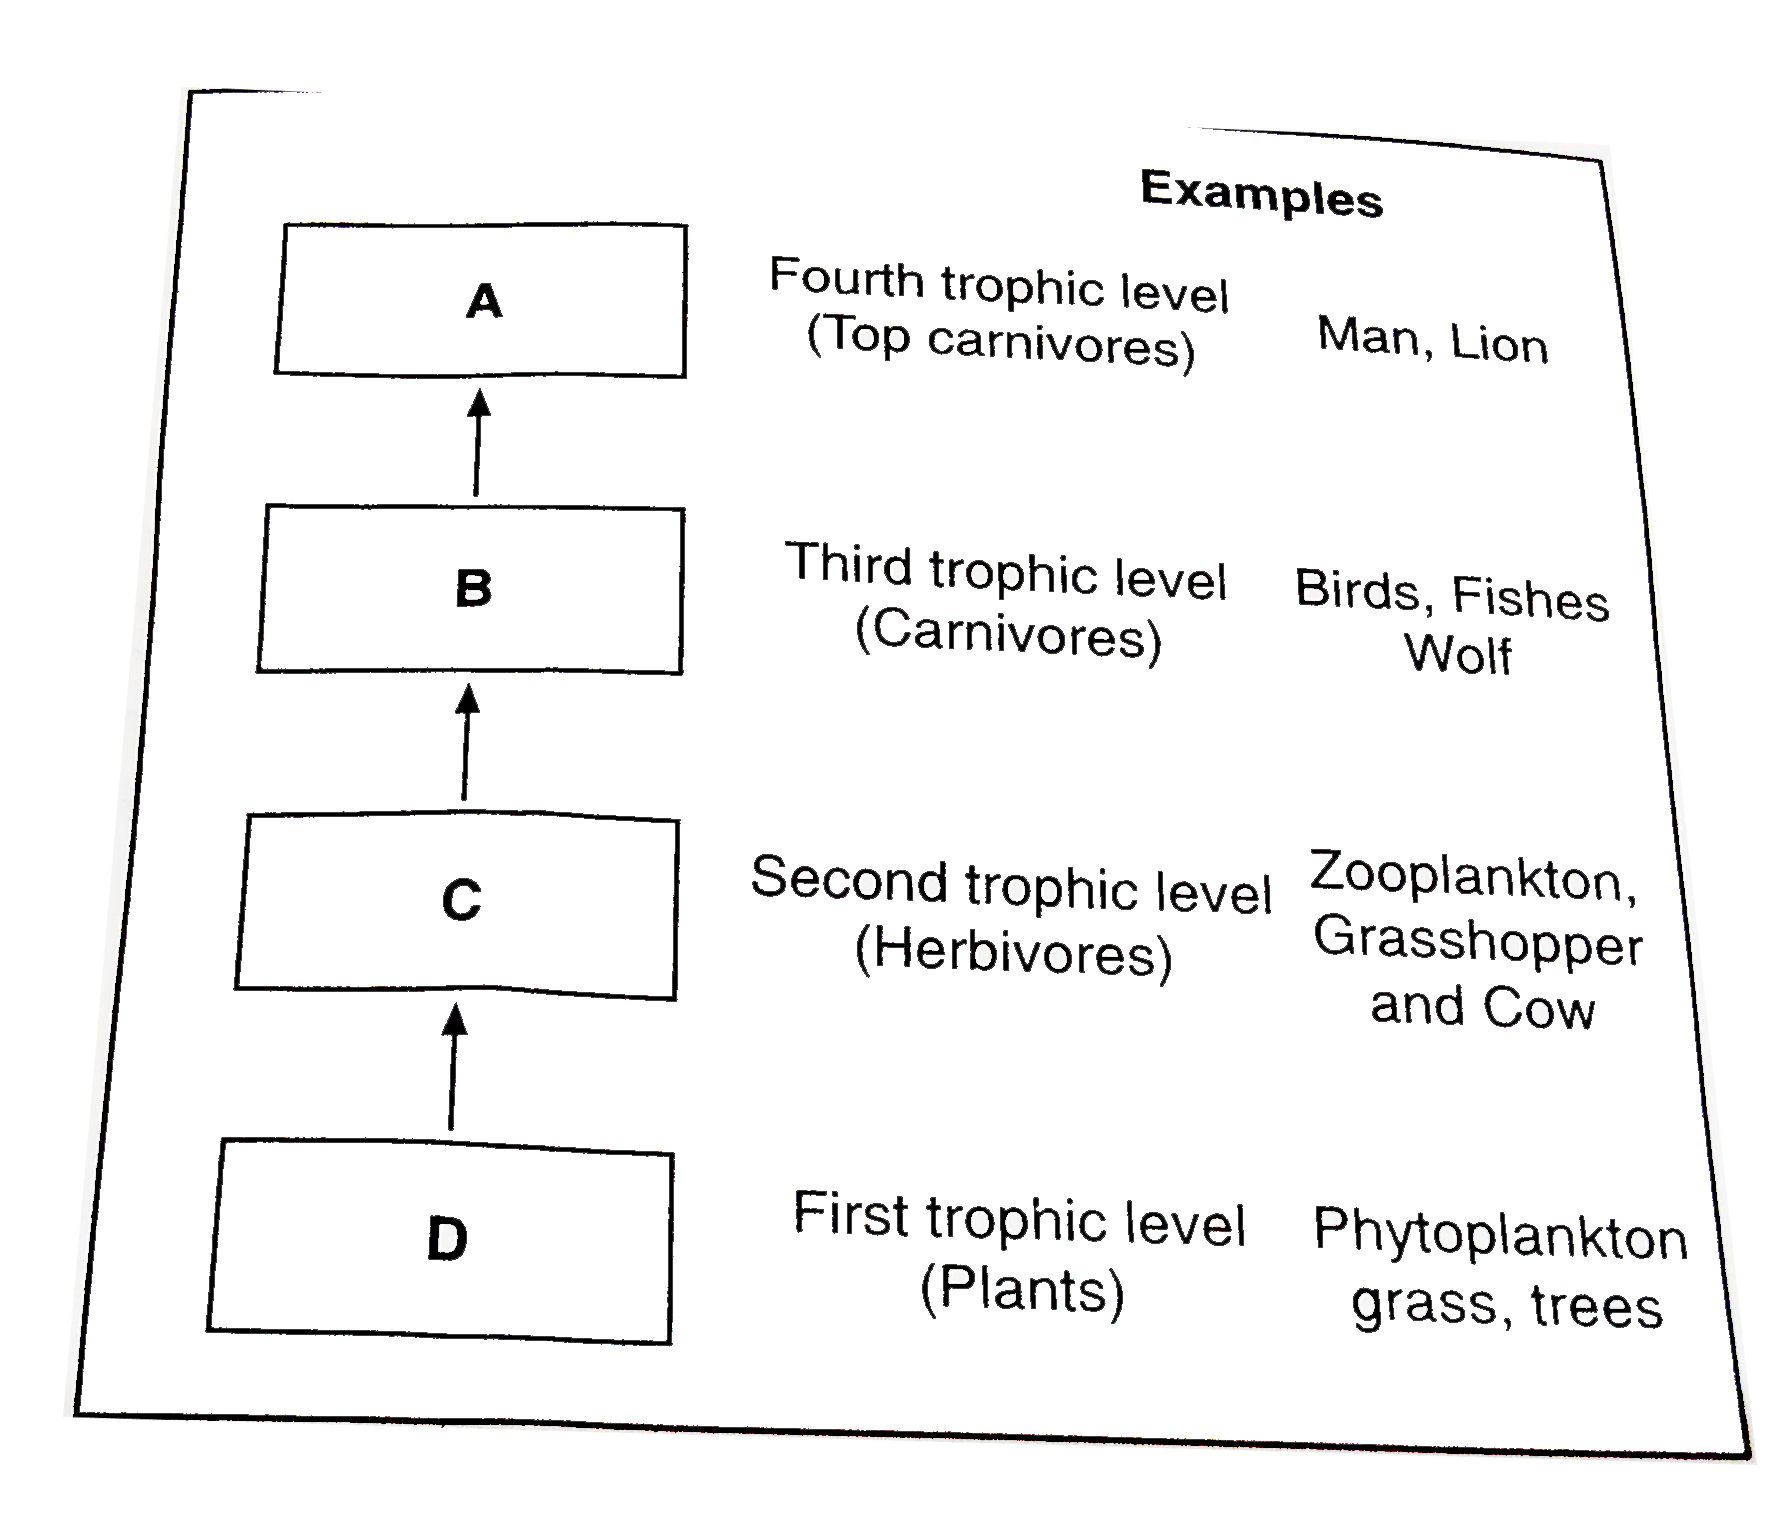 AA - Primary producer, B - Secondary consumer, C - Primary consumer, D - Tertiary consumerBA - Primary consumer, B - Primary producer, C - Secondary consumer, D - Tertiary consumerCA - Primary producer, B - Primary consumer, C - Secondary consumer, D - Tertiary consumerDA - Tertiary consumer, B - secondary consumer, C - Primary consumer, D - Primary producer
Diagrammatic representation of some vertebrate organs are given below. These organs are:
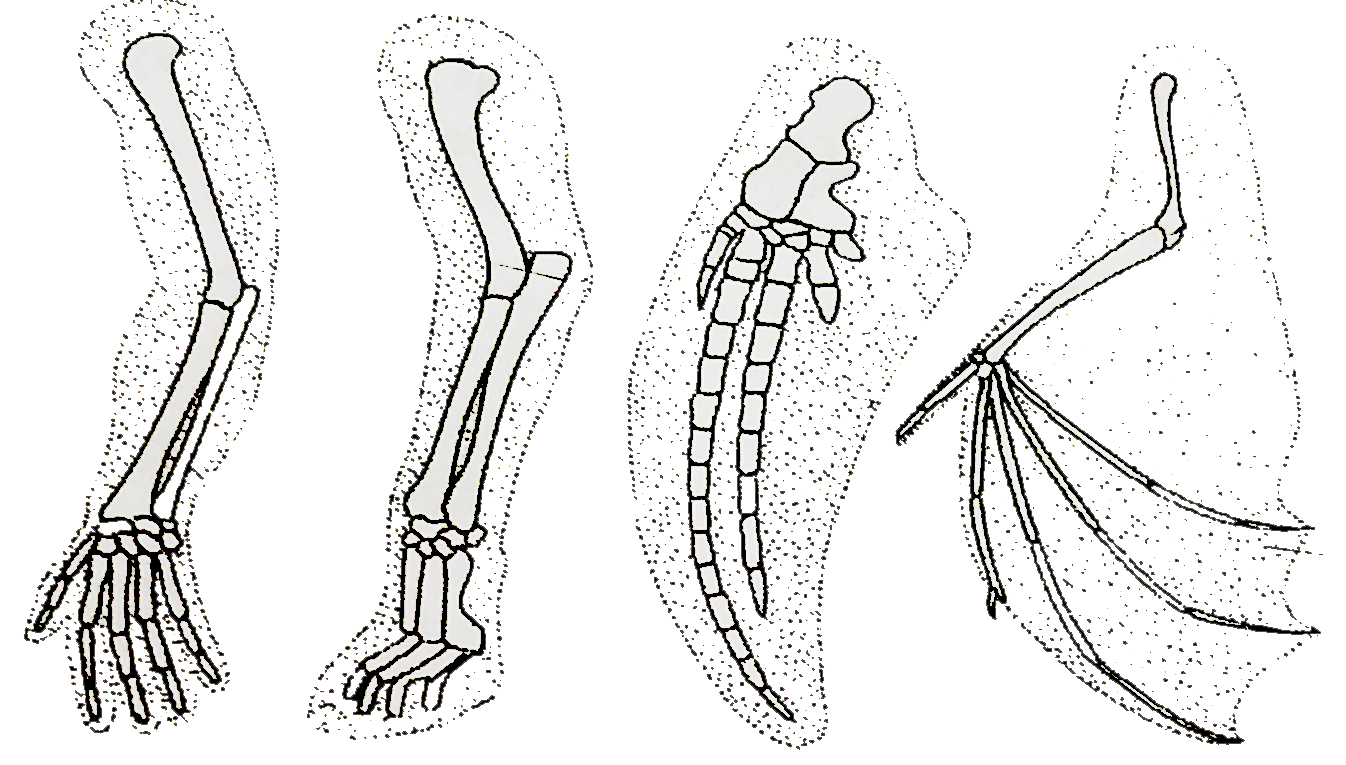 AvestigialBanalogousChomologousDnone of these
Diagrammatic presentation of ovarian events during a menstrual cycle is given below. Identify A,B C and D.
 AA-Developing follicle, B-Mature follicle, C-Developing corpus luteum, D-Regressing cotpus luteumBA-Developing corpus luteum, B-Mature follicle, C-Developing follicle, D-Regressing cotpus luteumCA-Developing follicle, B-Mature corpus luteum, C-Mature follicle, D-Regressing cotpus luteumDA-Developing follicle, B-Mature follicle, C-Developing corpus luteum, D-Regressing follicle
A diagrammatic representation of the central dogma in molecular biology is given below. Identify A, B and C by selecting the correct option :

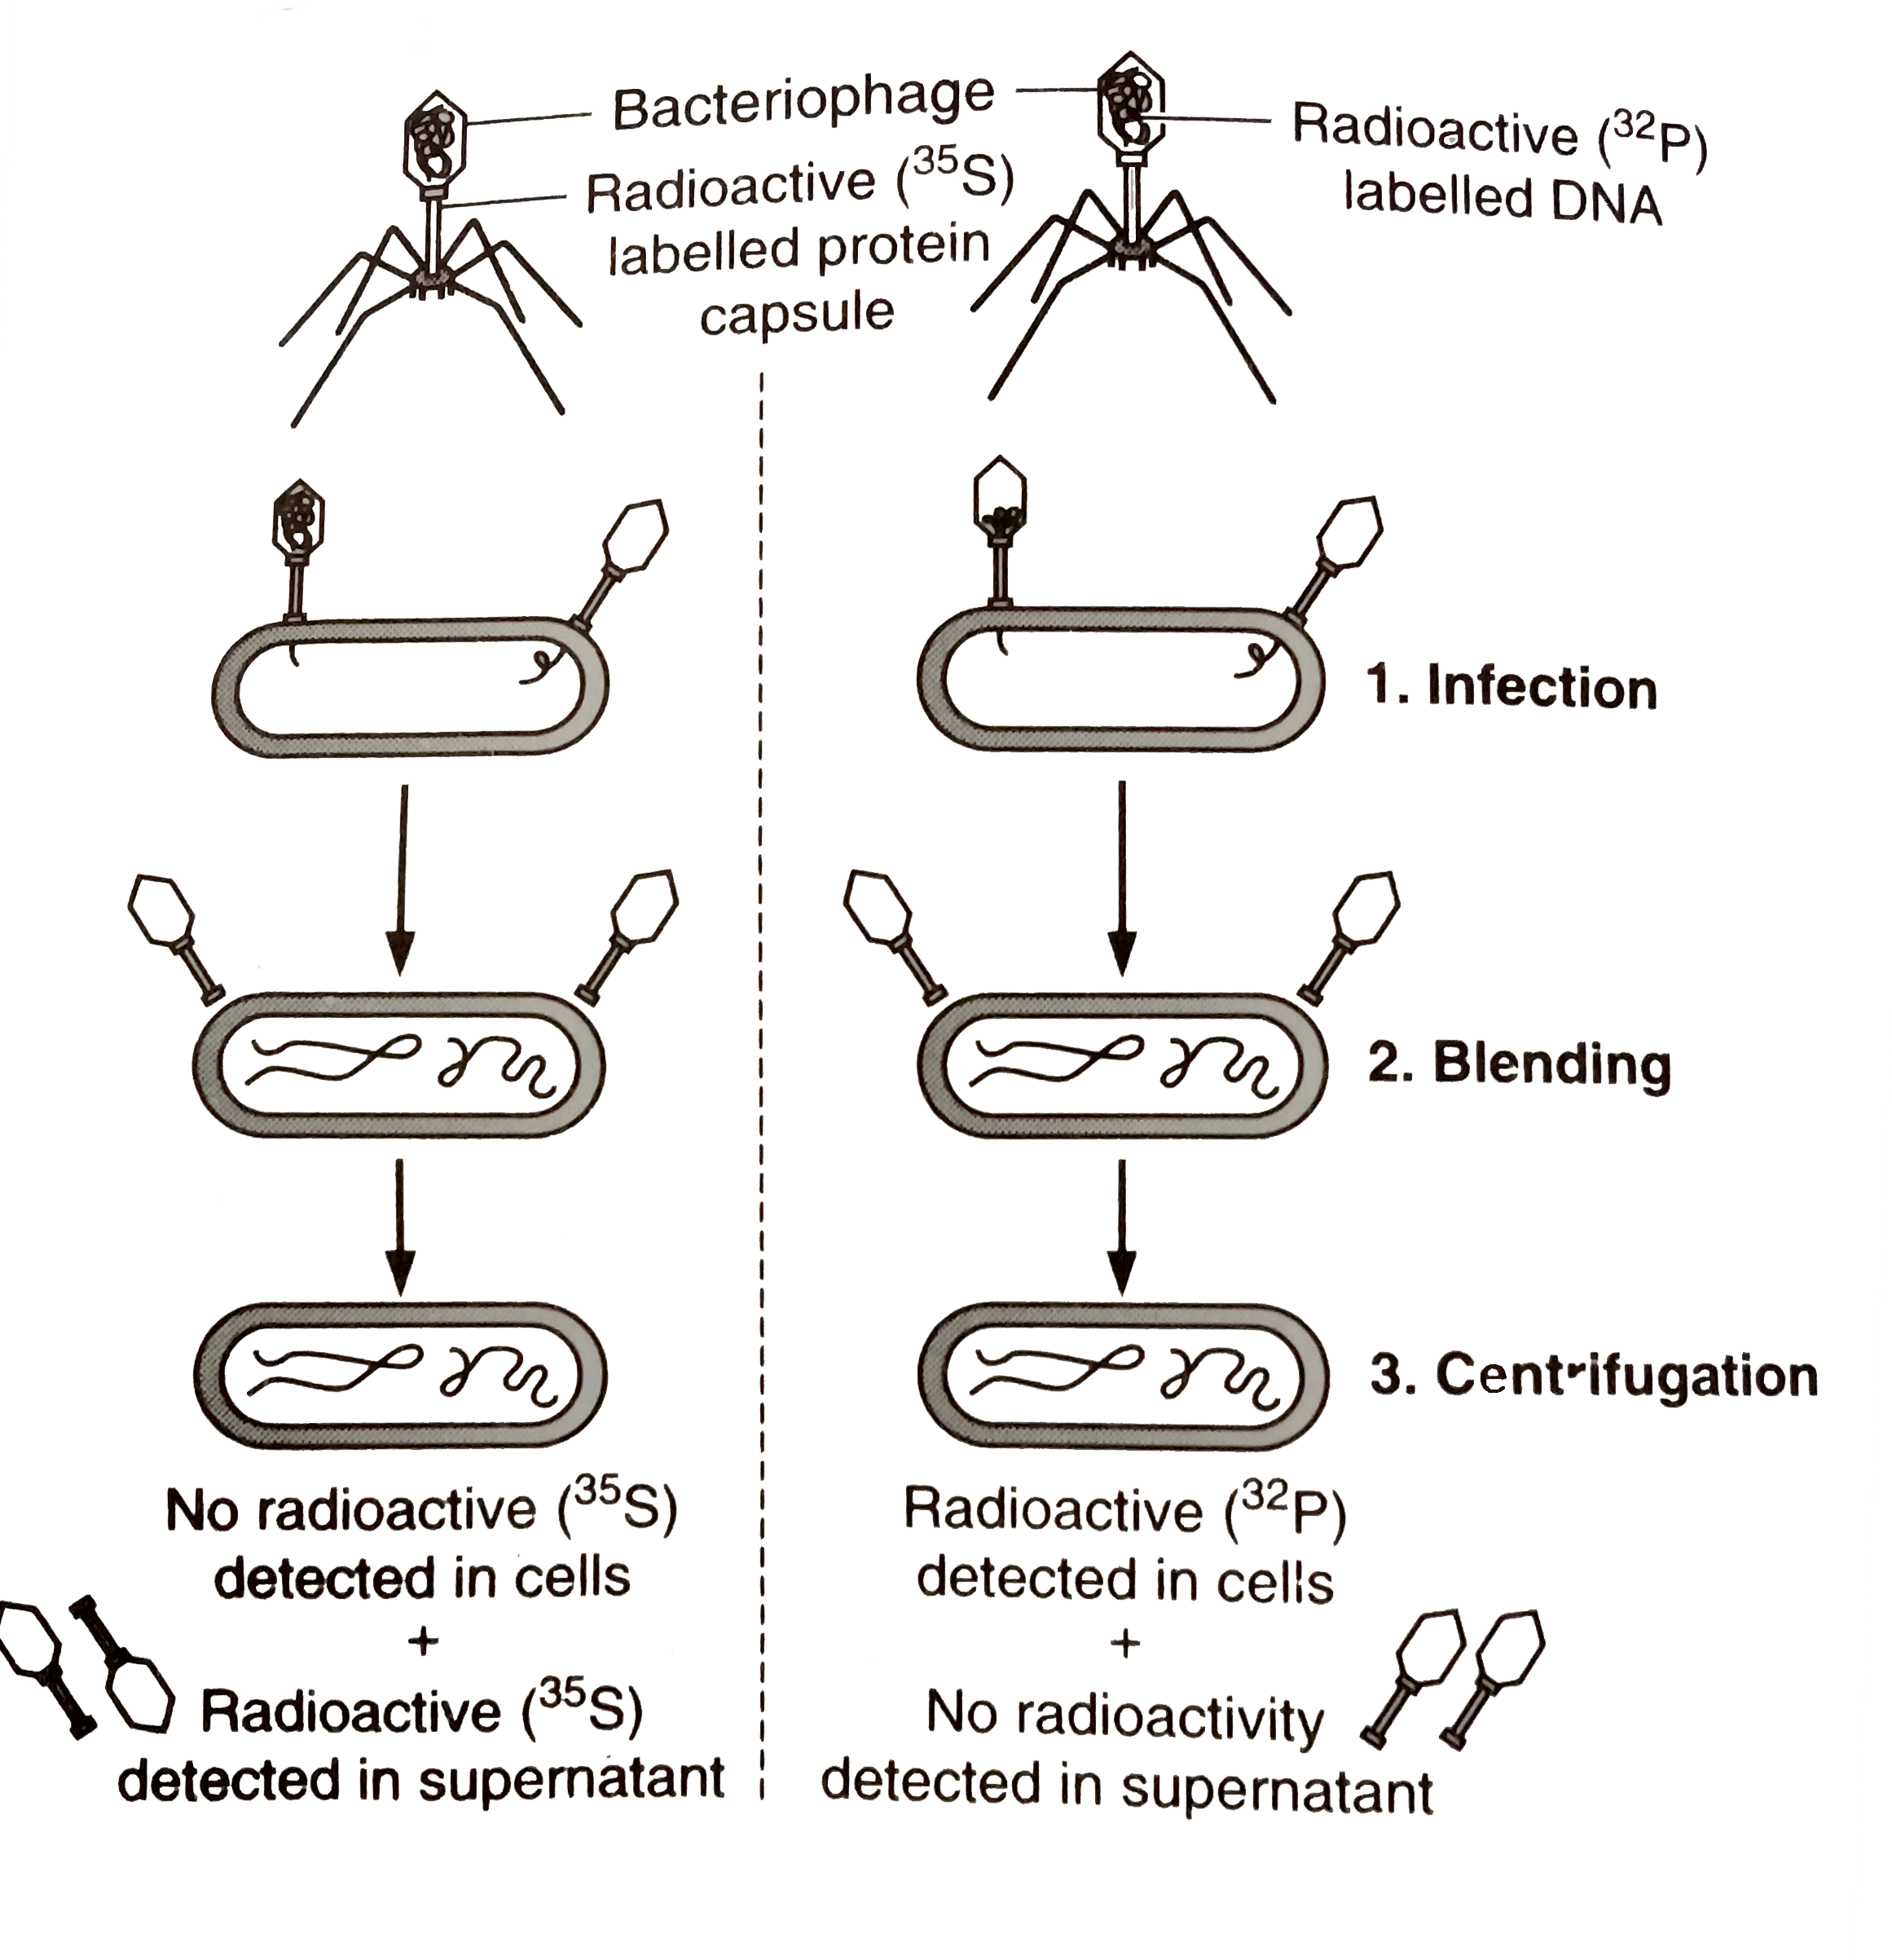
View SolutionA diagrammatic view the Hershey-Chase experiment is given below. Identify the steps A to C and select the correct option :
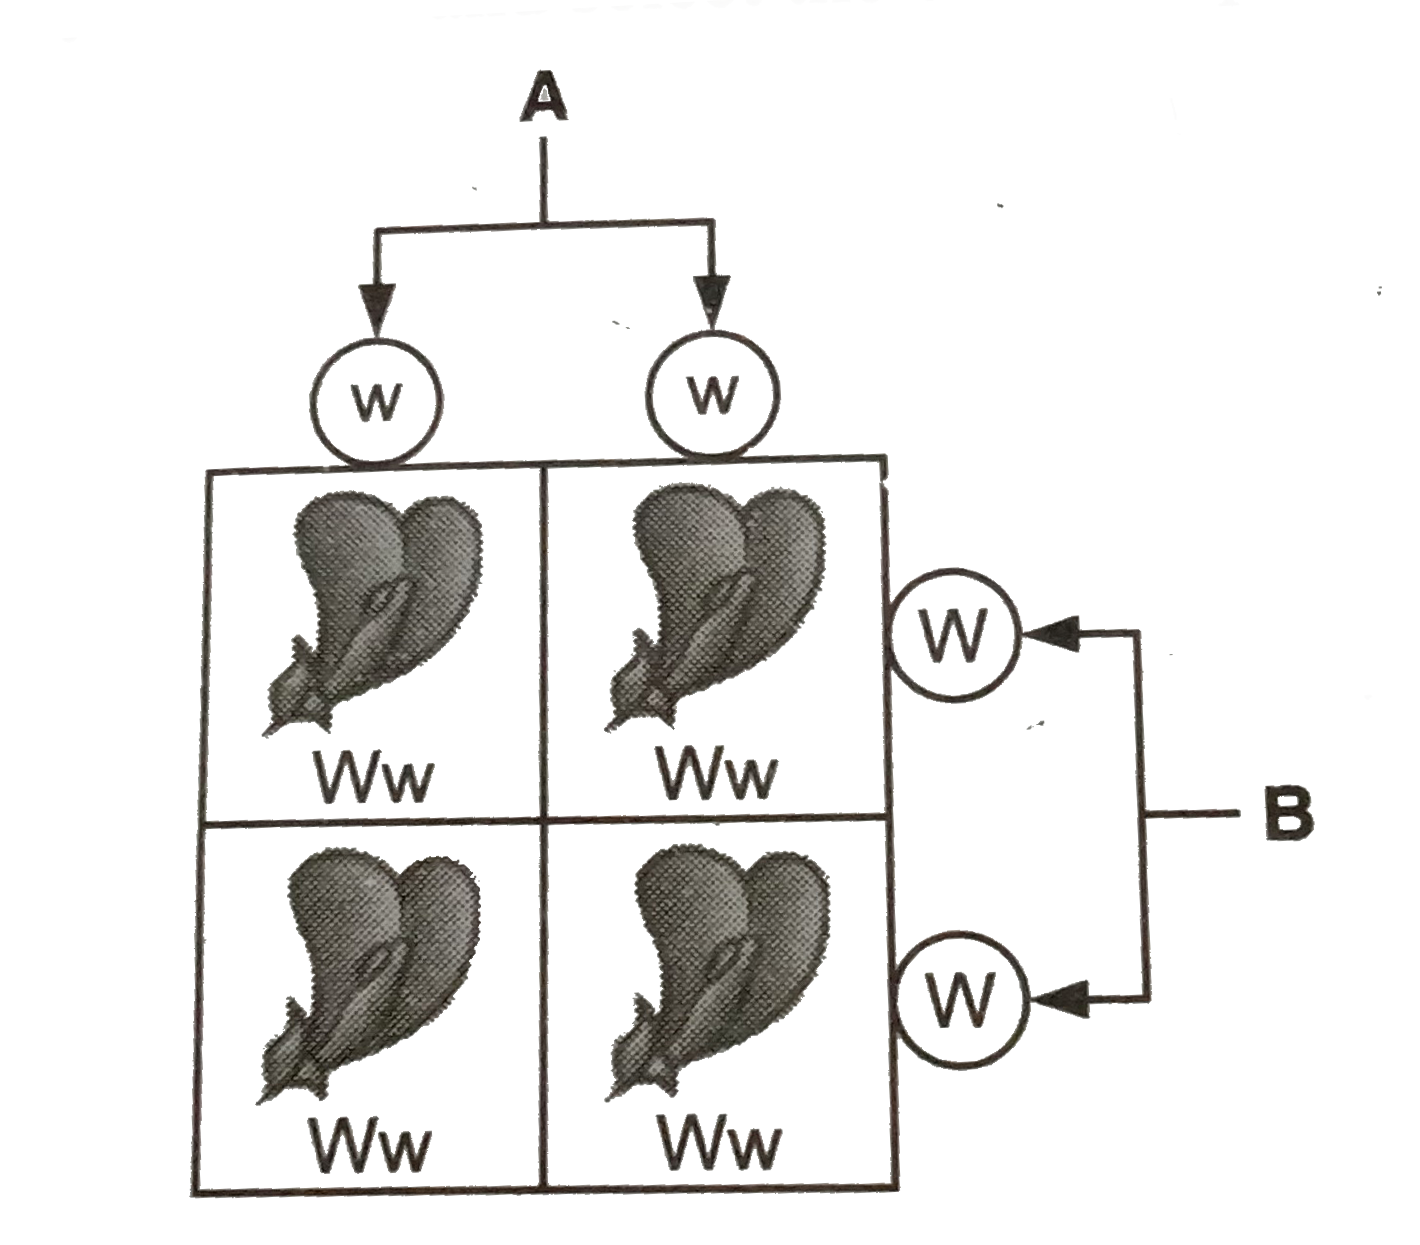
View SolutionDaigrammatic representation of a test cross is given below.Identify A and B and select the correct option:
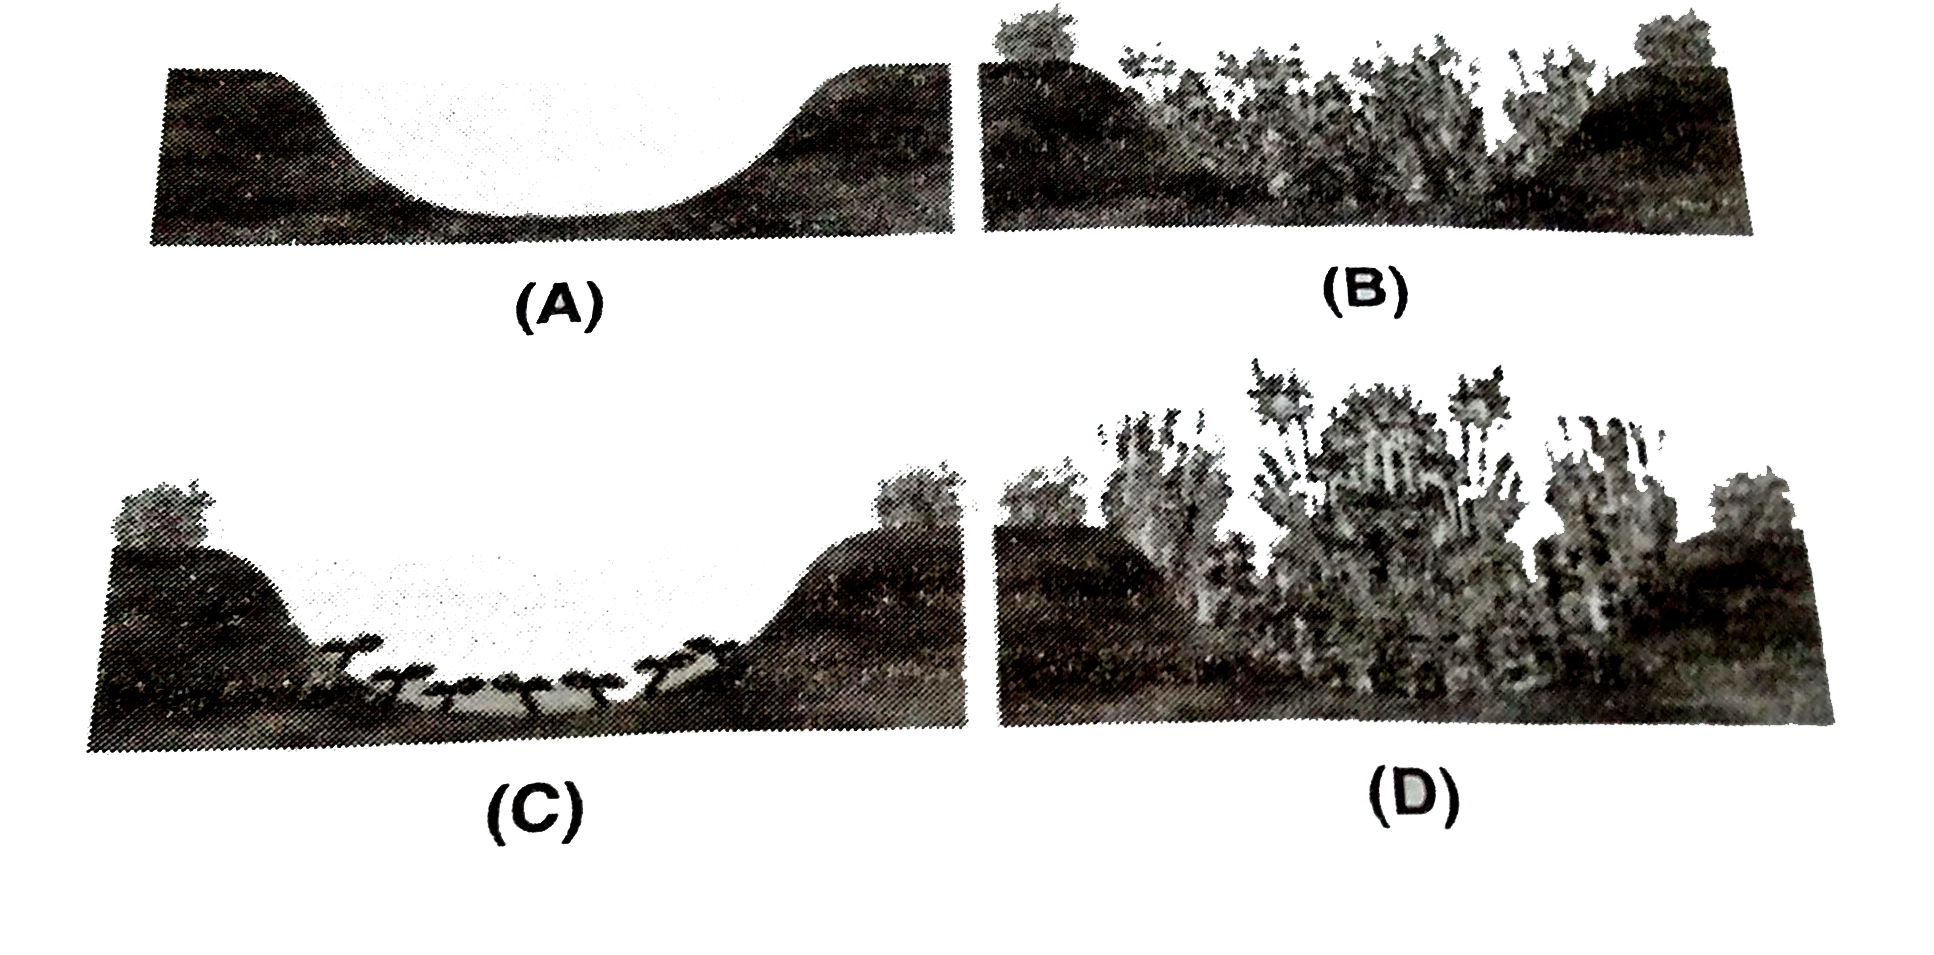
View SolutionDiagrammatic representation first four stages of primary succession is given below. Correctly identify A, B, C and D:
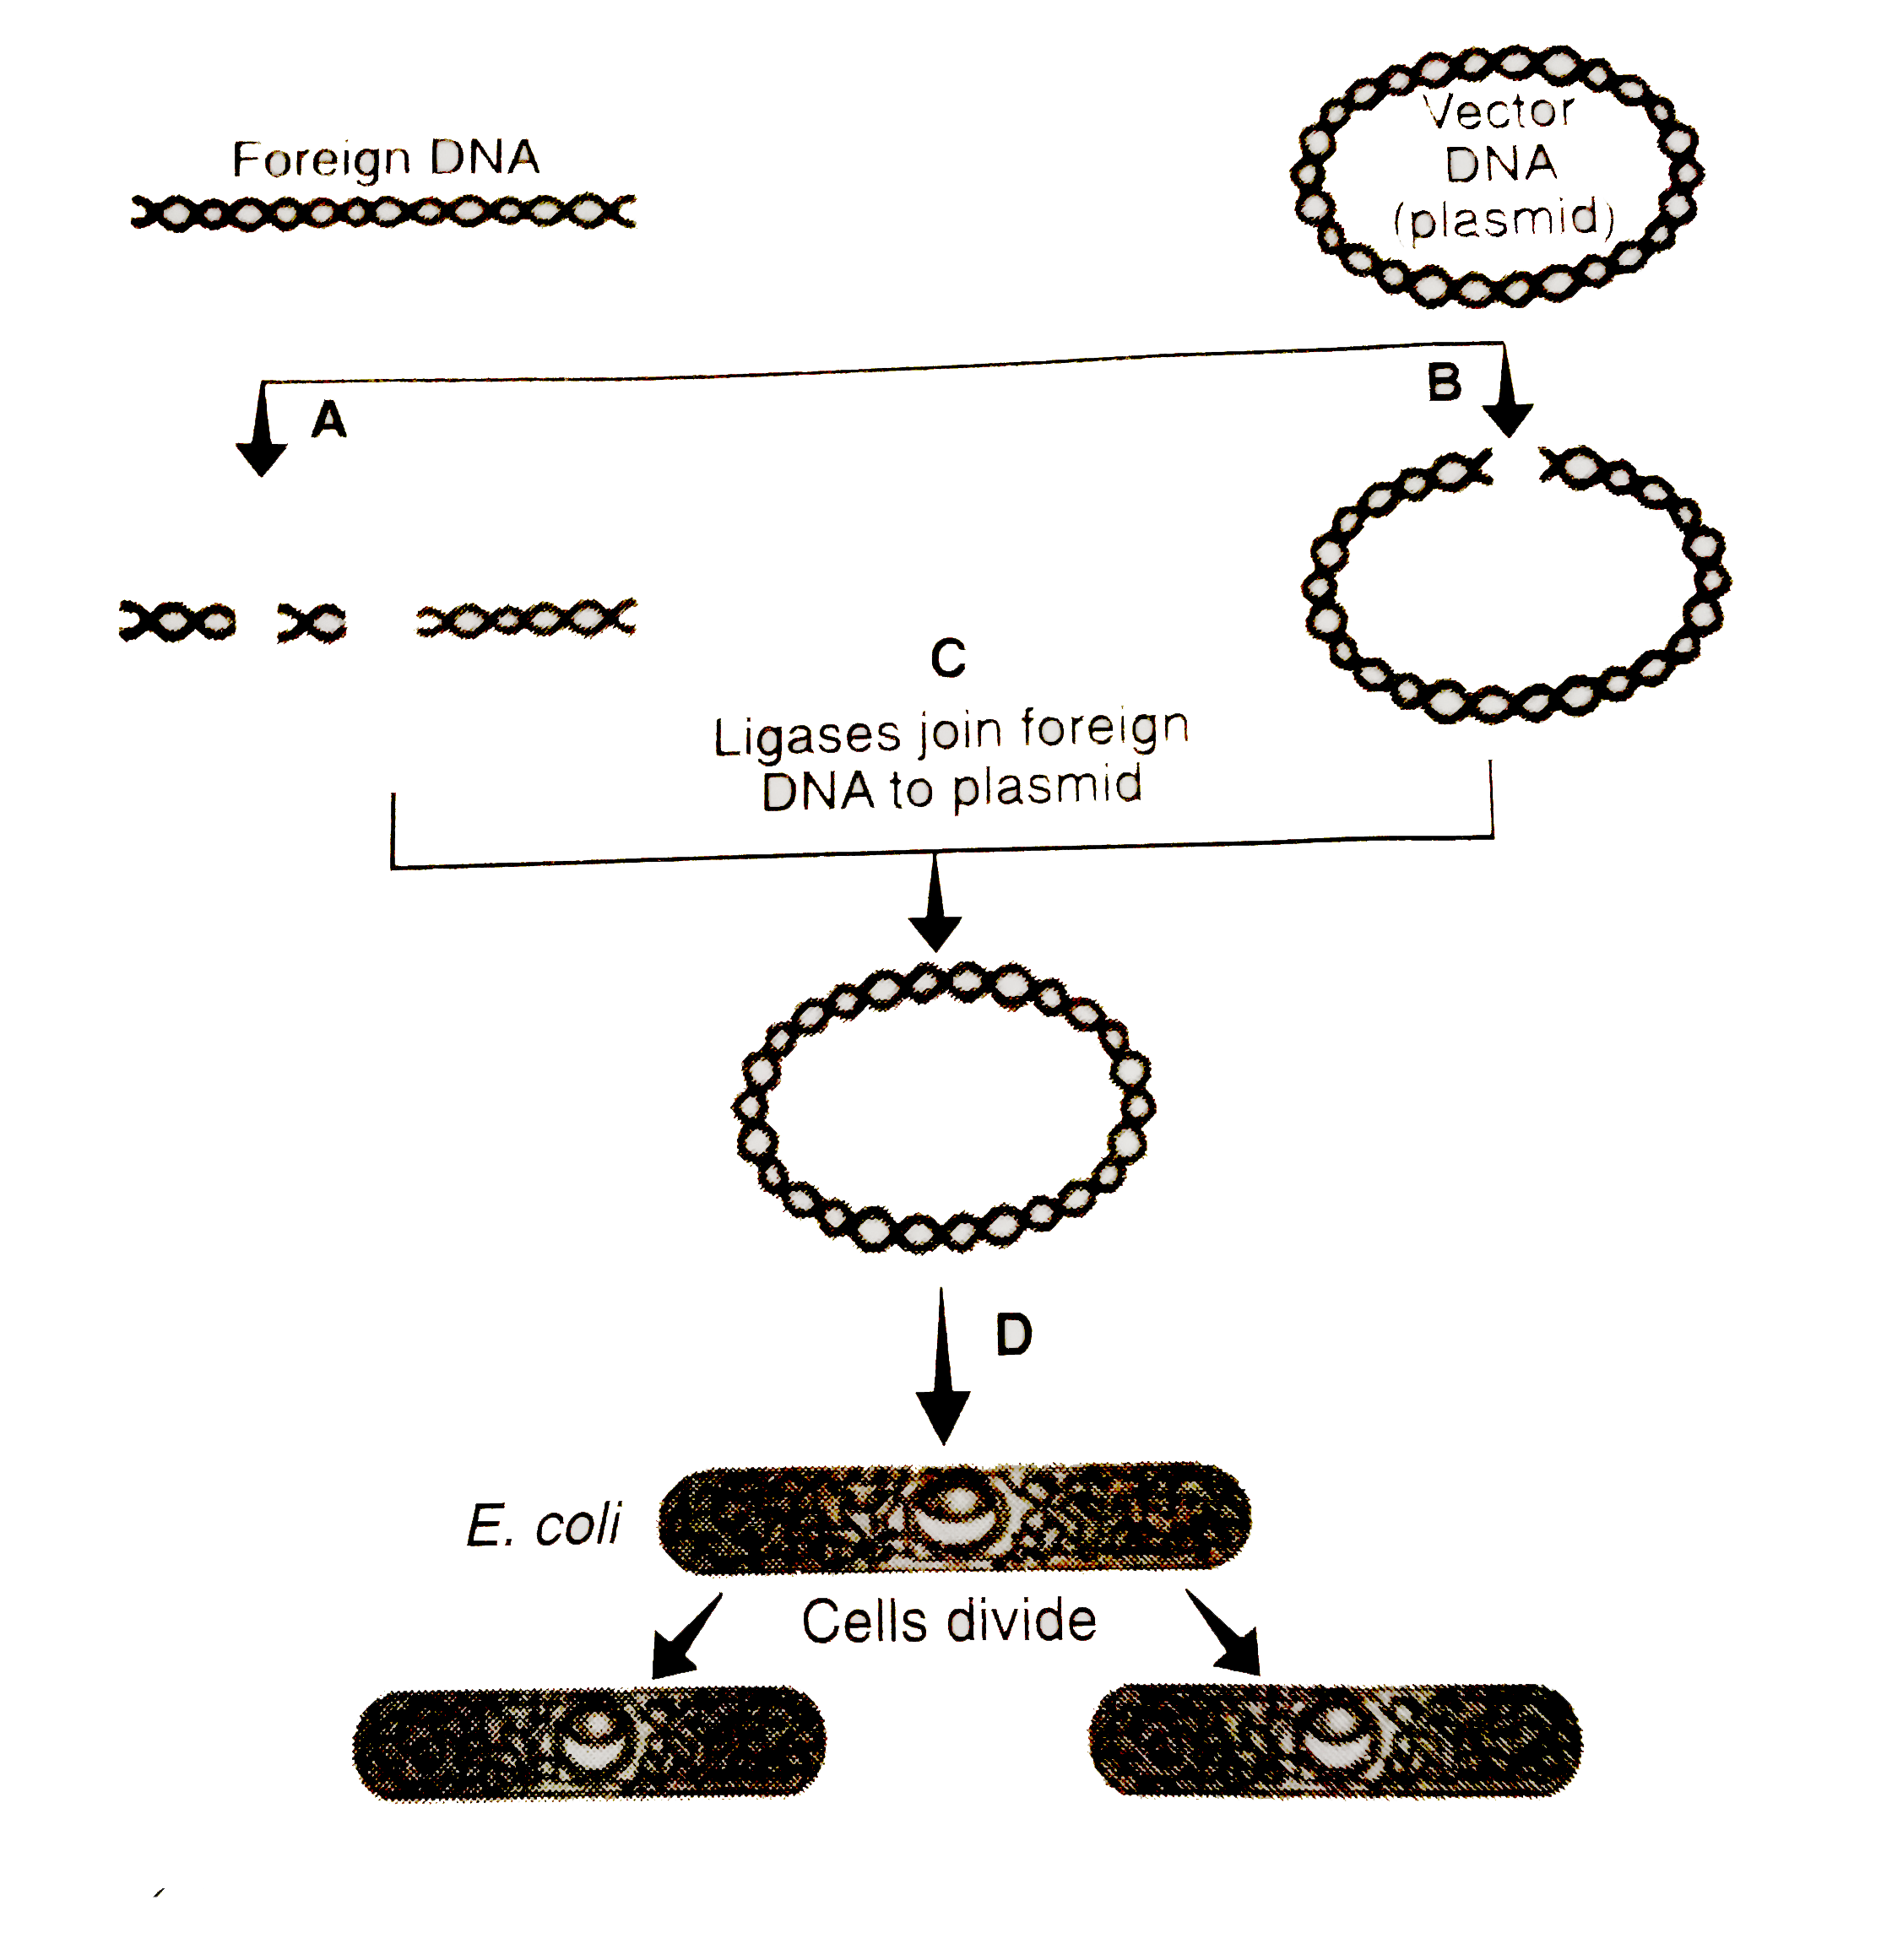
View SolutionDiagrammatic representation of recombinant DNA technology is given below. Select the correct option:
View Solution
