Draw graph for following equations :
v=v0−at
v=4t−3
x=4at2
v=−gt
The correct Answer is:A, B, C
Step by step video, text & image solution for Draw graph for following equations : by Physics experts to help you in doubts & scoring excellent marks in Class 12 exams.
Updated on:21/07/2023Topper's Solved these Questions
- UNIT & DIMENSIONSBOOK - MOTIONCHAPTER - UNIT & DIMENSIONSEXERCISE - Exercise - 2 (Level - I) (Section A- Units)
4 Videos
- UNIT & DIMENSIONSBOOK - MOTIONCHAPTER - UNIT & DIMENSIONSEXERCISE - Exercise - 2 (Level - I) (Section B- Dimensions)
5 Videos
- UNIT & DIMENSIONSBOOK - MOTIONCHAPTER - UNIT & DIMENSIONSEXERCISE - Exercise - 1(Section C- Use of Dimensions)
8 Videos
- ThermodynamicsBOOK - MOTIONCHAPTER - ThermodynamicsEXERCISE - EXERCISE - 3 SECTION b
26 Videos
- UNITS AND DIMENSIONS, BASIC MATHEMATICS BOOK - MOTIONCHAPTER - UNITS AND DIMENSIONS, BASIC MATHEMATICS EXERCISE - PRACTICE QUESTION
4 Videos
Similar Questions
Draw the graphs of the following equations on the same graph paper :
3x - 2y = 9, 4y - 6x + 12 = 0
Find the area of trapezium formed by these two lines and the axes.
View SolutionDraw the graph of the following equations on the same graph sheet.
x=4,x=2,y=1,y-3=0
Also, find the area enclosed between these lines.
View Solution
Knowledge Check
Draw graph for following equation :
v=v0−atA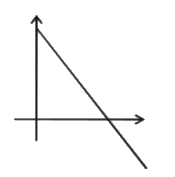 B
B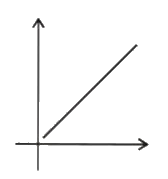 C
C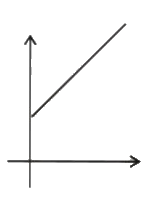 D
D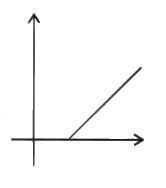
Use a single graph paper and draw the graph of the following equations: 2y−x=8; 5y−x=14, y−2x=1 . Obtain the vertices of the triangle so obtained.
View SolutionDraw the graphs of the following equations on the same graph paper: 2x+3y=12, x−y=1 . Find the coordinates of the vertices of the triangle formed by the two straight lines and the y-axis.
View SolutionDraw the graphs of the following equations: 2x−y−2=0 , 4x+3y−24=0 and y+4=0 Obtain the vertices of the triangle so obtained. Also, determine its area.
View SolutionDraw the graphs of the following equations on the same graph paper: 2x+y=2; 2x+y=6 . Find the coordinates of the vertices of the trapezium formed by these lines. Also, find the area of the trapezium so formed.
View SolutionConsider the following function f whose graph is given below.
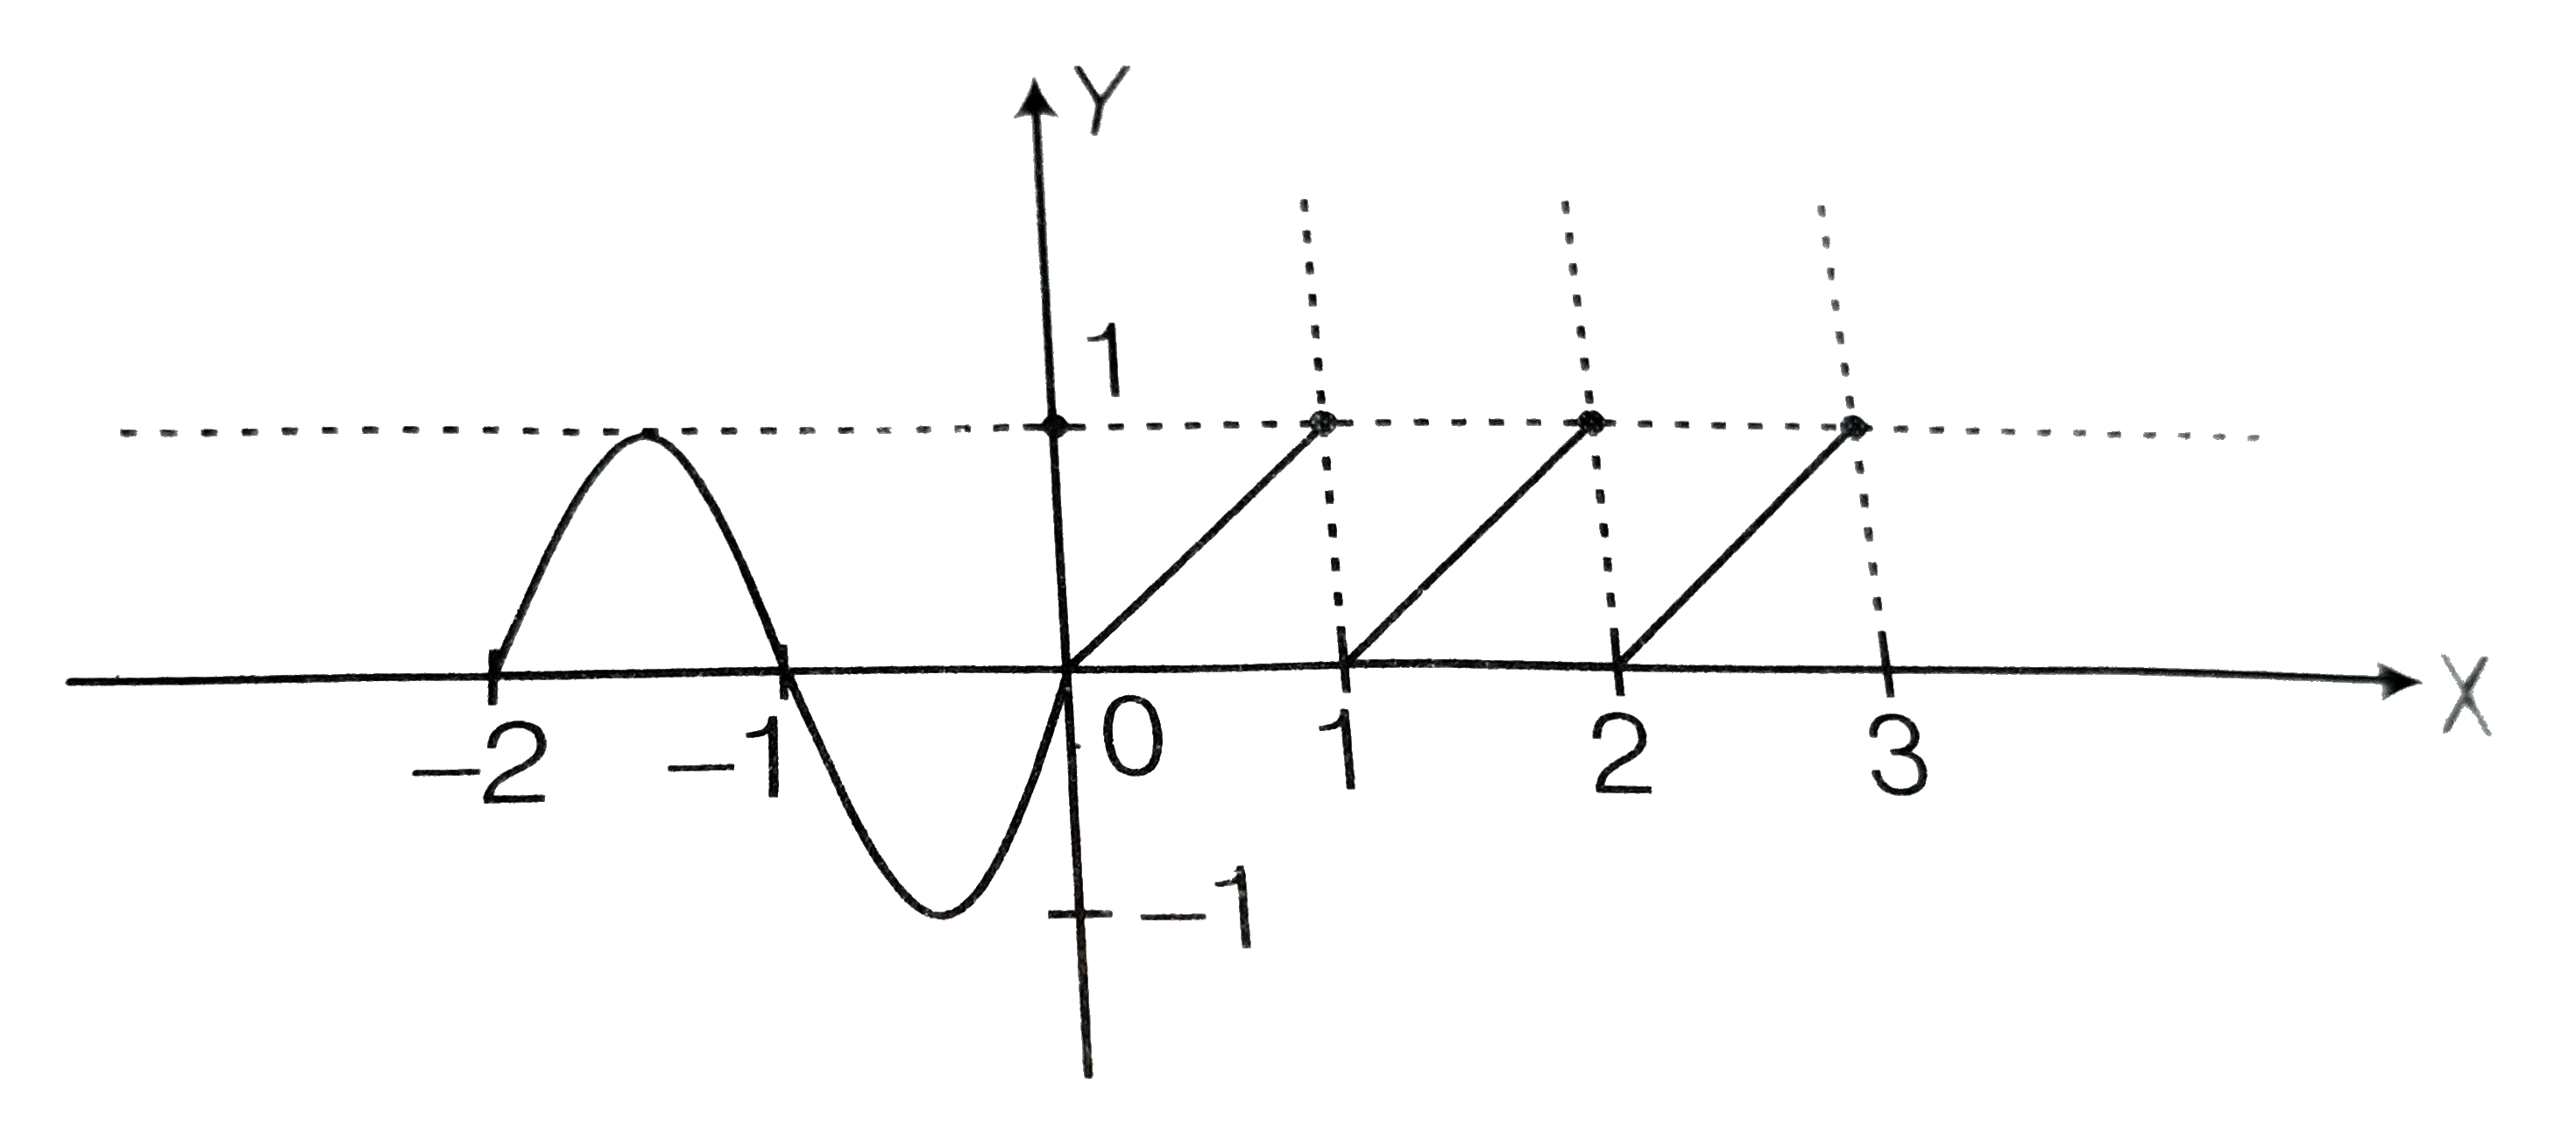
Draw the graph of following functions.
(a) f(x)+1
View SolutionConsider the following function f whose graph is given below.
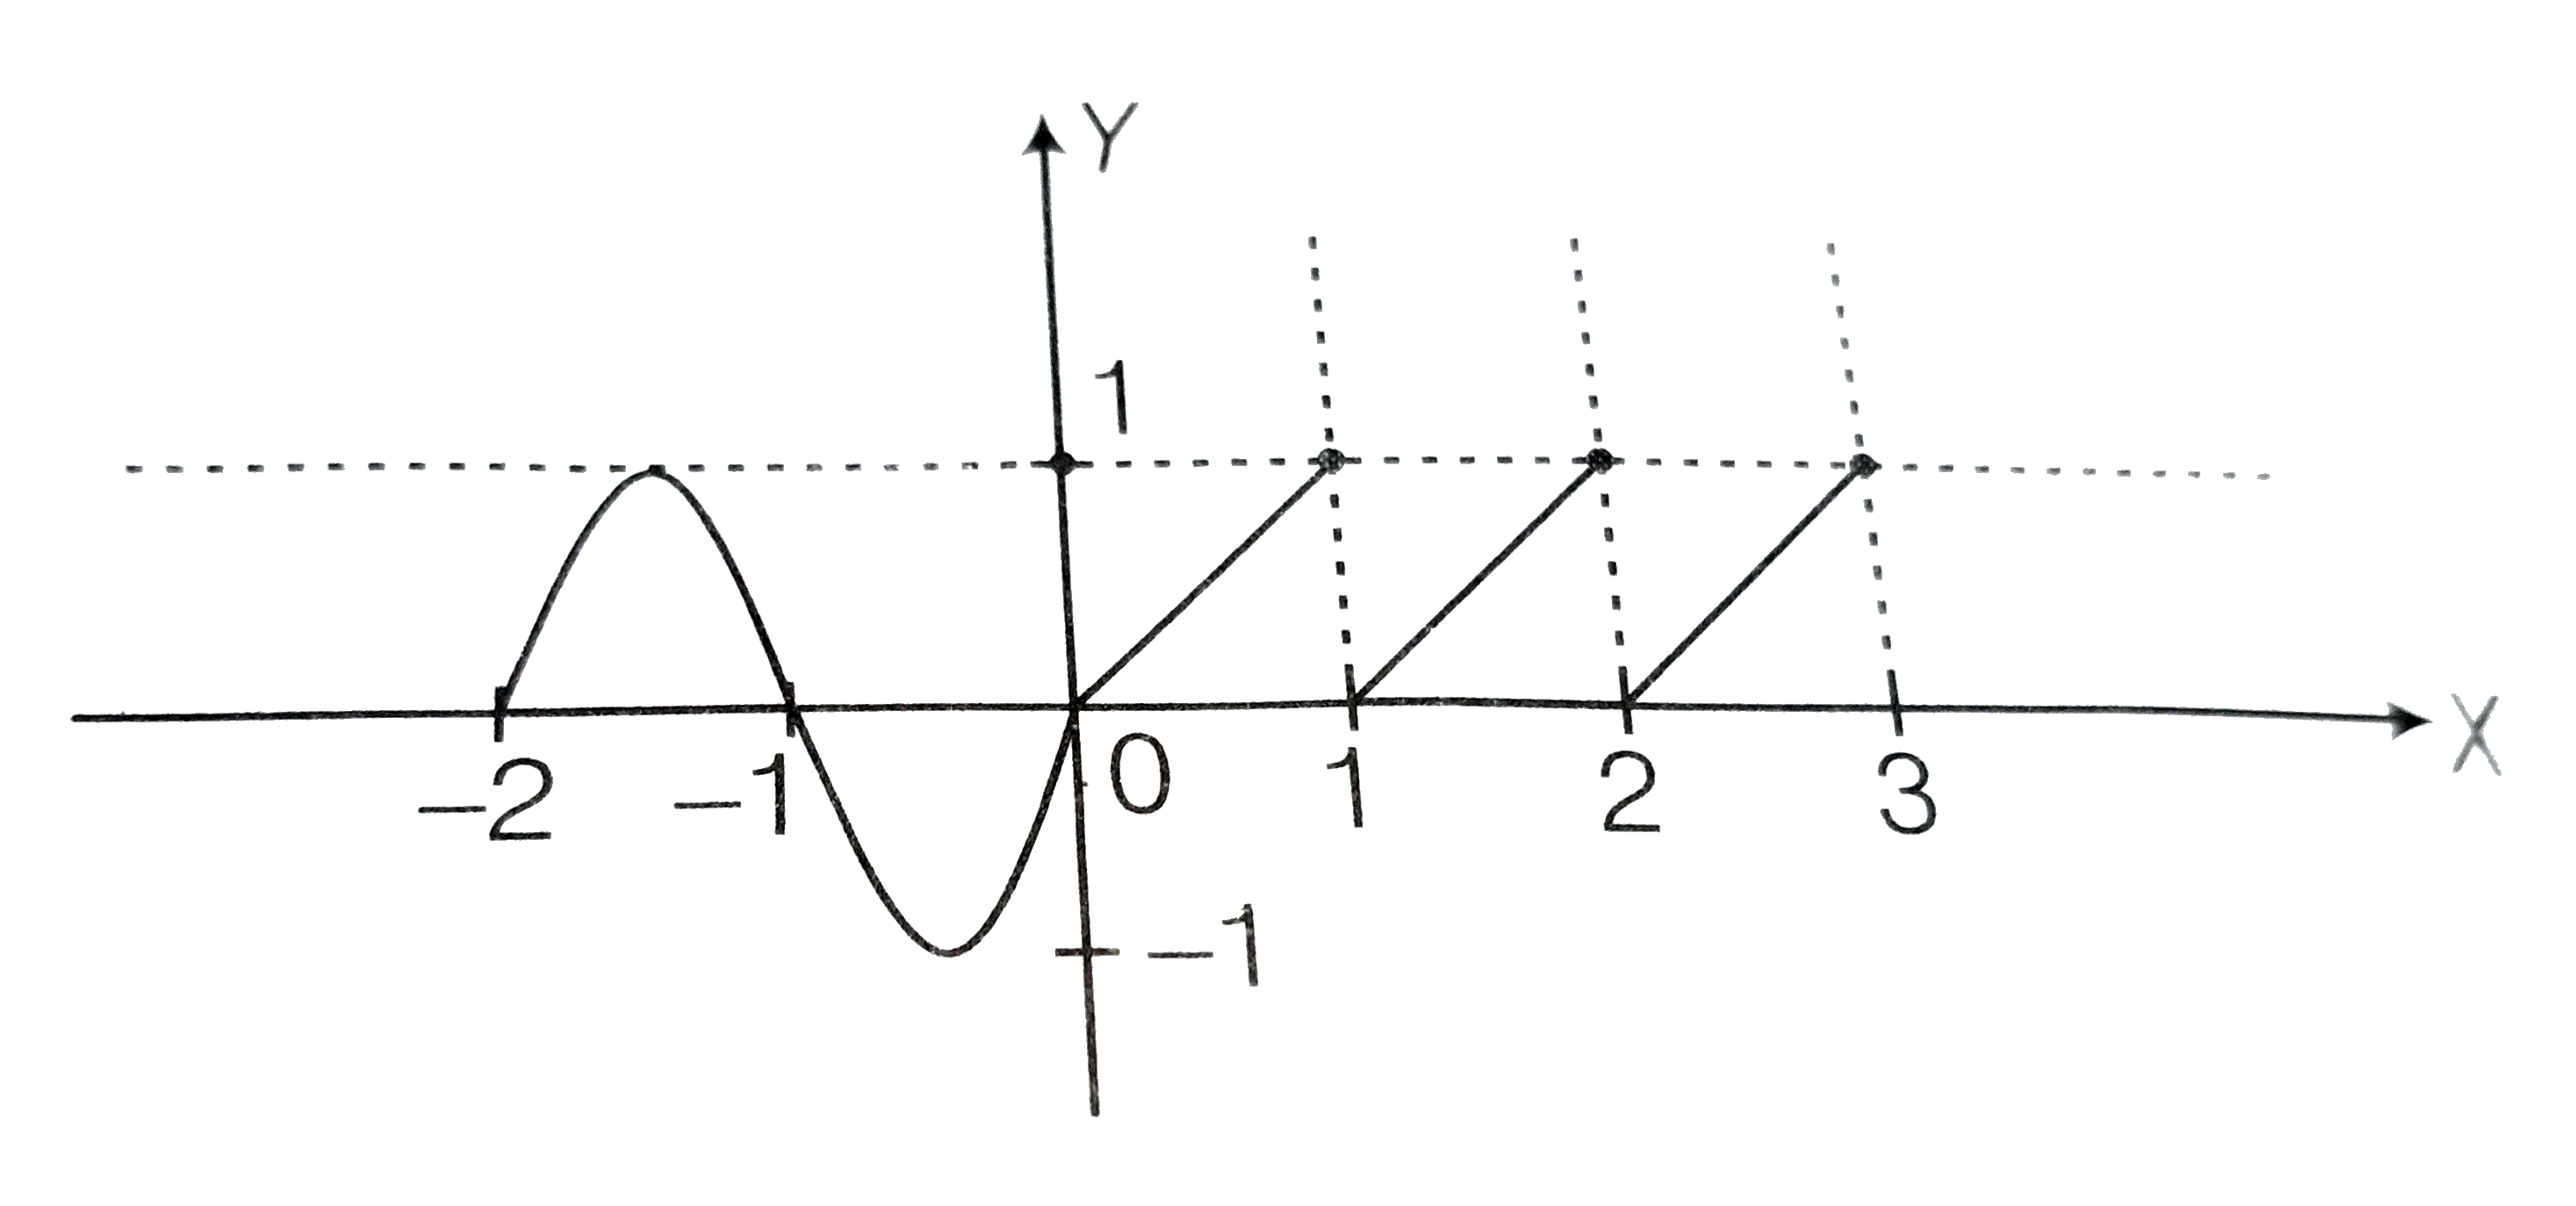
Draw the graph of following functions.
(b) f(x)−1
View SolutionConsider the following function f whose graph is given below.
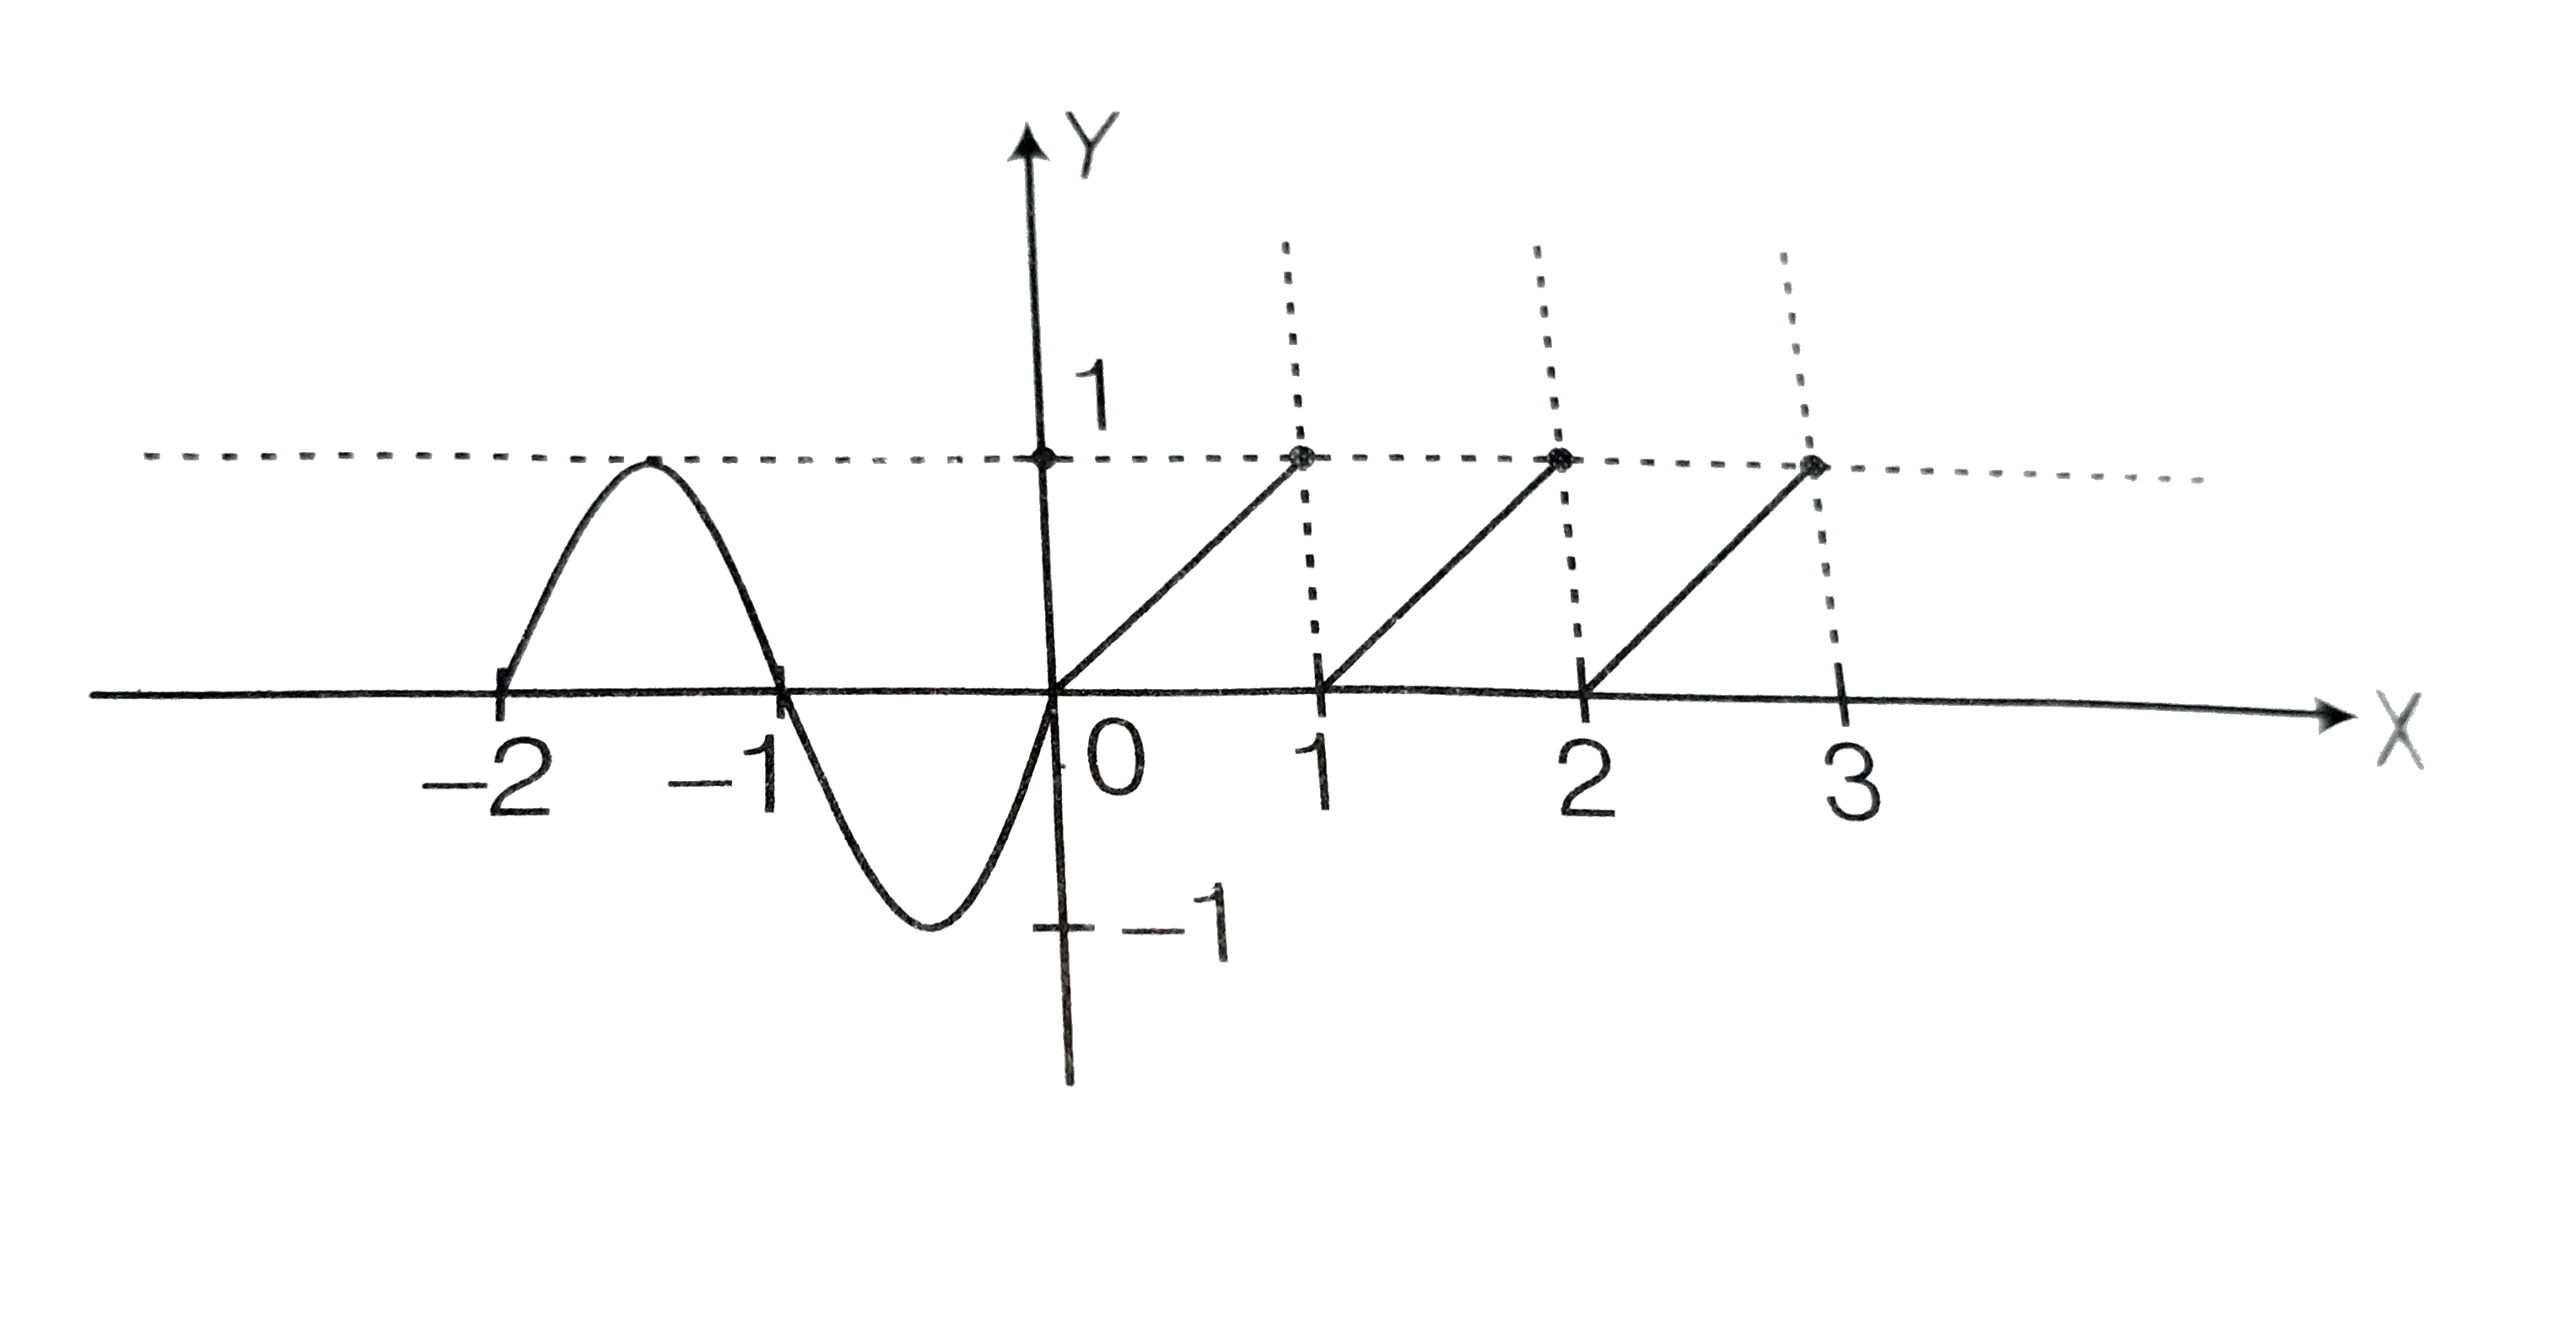
Draw the graph of following functions.
(c) −f(x)
View Solution
