The table below gives the frequency with which various scores were obtained on a 20-question written section of a drivers education test .

The mode of the data is
3
6
18
19
The correct Answer is:D
Step by step video, text & image solution for The table below gives the frequency with which various scores were obtained on a 20-question written section of a drivers education test . The mode of the data is by Maths experts to help you in doubts & scoring excellent marks in Class 12 exams.
Updated on:21/07/2023Similar Questions
Find the mode of the following frequency table, which gives the marks scored by 40 students in a test:

View SolutionThe table below gives the percentage distribution of female teachers in the primary schools of rural areas of various states and union territories (U.T.) of India. Find the mean percentage of female teachers by all the three methods discussed in this section.
View Solution
Knowledge Check
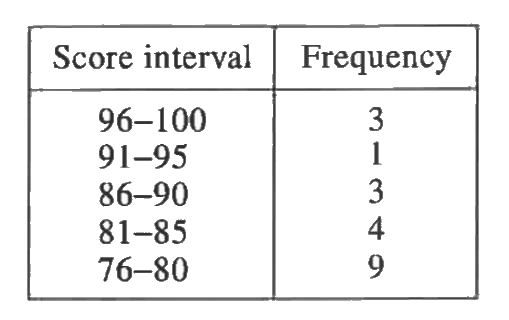
For 20 quiz scores in a typing class, the table below gives the frequency of the scores in each score interval. Which score interval contains the median of the scores?
 A96-100B91-95C86-90D81-85
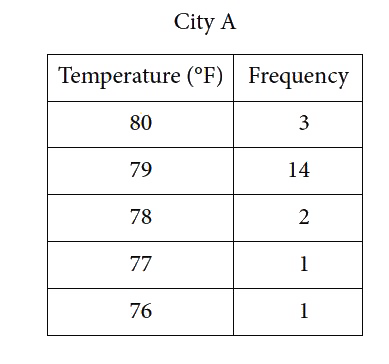
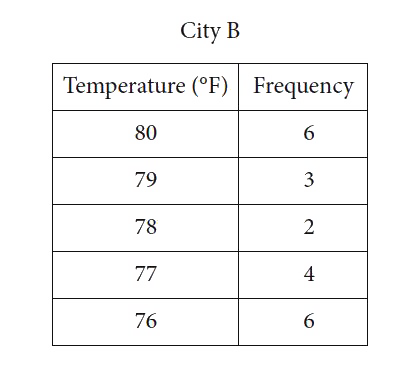
The tables below give the distribution of high temperatures in degrees Fahrenheit (°F) for City A and City B over the same 21 days in March


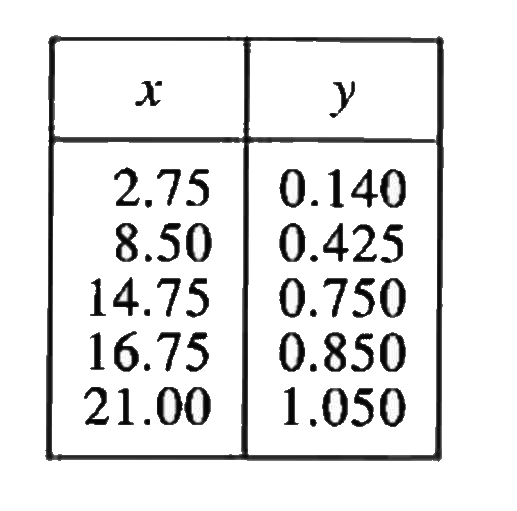
Which of the following is true about the data shown for these 21 days?AThe standard deviation of temperatures in City A is larger.BThe standard deviation of temperatures in City B is larger.CThe standard deviation of temperatures in City A is the same as that of City B.DThe standard deviation of temperatures in these cities cannot be calculated with the data provided.The table below gives experimental data value for variables x and y. Theory predicts that y varies directly with x. Based on the experimental data, which of the following value is closest to the constant of variation?
(Note : The variable y varies directly with the variable x provided that y=kx for some nonzero constant k. called the constant of variation.)
 A−2.61B0.05C3.61D15.9
The following frequency distribution gives the monthly consumption of electricity of 68 consumers of a locality. Find the median, mean and mode of the data and compare them. Monthly consump- 65-85 85-105 105-125 125-145 145-165 165-185 185-205 No. of consumers: 4 5 13 20 14 8 4
View SolutionThe table below gives the results of three titrations carried out with 0.200 M HCl to determine the molarity of a given NaOH solution using phenolphthalein as indicator. NaOH was taken in the burette and HCl was taken in a conical flask for the titrations

The actual molarity of the prepared NaOH solution was 0.220 mol dm−3. Which among the following could be the reason for the wrong value obtained in titration III?
View SolutionA student noted the number of cars passing through a spot on a road for 100 periods each of 3 minutes and summarised it in the table given below. Find the mode of the data: Number of cars: 0-10 10-20 20-30 30-40 40-50 50-60 60-70 70-80 Frequency: 7 14 13 12 20 11 15 8
View SolutionThe table below gives the population ( in thousands) of ten species (A-J) in four areas (a-d) consisting of the number of habitats given within brackets against each. Study the table and answer the questions which follow.

Which area out of a-d shows maximum species diversity ?
View SolutionTable below shows the frequency f with which x alpha particles were radiated from a diskette x: 0 1 2 3 4 5 6 7 8 9 10 11 12 f: 51 203 383 525 532 408 273 139 43 27 10 4 2. Calculate the mean and variance
View Solution
