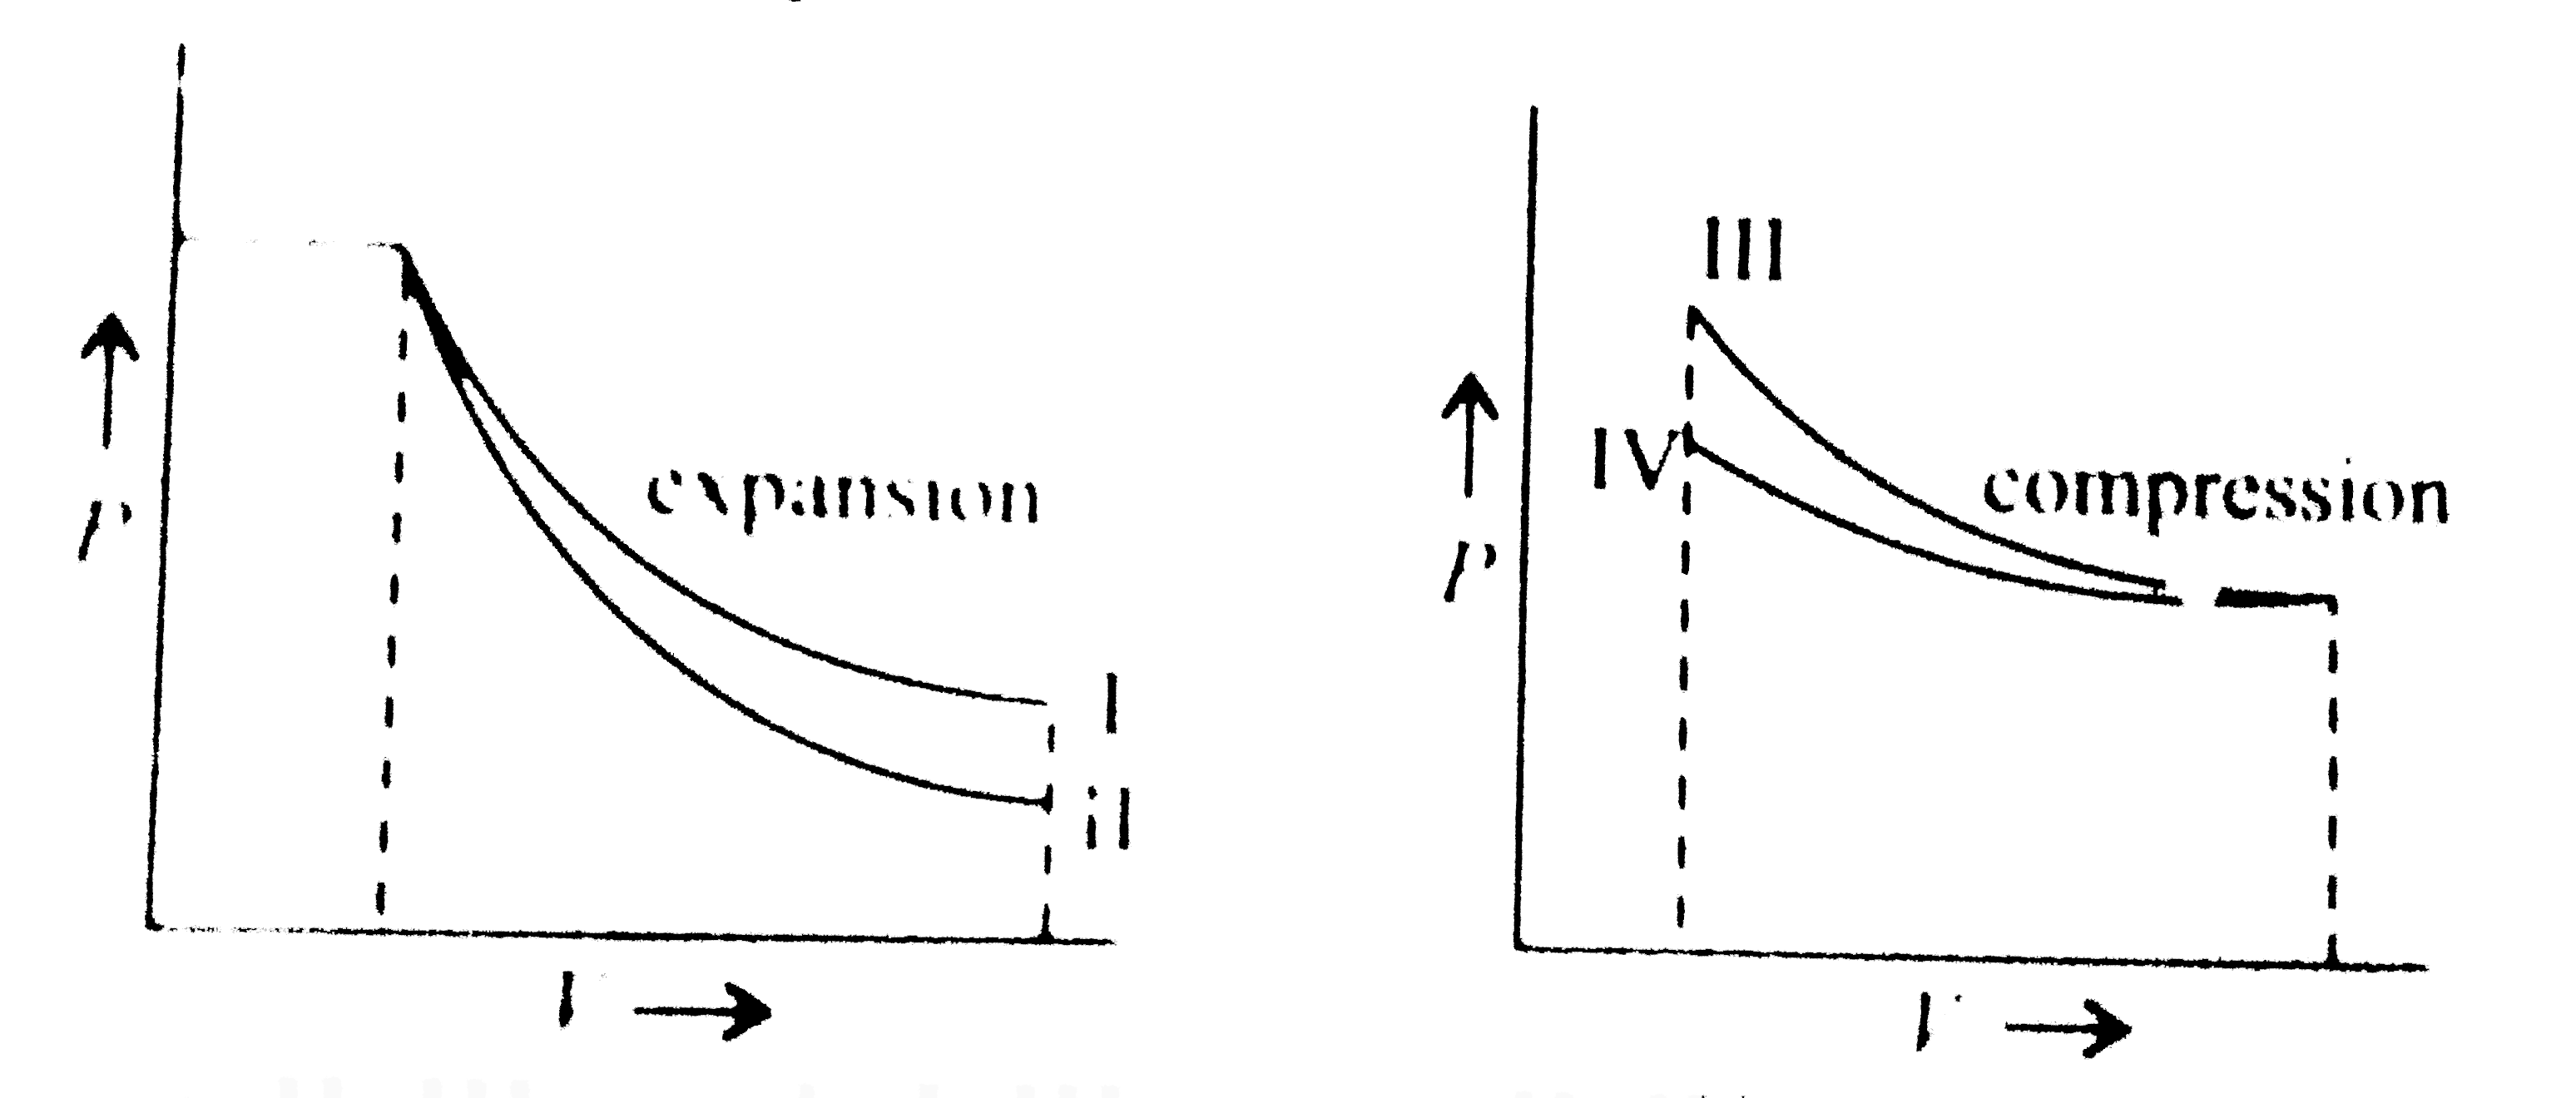
Which of the following graphs given below show (s) adiabatic process?

A
II, III
B
I, III
C
II, IV
D
I, IV
Video Solution
Text Solution
The correct Answer is:A
Adiabatic slope are more steeper than isothermal. Slope of adiabatic process =γ× slope of isothermal process
|
Topper's Solved these Questions
- THERMODYNAMICSBOOK - NARAYNACHAPTER - THERMODYNAMICSEXERCISE - Level-VI
150 Videos
- THERMODYNAMICSBOOK - NARAYNACHAPTER - THERMODYNAMICSEXERCISE - Passages
13 Videos
- THERMODYNAMICSBOOK - NARAYNACHAPTER - THERMODYNAMICSEXERCISE - Level-II (H.W)
24 Videos
- STRUCTURE OF ATOMBOOK - NARAYNACHAPTER - STRUCTURE OF ATOMEXERCISE - EXERCISE - IV EXEMPLAR PROBLEMS
24 Videos
Similar Questions
Knowledge Check
For adiabatic process
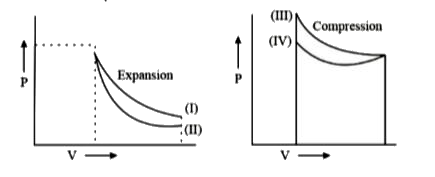
AW=qBW=ΔUCΔU=0DW=0Which of the figures given below show the adiabatic process ?
 AI,IIIBI,IIICII, IVDI,IV
An adiabatic process in which
Aq=+WBq=0CΔU=qDPΔV=0
Which of the following expression is/are correct for a adiabatic process?
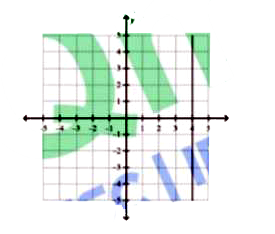
View SolutionThe equation of the graph given below is

View SolutionWhich of the following is true for reversible adiabatic process involving an ideal gas ?
View SolutionWhich of the following is (are) correct an adiabatic process?
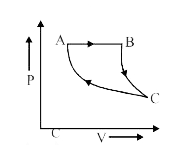
View SolutionFor a given thermodynamic process, the P – V diagram is as shown below:
Which of the following is the V – T diagram for the process?
A→C: isobaric
B→C: adiabatic
C→A : isothermal

View Solution
