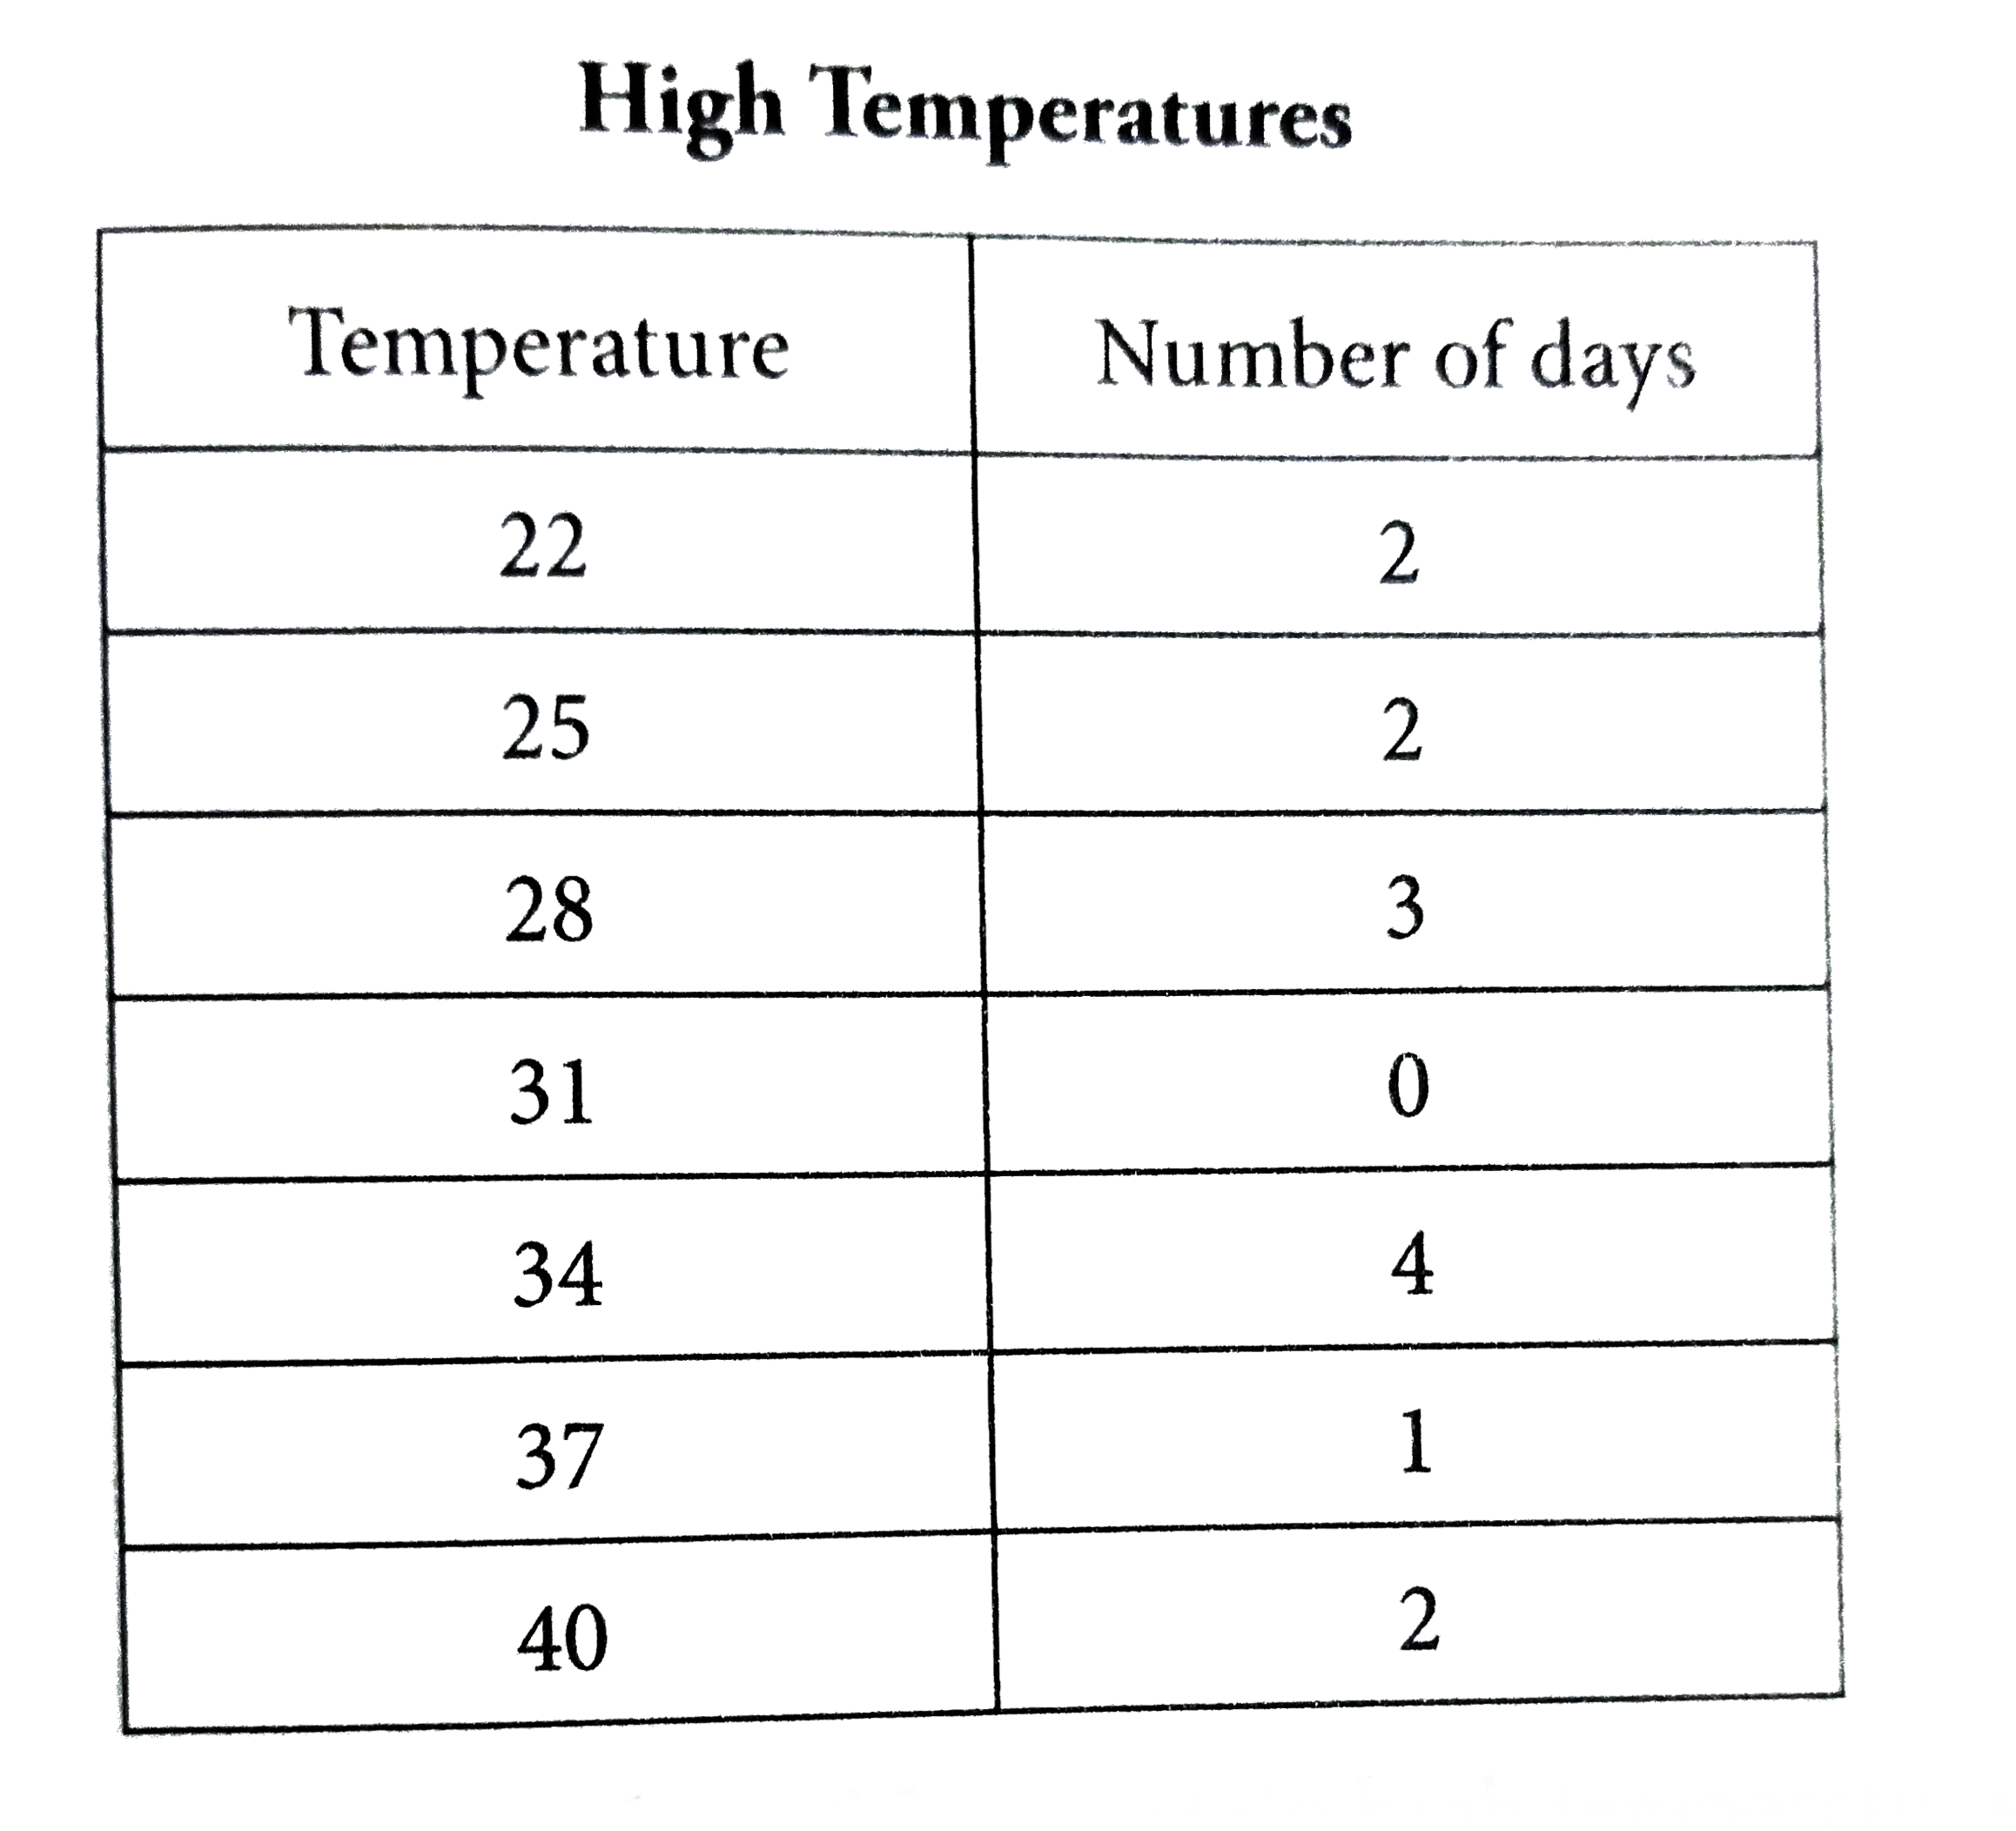
Janet recorded the number of days certain high termperatures were reached over a 14 day period. She later decided to add data for one more day. If the high temperature on that day was 37, what is the median temperature for the set of days?
The correct Answer is:D
Step by step video, text & image solution for Janet recorded the number of days certain high termperatures were reached over a 14 day period. She later decided to add data for one more day. If the high temperature on that day was 37, what is the median temperature for the set of days? by Maths experts to help you in doubts & scoring excellent marks in Class 12 exams.
Updated on:21/07/2023Topper's Solved these Questions
- ARITHMETICBOOK - PRINCETONCHAPTER - ARITHMETICEXERCISE - QUICK QUIZ #10
3 Videos
- ARITHMETICBOOK - PRINCETONCHAPTER - ARITHMETICEXERCISE - QUICK QUIZ #11
3 Videos
- ARITHMETICBOOK - PRINCETONCHAPTER - ARITHMETICEXERCISE - QUICK QUIZ #8
3 Videos
- ALGEBRA: CRACKING THE SYSTEMBOOK - PRINCETONCHAPTER - ALGEBRA: CRACKING THE SYSTEMEXERCISE - Algebra Drill 2: Calculator-Permitted Section
6 Videos
- FUN WITH FUNDAMENTALSBOOK - PRINCETONCHAPTER - FUN WITH FUNDAMENTALSEXERCISE - Fundamental Drill 2: Calculator- Permitted Section
6 Videos
Similar Questions
On a certain day at a certain time in Ladakh , the temperature was −21∘C . On the same day at the sametime , the temperature in Kolkata was 21∘C. What is the difference between these two temperatures ?
View SolutionFollowing number line shows the temperature in degree celsius 90∘C right ) at different places on a particular day. (a) Observe this number line and write the temperature of the places marked on it. (b) What is the temperature difference between the hottest and the coldest places among the above? (c) What is the temperature difference between Lahulspiti and Srinagar? (d) Can we say temperature of Srinagar and Shimla taken together is less than the temperature at Shimla? Is it also less than the temperature at Srinagar ?
View Solution
Knowledge Check
The mean number of tickets sold daily by a theater over a seven - day period was 52. The theater sold 46 tickets on the last day of that period. What was the mean number of tickets sold daily over the first six days ?
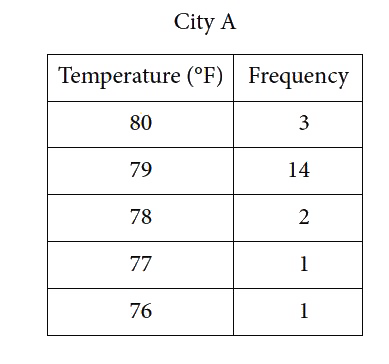
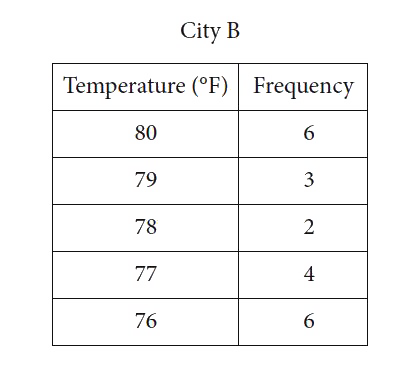
A53B54C55D56The tables below give the distribution of high temperatures in degrees Fahrenheit (°F) for City A and City B over the same 21 days in March


Which of the following is true about the data shown for these 21 days?AThe standard deviation of temperatures in City A is larger.BThe standard deviation of temperatures in City B is larger.CThe standard deviation of temperatures in City A is the same as that of City B.DThe standard deviation of temperatures in these cities cannot be calculated with the data provided.
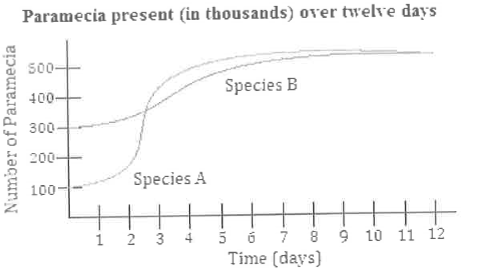
A small puddle is monitored by scientists for the number of paramecia present. The scientists are in two distinct species, let's call them ''species A'' and ''species B''. At time t = 0, the scientists measure and estimate the amount of species A and species B present in the puddle. They then proceed to measure and record the number of each species of paramecium present every hour for 12 days. the data for each species were then fit by a smooth curve, as shown in the graph above. Which of the following is a correct statement about the data above?AAt time t = 0, the number species B present is 150% greater than the number of species A presentBAt time t = 0, the number of species A present is 75% less than the number of species B presentCFor the first 3 days, the average growth rate of species B is higher than the average growth rate of species A.DThe growth rate of both rate of both species A and species B decreases for the last 8 days.
150 workers were engaged to finish a piece of work in a certain number of days. Four workers dropped the second day, four more workers dropped the third day and so on. It takes 8 more days to finish the work now. Find the number of days in which the work was completed.
View SolutionAbout 150 workers were engaged to finish a piece of work in a certain number of days. Four workers stopped working on the second day, four more workers stopped their work on the third day and so on. It took 8 more days to finish the work. Then the number of days in which the work was completed is 29 days b. 24 days c. 25 days d. none of these
View SolutionIn a factory, 150 workers were engaged to finish a piece of work in a certain number of days. However, if 4 workers are dropped everyday, except the first day, it will take 8 more days to finish the work. Find the number of days in which the work was to be completed.
View SolutionThe highest temperature recorded daily from January 26 to January 30 were: 7∘C,8∘C,6∘C,3.4∘C and 9.8∘C.
What was the average temperature for these days?
View SolutionThe chart below shows the number of small and large packages of a certain brand of cereal that were bought over a three - day period. The proce of a small box of this brand is $ 2.99, and the price of a large box is $3.99. Which of the following matrix expression represents the income, in dollars, received from the sale of cereal each of the three days ?
Day 1Day 2Day 3Large758257Small433650
View Solution
