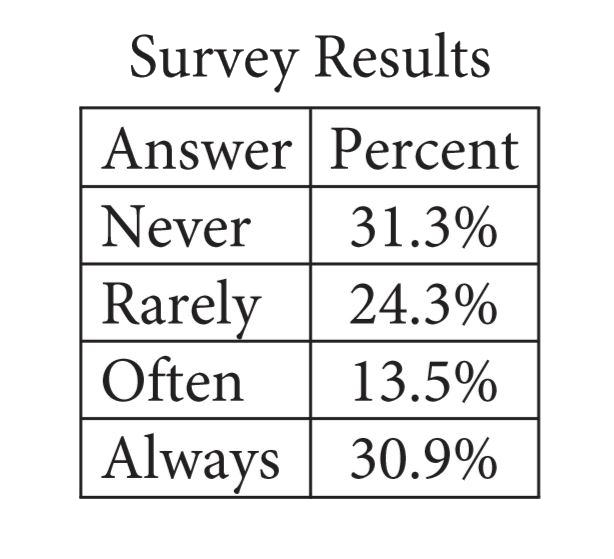
The table above shows the results of a survey in which tablet users were asked how often they would watch video advertisements in order to access streaming content for free. Based on the table, which of the following is closest to the probability that a tablet user answered “Always,” given that the tablet user did not answer “Never”?
A
0.31
B
0.38
C
0.45
D
0.69
Video Solution
Text Solution
The correct Answer is:C
It’s given that the tablet user did not answer “Never,” so the tablet user could have answered only “Rarely,” “Often,” or “Always.” These answers make up 24.3% + 13.5% + 30.9% = 68.7% of the answers the tablet users gave in the survey. The answer “Always” makes up 30.9% of the answers tablet users gave in the survey. Thus, the probability is 30.9%68.7%, or 0.3090.687 =0.44978 , which rounds up to 0.45
Choice A is incorrect. This reflects the tablet users in the survey who answered “Always.” Choice B is incorrect. This reflects all tablet users who did not answer “Never” or “Always.” Choice D is incorrect. This reflects all tablet users in the survey who did not answer “Never.”
|
Similar Questions
Find the area of the figure given below.

View SolutionThe area of the shaded part in the figure given below is ______.

View SolutionThe inequation represented by the graph given below is :
View SolutionThe inequation that best describes the graph given below is _________
View SolutionThe inequation that best describes the following graph is _________
View SolutionWhich inequations represent the shaded region in the given figure
View SolutionFind the magnitude of the resultant of shown forces :-
ltimg src="https://d10lpgp6xz60nq.cloudfront.net/physics_images/ALN_PHY_R02_E02_009_Q01.png" width="80%"gt
View Solution
