In the xy -plane, the graph of the function f(x)=x2+5x+4 has two x -intercepts. What is the distance between the x-intercepts?
A
1
B
2
C
3
D
4
Video Solution
Text Solution
The correct Answer is:C
The x-intercepts of the graph of f(x)=x2+5x+4 are the points (x, f (x )) on the graph where f (x ) = 0. Substituting 0 for f (x ) in the function equation yields 0=x2+5x+4. Factoring the right-hand side of 0=x2+5x+4 yields 0 = (x + 4)(x + 1). If 0 = (x + 4)(x + 1), then 0 = x + 4 or 0 = x + 1. Solving both of these equations for x yields x = −4 and x = −1. Therefore, the x-intercepts of the graph of f(x)=x2+5x+4 are (−4, 0) and (−1, 0). Since both points lie on the x-axis, the distance between (−4, 0) and (−1, 0) is equivalent to the number of unit spaces between −4 and −1 on the x-axis, which is 3.
Choice A is incorrect. This is the distance from the origin to the x-intercept (−1, 0). Choice B is incorrect and may result from incorrectly calculating the x-intercepts. Choice D is incorrect. This is the distance from the origin to the x-intercept (−4, 0).
|
Similar Questions

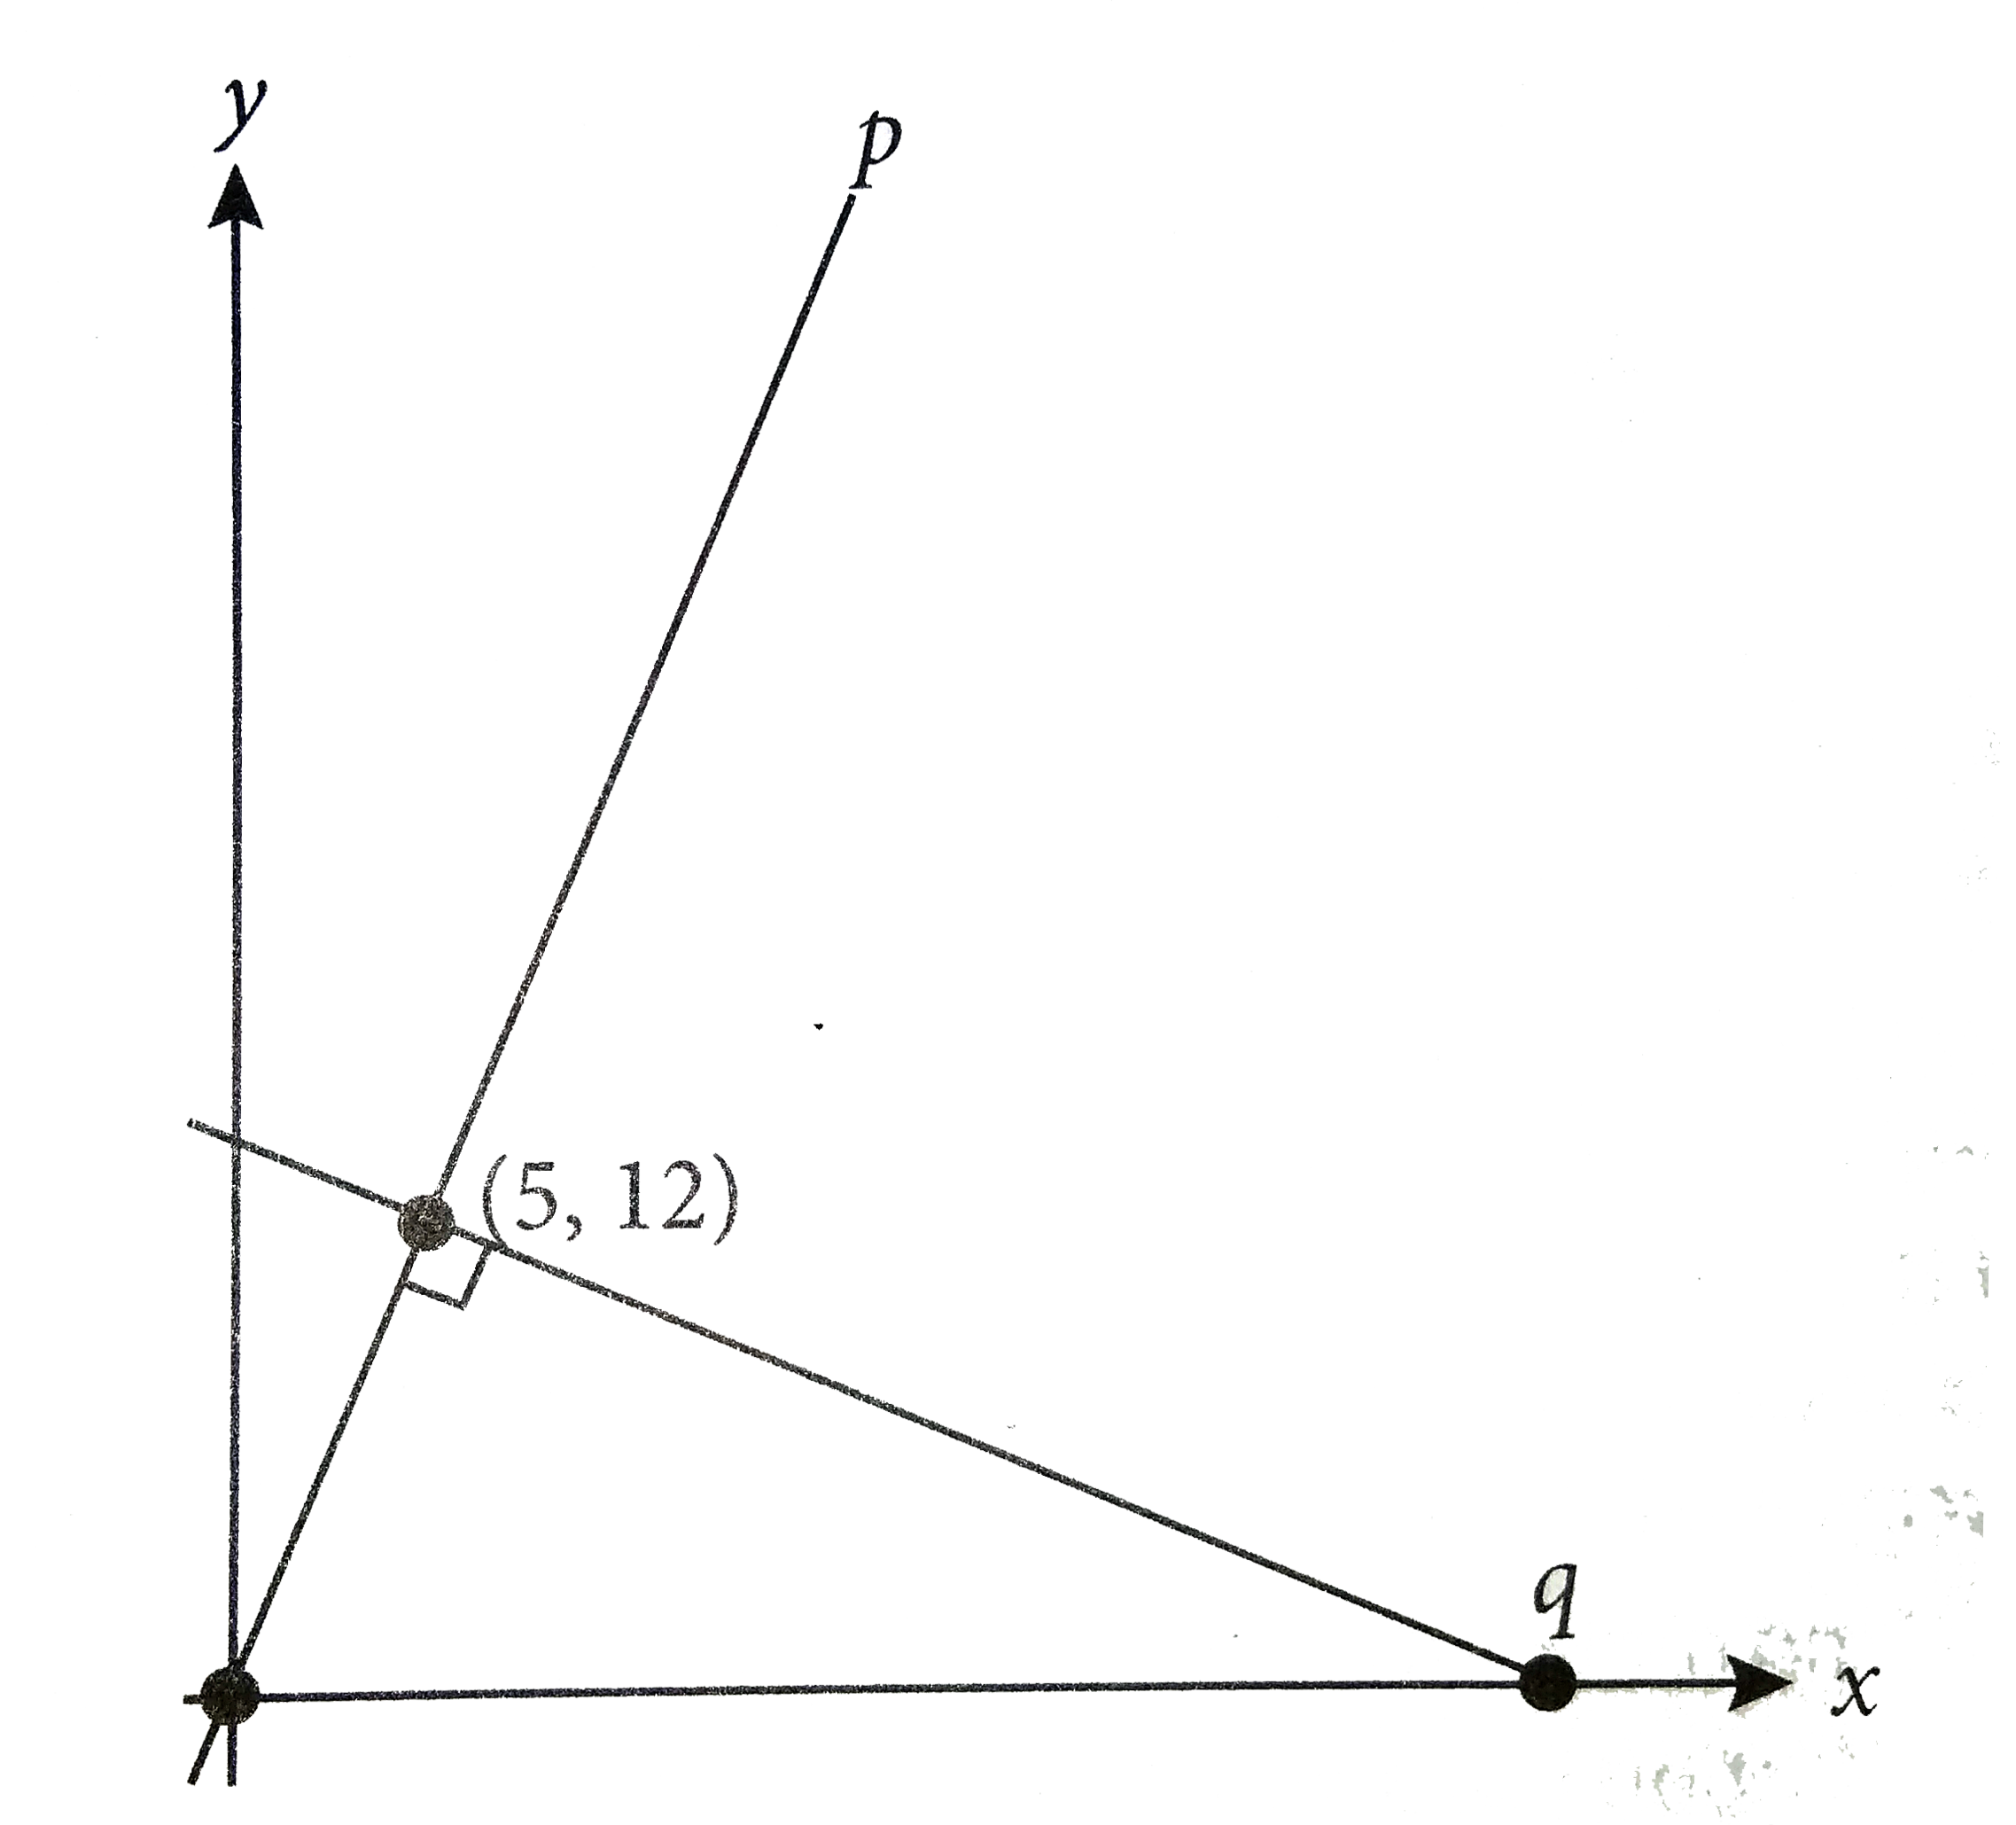
In the figure above, lines p and q are graphed on the xy-plane. What is the x-intercept of line q?
View SolutionFind the asymptotes, intercepts and sketch the graph of the function f(x)=x3x2−9
View SolutionFind the asymptotes, intercepts and sketch the graph of the function f(x)=2x+16x2−2x−15.
View SolutionFind the asymptotes, intercepts and sketch the graph the function f(x)=x2−x−6x−3
View SolutionFind the asymptotes, intercepts and sketch the graph of the function f(x)=x3−4xx2−4x+4
View SolutionFind the asymptotes, intercepts and sketch the graph of the function f(x)=x2+9x2−6x+9
View SolutionFind the asymptotes, intercepts and sketch the graph of the function f(x)=x2−4x3−4x2
View SolutionA function f is defined by f(x)=∫x0dt1+t2 The normal line to y=f(x) at x=1 has x -intercept equal to X and y -intercept equal to Y then
View Solution
