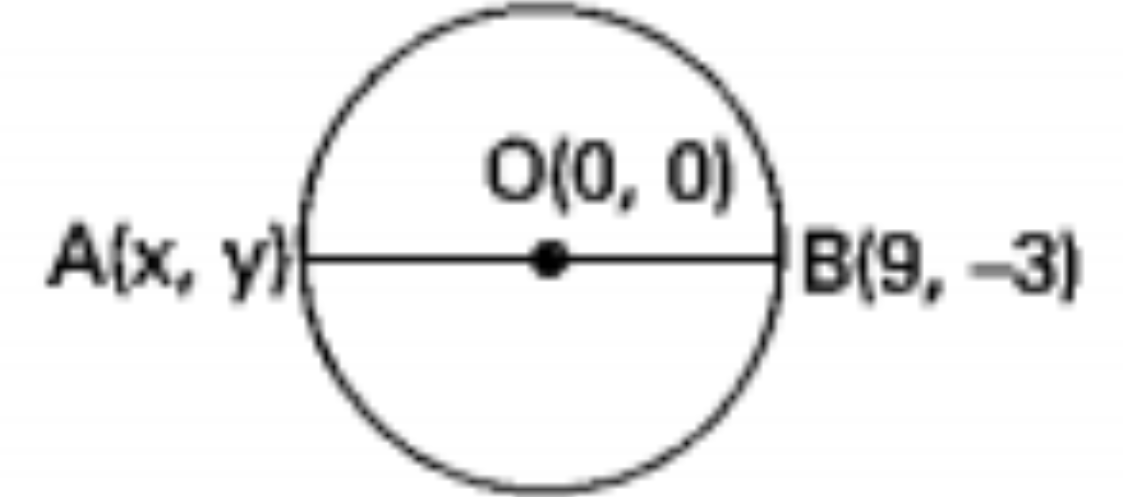
In the below figure x=……
 Solution in Telugu
10
12
13
19
The correct Answer is:A
Step by step video, text & image solution for In the below figure x=…… by Maths experts to help you in doubts & scoring excellent marks in Class 10 exams.
Updated on:21/07/2023Topper's Solved these Questions
- APPLICATIONS OF TRIGONOMETRYBOOK - VGS PUBLICATION-BRILLIANTCHAPTER - APPLICATIONS OF TRIGONOMETRYEXERCISE - EXERCISE
154 Videos
- APPLICATIONS OF TRIGONOMETRYBOOK - VGS PUBLICATION-BRILLIANTCHAPTER - APPLICATIONS OF TRIGONOMETRYEXERCISE - PUBLIC EXAMINATION
13 Videos
- APPENDIX MATHEMATICAL MODELLINGBOOK - VGS PUBLICATION-BRILLIANTCHAPTER - APPENDIX MATHEMATICAL MODELLINGEXERCISE - THINK & DISCUSS
1 Videos
- COORDINATE GEOMETRY BOOK - VGS PUBLICATION-BRILLIANTCHAPTER - COORDINATE GEOMETRY EXERCISE - CCE model examination
151 Videos
Similar Questions
Draw diagram for the following situtions :
A person is flying a kite at an angle of elevation α and the length of thread from his hand to kite is 'l'.
View SolutionThe ratio of the length of a rod and its shadow is 1:√3. Then the angle of elevation of the sun is…………
View SolutionDiscuss with your friends some more examples in real life where we cannot directly measure and must use mathematical modelling.
View SolutionFind the distance between the points (5 , 7) and (7 , 5) by plotting them in co-ordinate plane with the help of a right angled triangle .
View SolutionHow many lines of symmetry does the above figure have ?
View SolutionDetermine the point of symmetry of a regular hexagon.
View SolutionDtermine the images of the following figure about the given line :
View SolutionMatch the following Column A to Column B

View SolutionMatch the following Column A to Column B

View SolutionMatch the following Column A to Column B

View SolutionFind the area of figure given below.

View SolutionFind the perimeter of the figure given below.

View SolutionFind the area of the figure given below.

View SolutionThe area of the shaded part in the figure given below is ______.

View SolutionThe inequation represented by the graph given below is :
View SolutionThe inequation that best describes the graph given below is _________
View Solution
