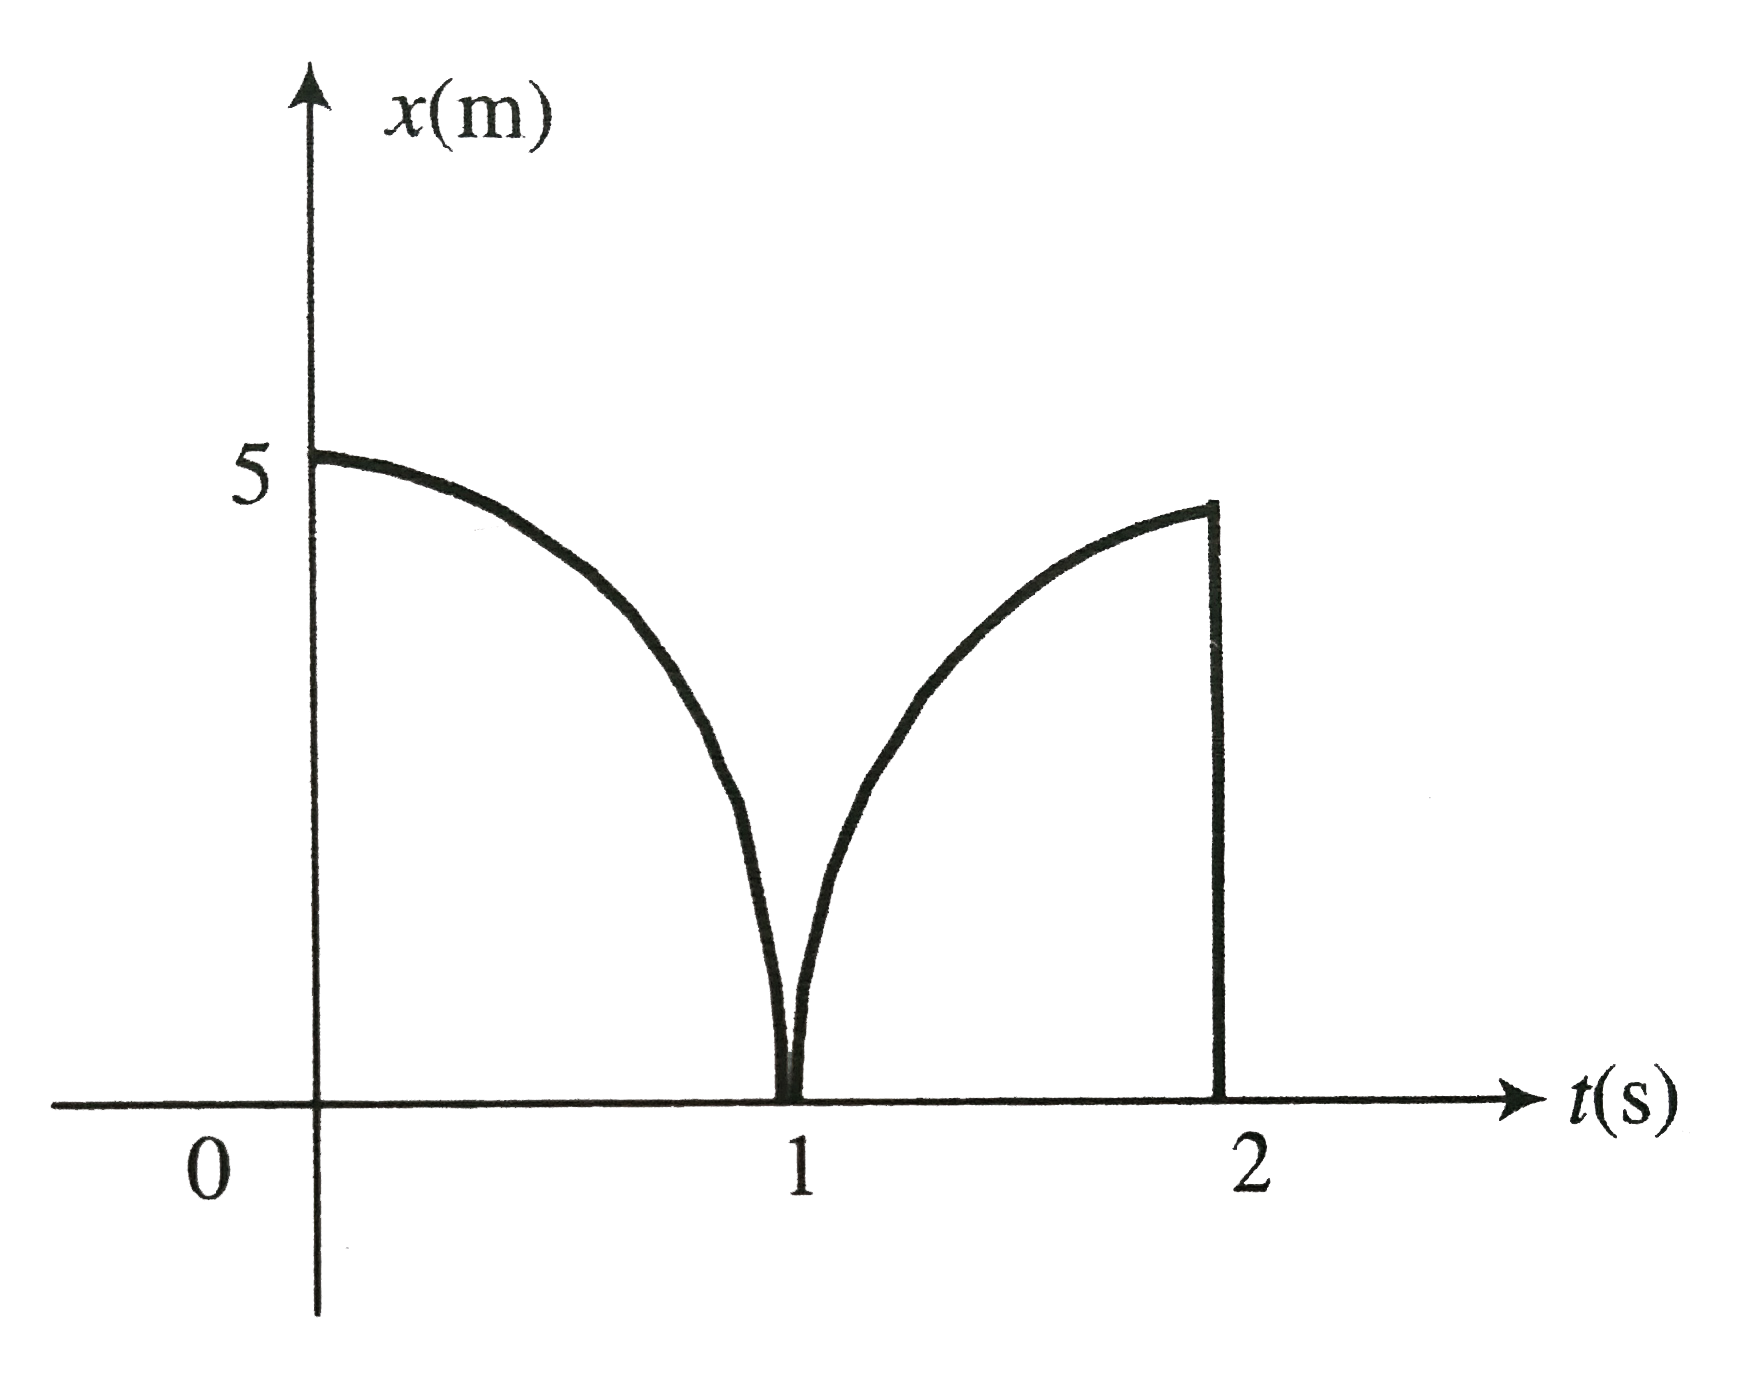
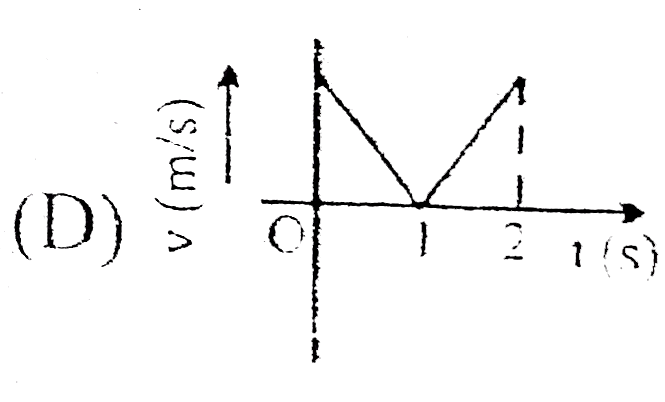
The displacement-time graph of a moving particle with constant acceleration is shown in. The velocity-time is given by
 .
.
A

B
C

D
Video Solution
Text Solution
The correct Answer is:A
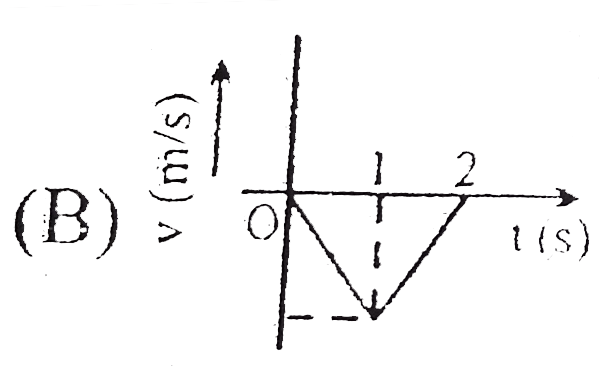
Frombig:−<br>Fortime∫ervalt=0→t=1sec<br>slopeofx−tgraphos¬ativeand∈creasingsovelocity∈creases∈¬ativedirection<br> For t=1 to 2sec
The slope is +ve and decreasing so velocity is decreasing in + ve direction and become zero at so (A) is correct
|
Topper's Solved these Questions
- MASTER PRACTICE PROBLEMBOOK - BANSALCHAPTER - MASTER PRACTICE PROBLEMEXERCISE - Comphrehension
134 Videos
- MASTER PRACTICE PROBLEMBOOK - BANSALCHAPTER - MASTER PRACTICE PROBLEMEXERCISE - Reasoning
75 Videos
- FLUID MECHANICSBOOK - BANSALCHAPTER - FLUID MECHANICSEXERCISE - PYQS AIEEE
10 Videos
- SEMICONDUCTORSBOOK - BANSALCHAPTER - SEMICONDUCTORSEXERCISE - CBSE Question
32 Videos
Similar Questions
Knowledge Check
The displacement-time graph of a moving particle with constant acceleration is shown in. The velocity-time is given by
 .A
.A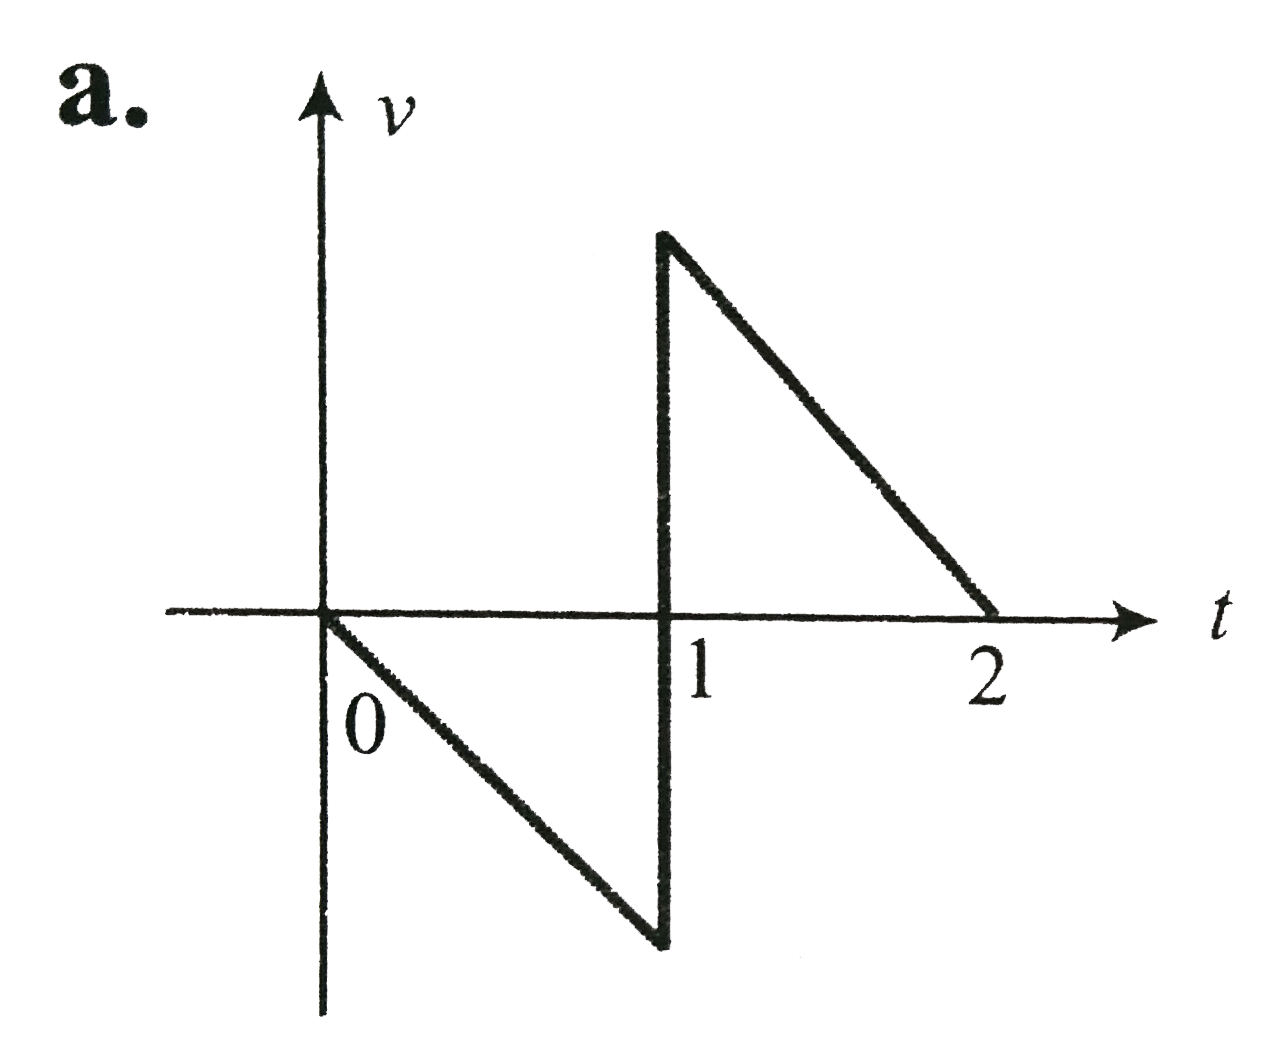 .B
.B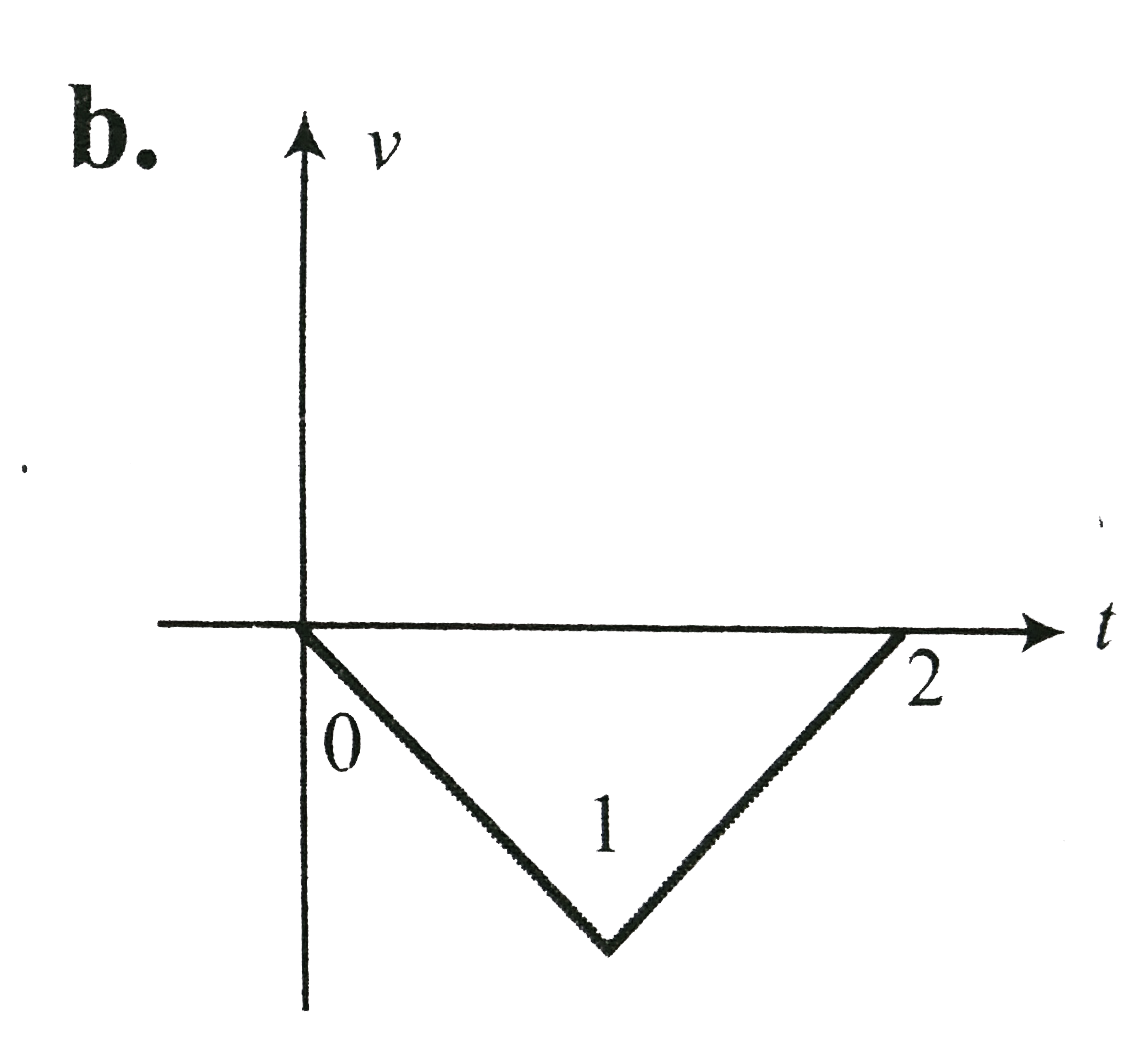 .C
.C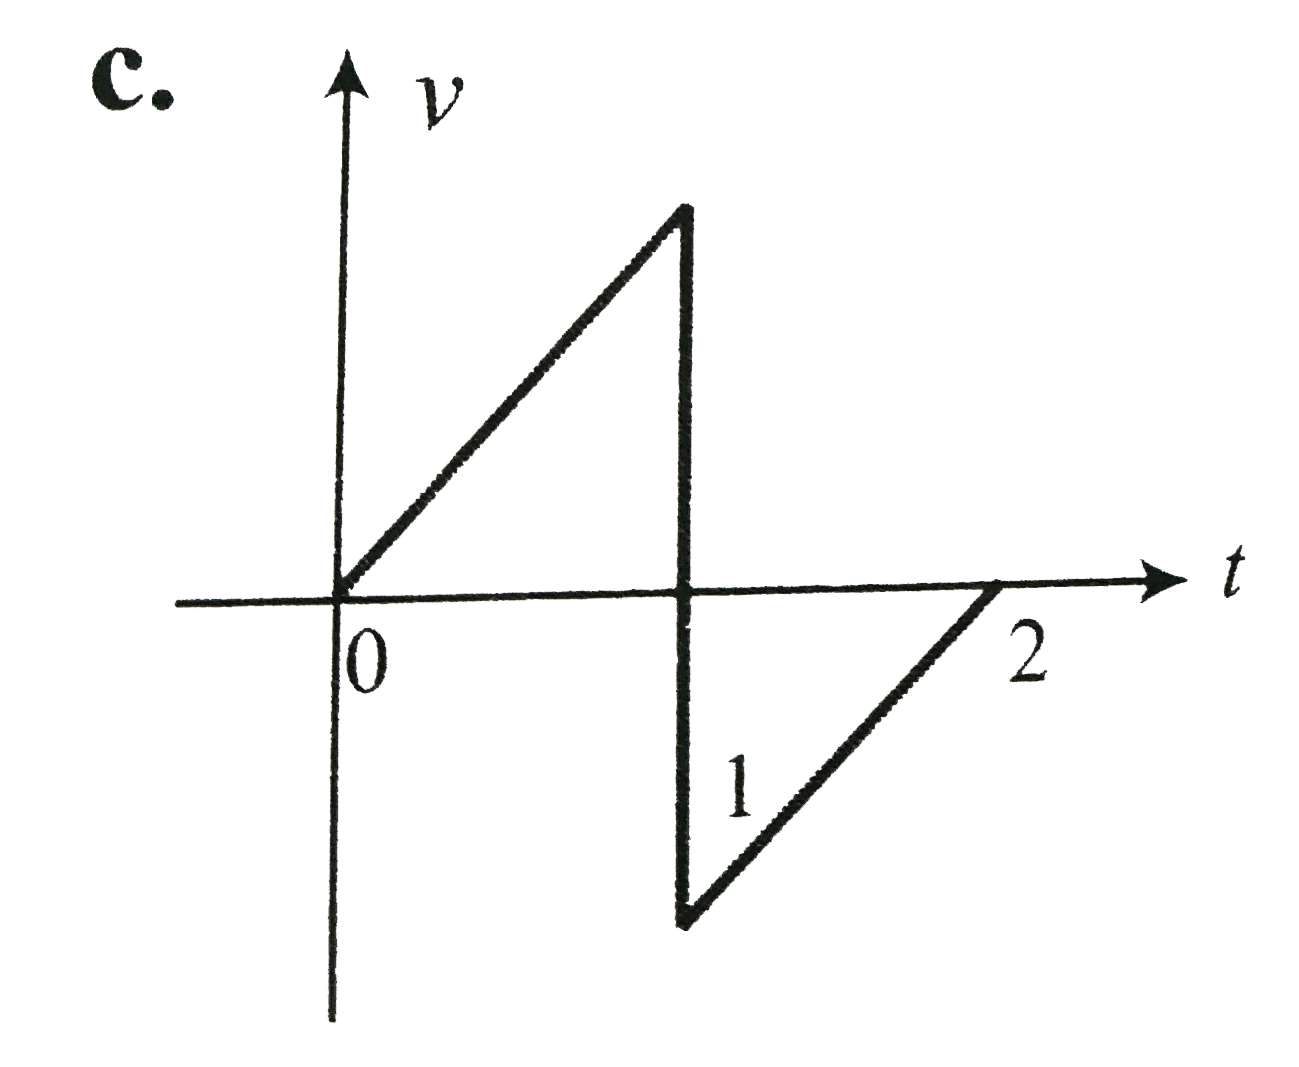 .D
.D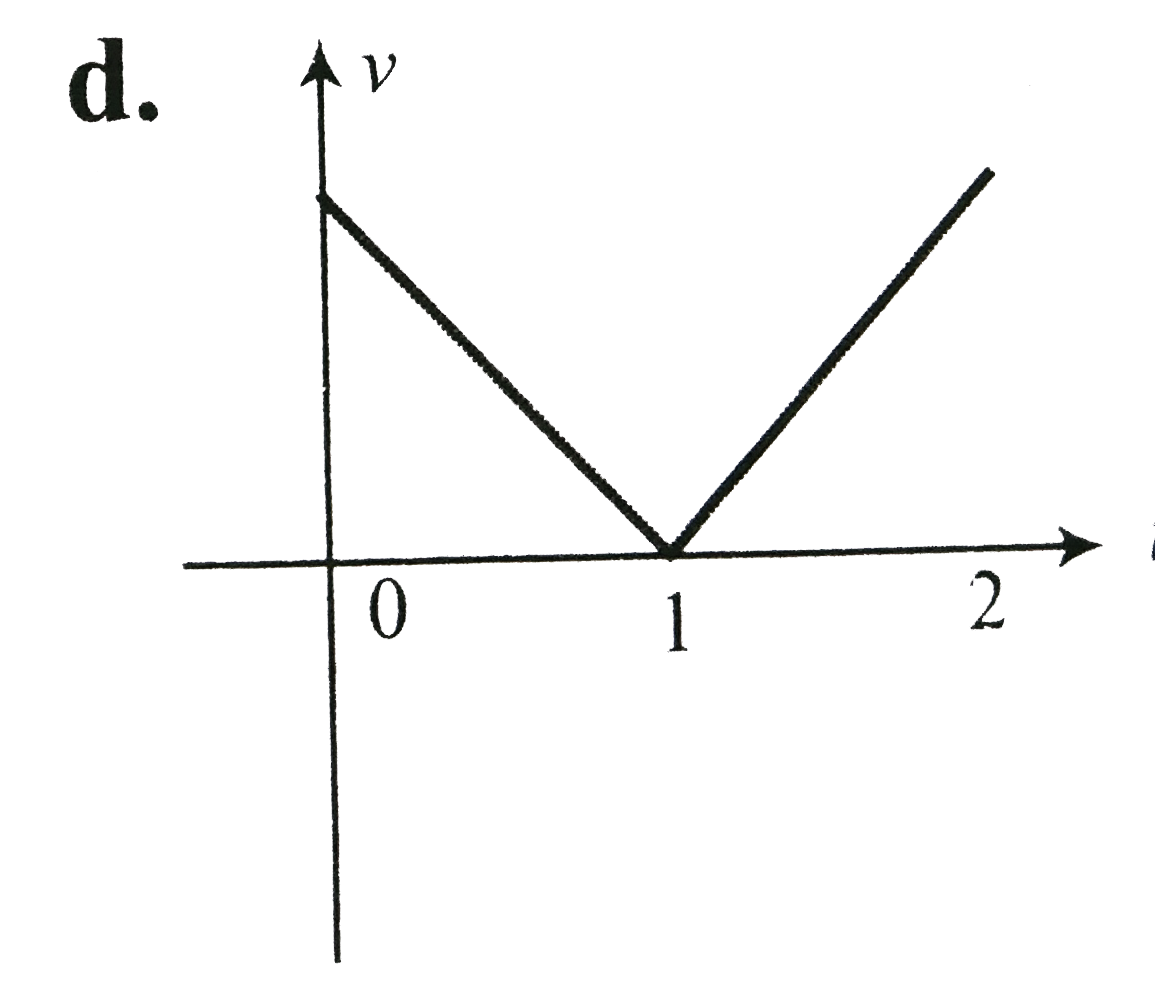 .
.Displacement time graph of a particle moving in a straight line is a shown in figure.
 Ain region A acceleration is positiveBin region B acceleration is negativeCin region C acceleration is positiveDin region D acceleration is negative
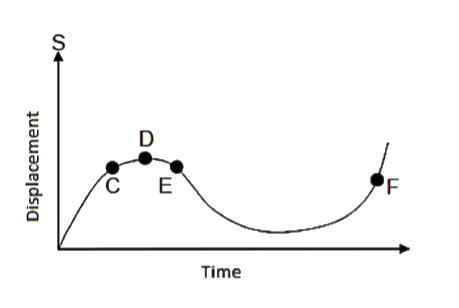
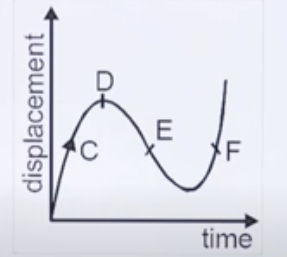
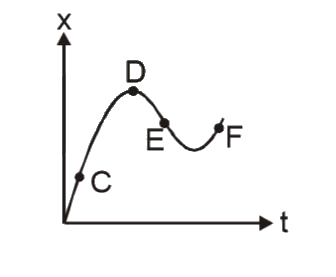
The displacement-time graph of a moving particle is shown below. The instantaneous velocity of the particle is negative at the point
ACBDCEDF
The displacement-time graph of a moving particle is shown below. The instantaneous velocity of the particle is negative at the point
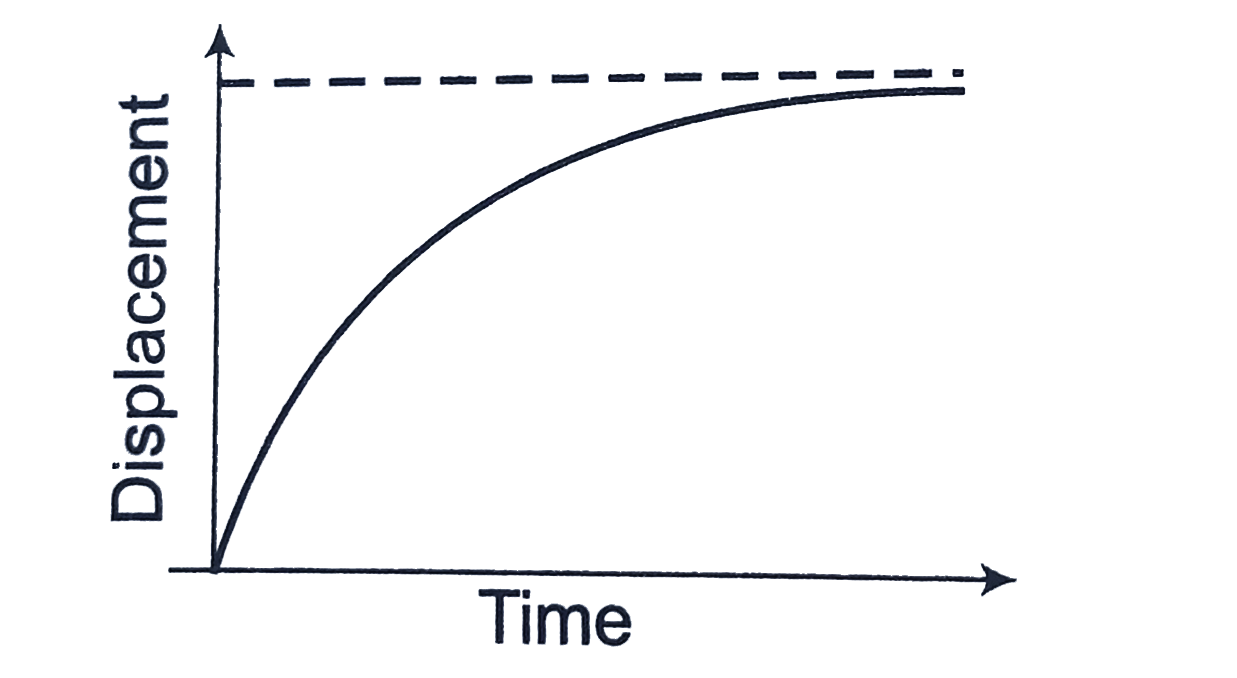
View SolutionThe displacement-time graph of a particle is as shown below. It indicates that
View SolutionThe displacement-time graph of moving particle is shown below
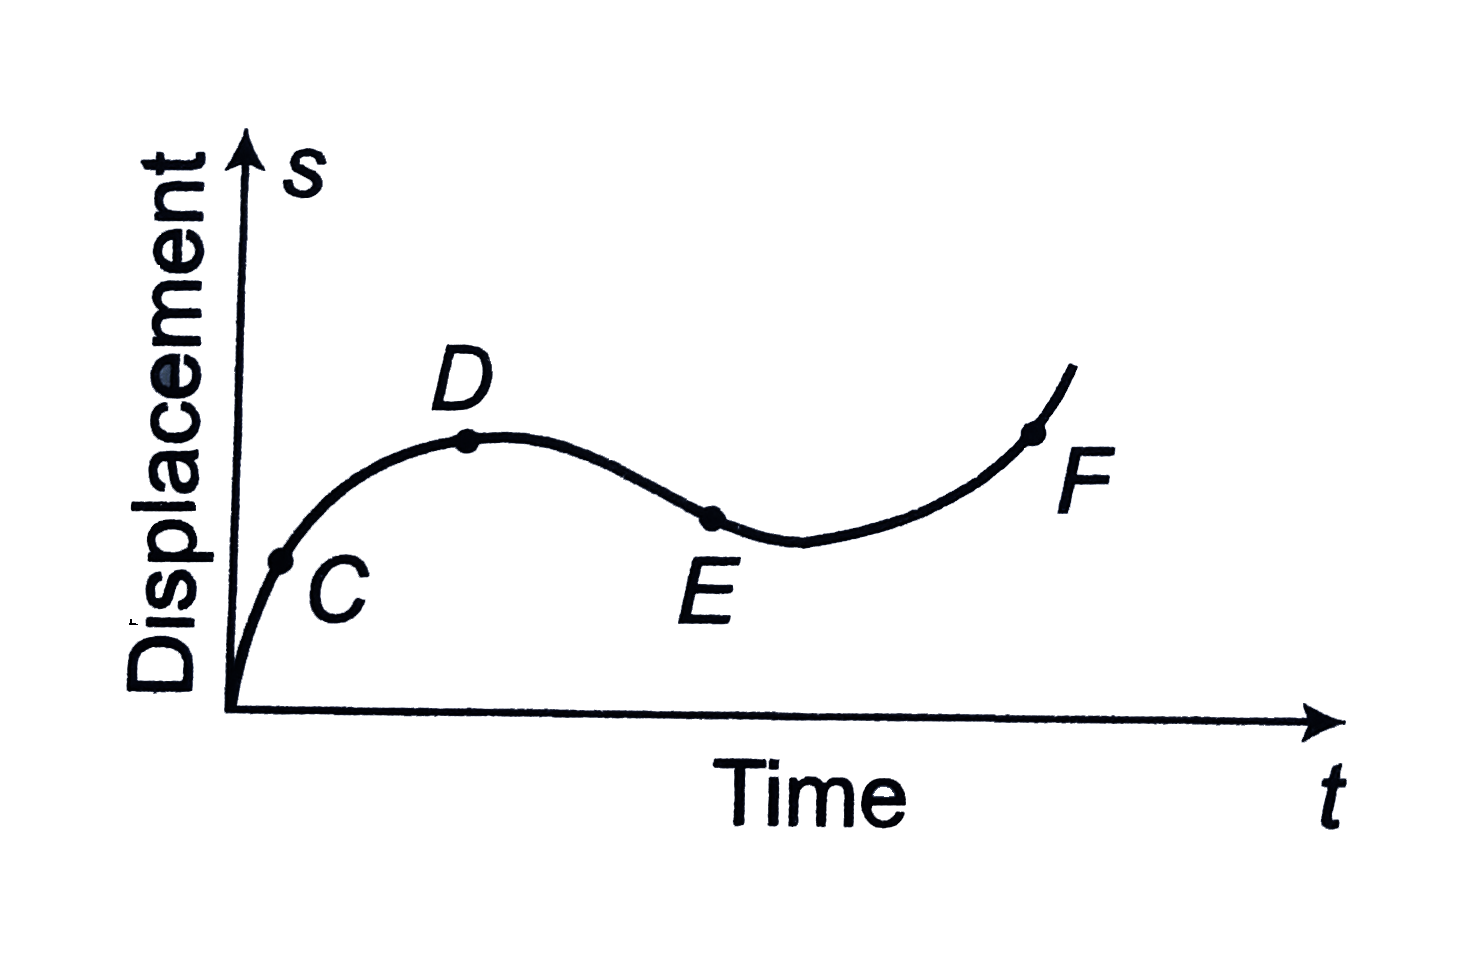
The instantaneous velocity of the particle in negative at the point
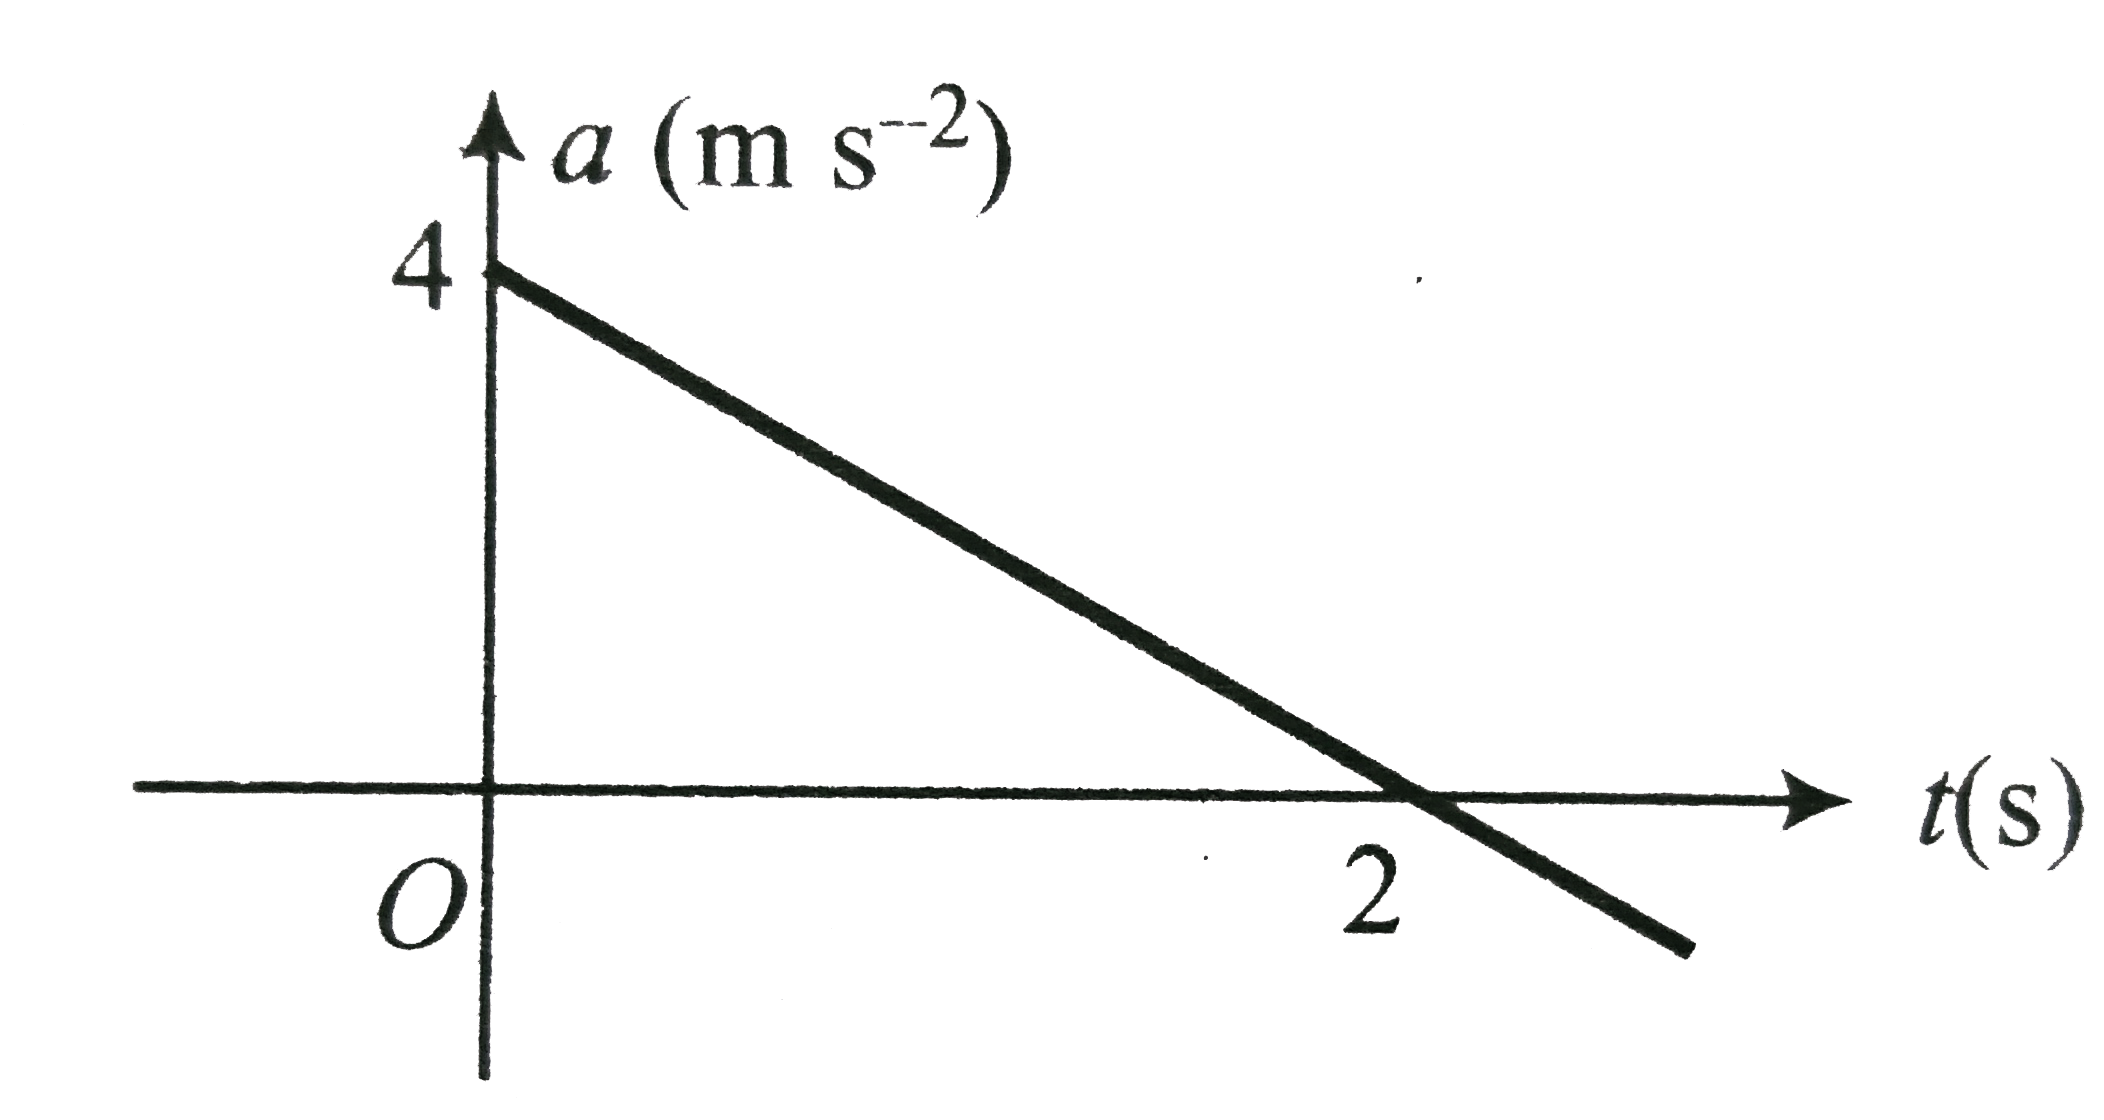
View SolutionThe acceleration versus time graph of a particle moving in a straight line is show in figure. The velocity-time graph of the particle would be
 .
.
View SolutionVelocity displacement graph of a particle moving in a straight line is as shown in figure.

View Solution


