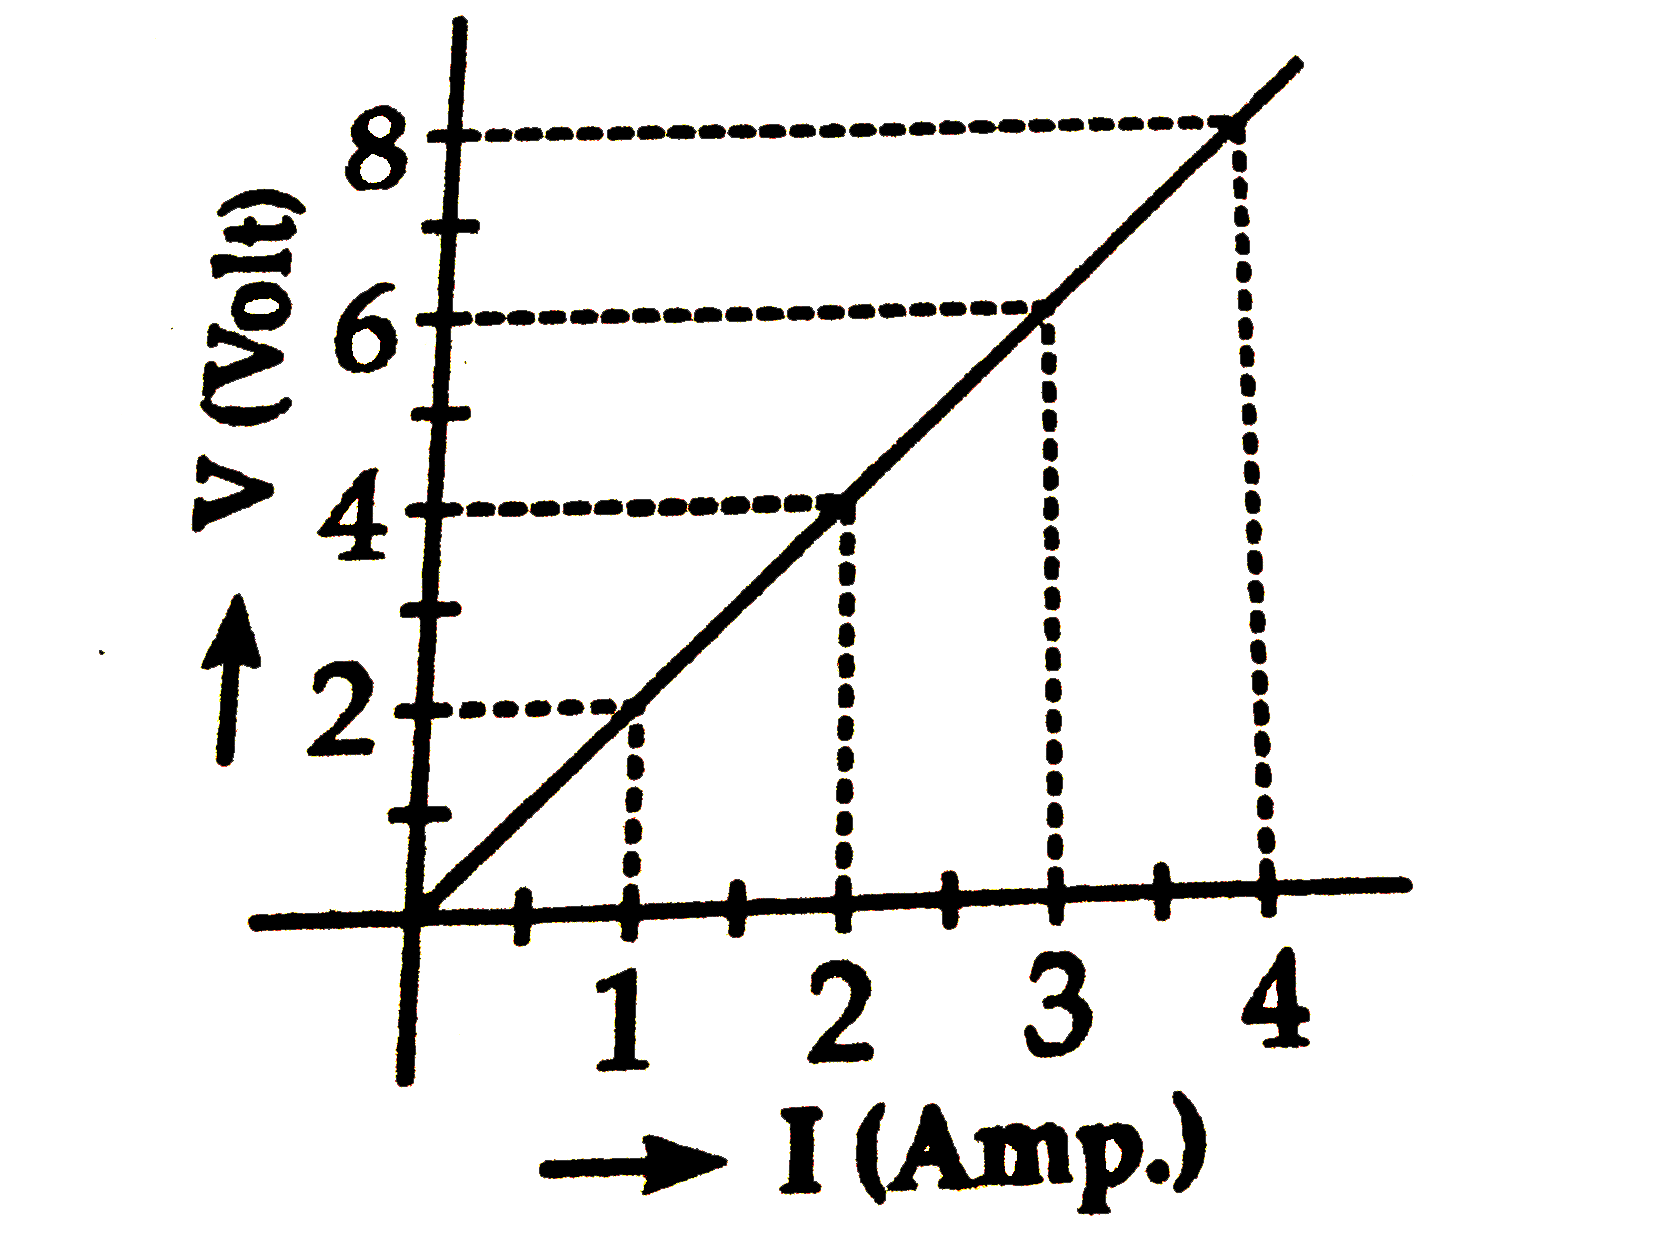
The current -voltage - variation for a wire of copper of length (L) and area (A) is shown in fig. The slope of the line will be
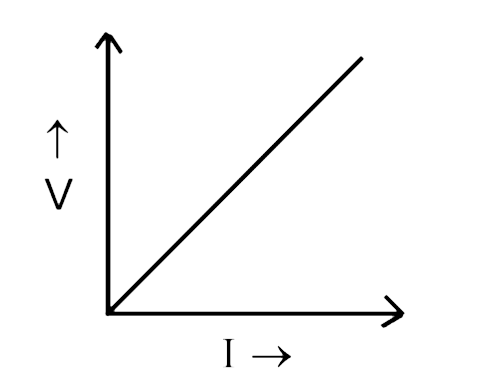
less if experiment is done at a heigher temperature
more if a wire of silver of same dimension is used
will be doubled if the lengths of the wire is doubled
will be halved if the length is doubled
The correct Answer is:C
Step by step video, text & image solution for The current -voltage - variation for a wire of copper of length (L) and area (A) is shown in fig. The slope of the line will be by Physics experts to help you in doubts & scoring excellent marks in Class 12 exams.
Updated on:21/07/2023Topper's Solved these Questions
Similar Questions
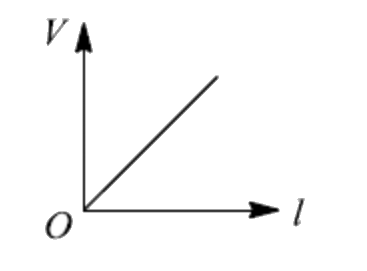
The V – I graph for a wire of copper of length L and cross -section area A is shown in the figure below . The slope of the graph will be
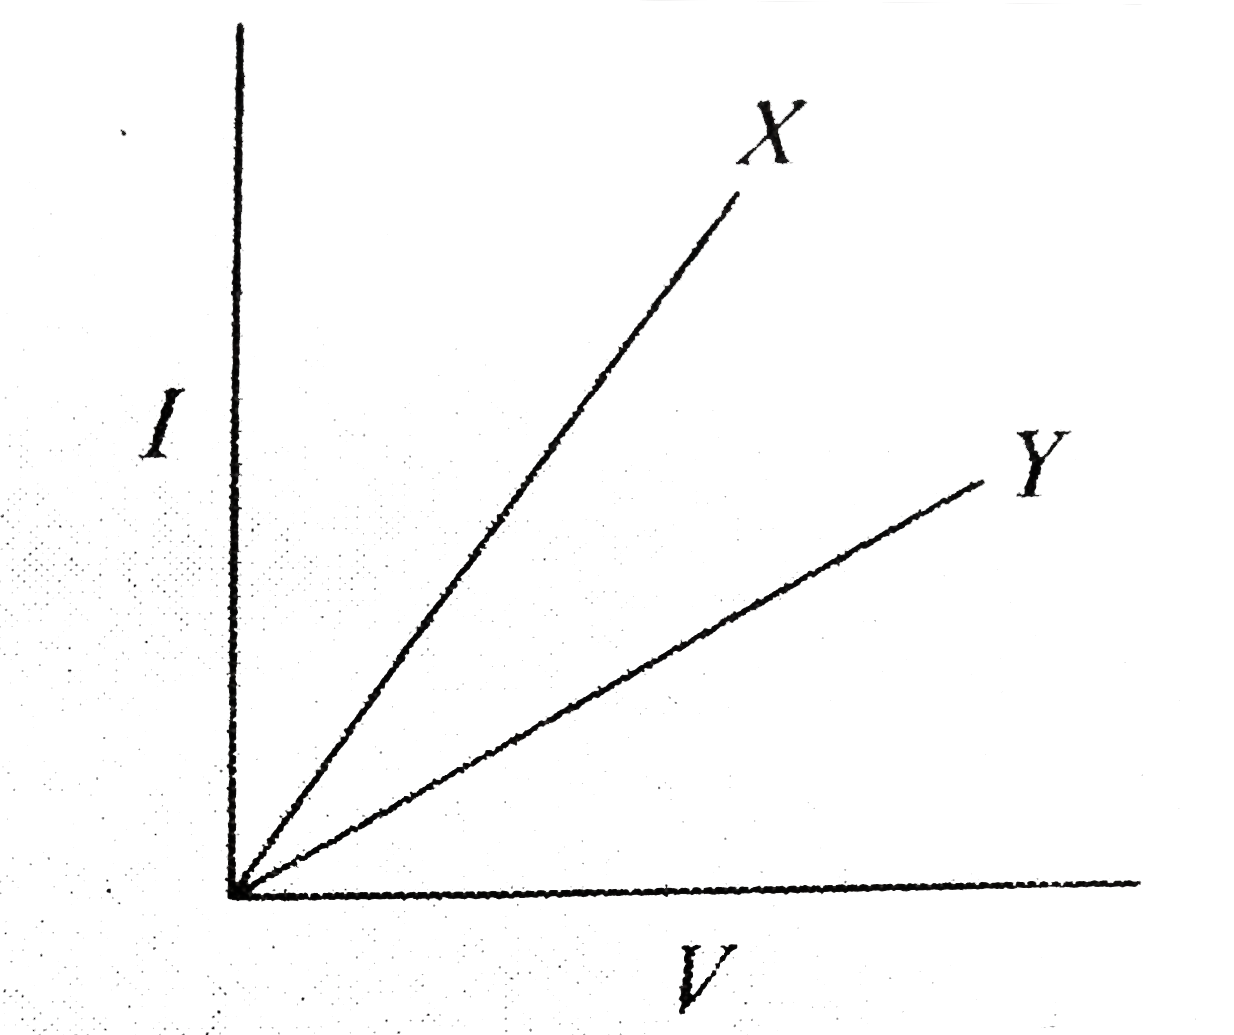
View SolutionThe voltage-current variations of two metallic wire X and Y at constant temperature is shown in fig Assumign that the wires have the same length and the same diameter, explain which of the two wires will have larger resisitivity.
View Solution
Knowledge Check
I−V characteristics of a copper wire of length L and area fo cross-section A is shown in Fig. The slope of the curve becomes
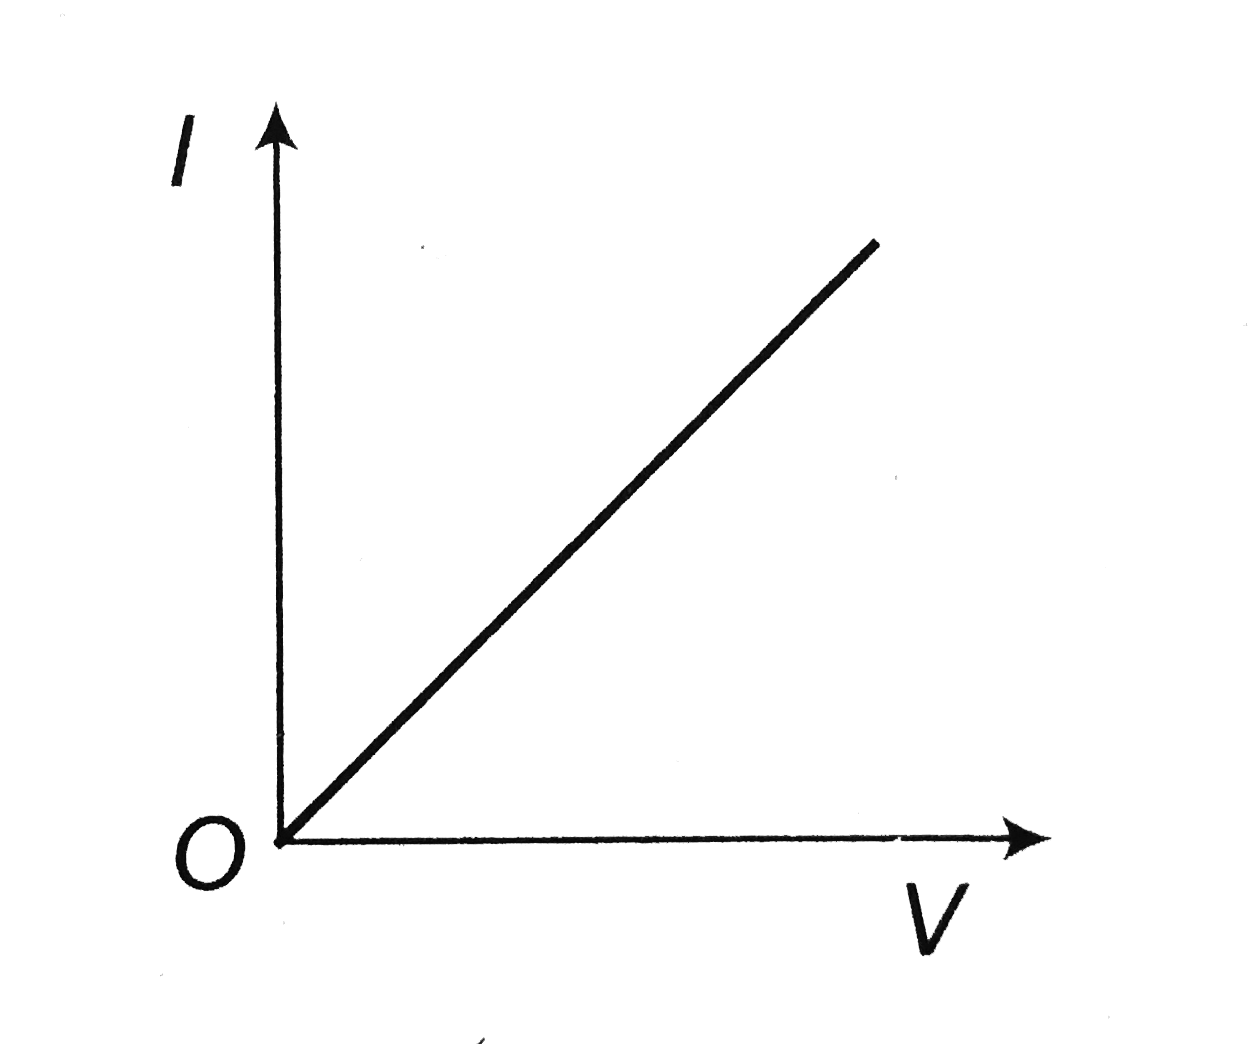 AMore if the experiment is performed at higher temperatureBMore if a wire of steel of same dimension is usedCMore if the length of the wire increasedDLess if the length of the wire is increased
l-V characteristic of a copper wire of length Land area of cross-section A is shown in figure. The slope of the curve becomes
 AMore if the experiment is performed at higher temperatureBMore if a wire of steel of same dimension is usedCMore if the length of the wire is increasedDLess if the length of the wire is increased
Calculate slope of shown line
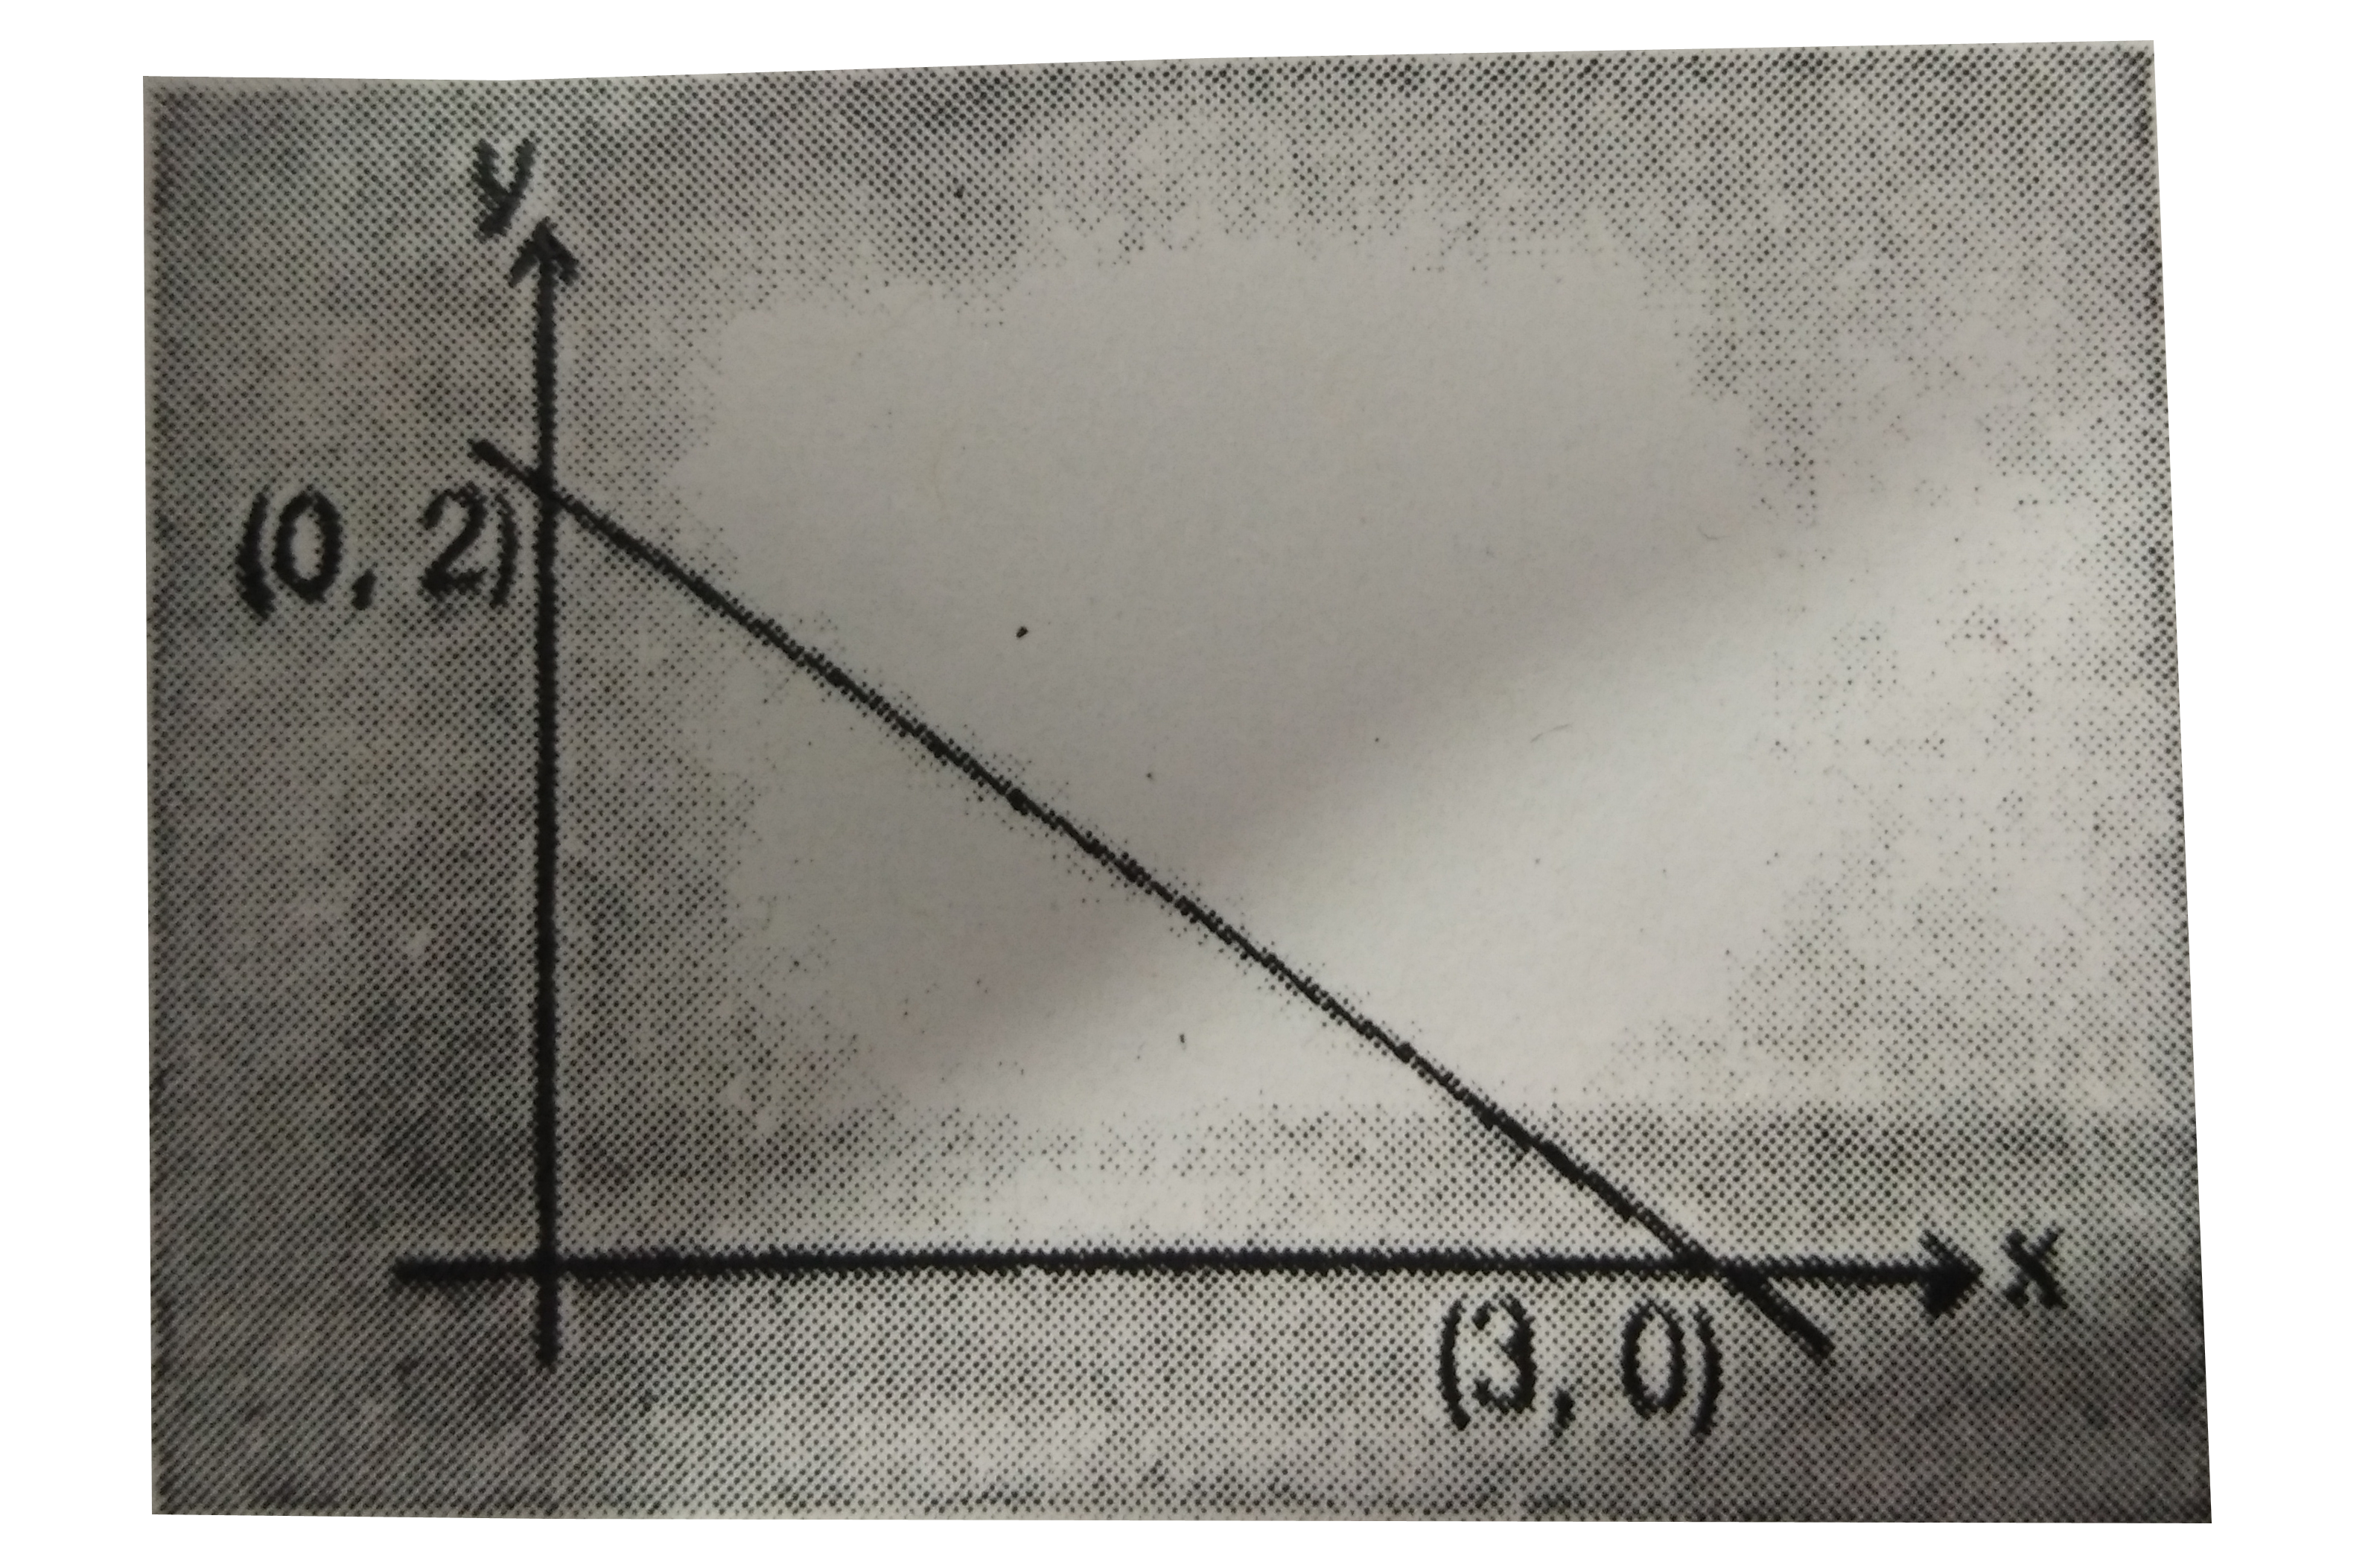 A1B-2C0D-2/3
Variation of current and voltage in a conductor is shown in the adjoining figure. The resistance of the conductor is
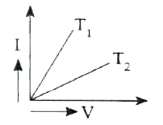
View SolutionThe current I and voltage V variations for a given metallic wire at tow different temperature T1andT2 are shown in the figure. Then which one of the following is correct
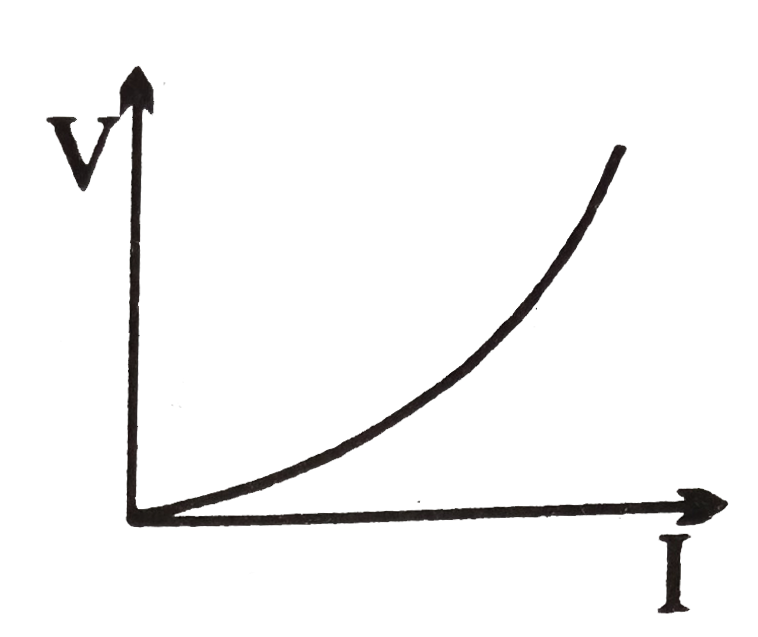
View SolutionThe variation of current (I) and voltage (V) is as shown in figure A. The variation of power P with current I is best shown by which of the following graph
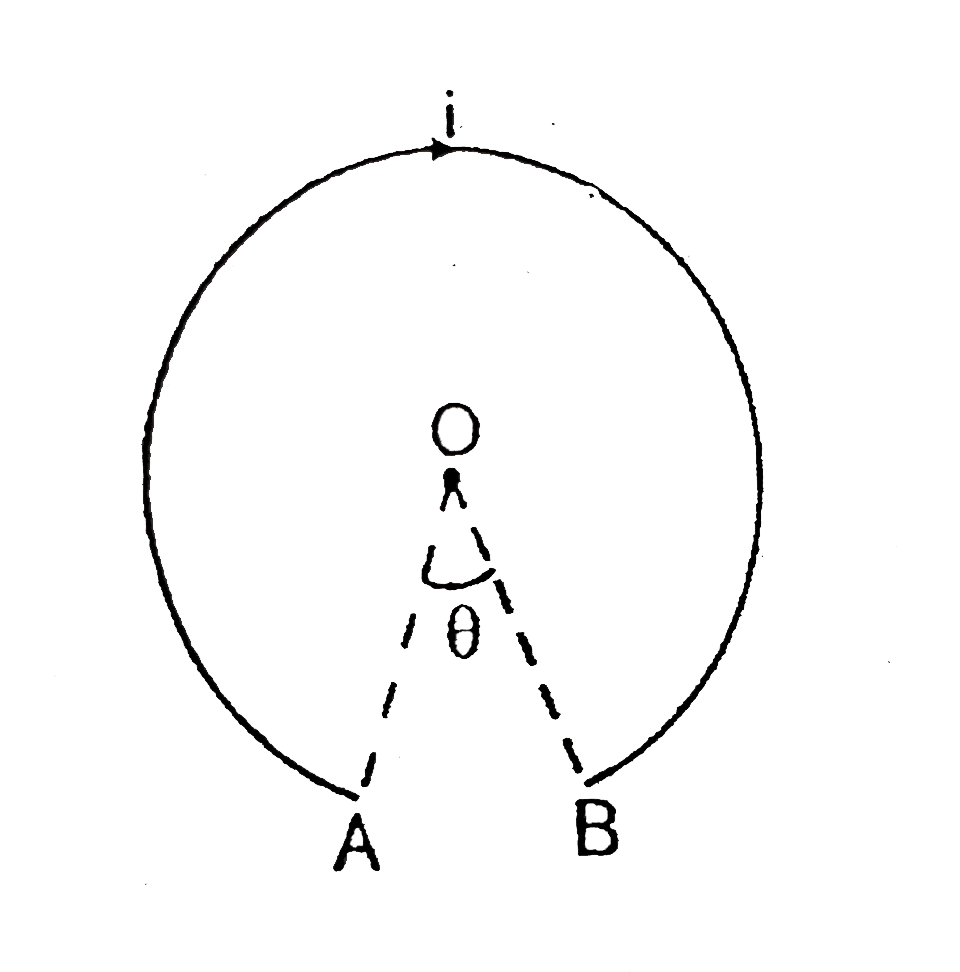
View SolutionA current carrying wire AB of the length L is turned along a circle, as shown in figure. The magnetic field at the centre O.
View SolutionA steady current I flows through a wire of radius r, length L and resistivity ρ. The current produced heat in the wire. The rate of heat loss in a wire is proportional to its surface area. The steady temperature of the wire is independent of–
View Solution

