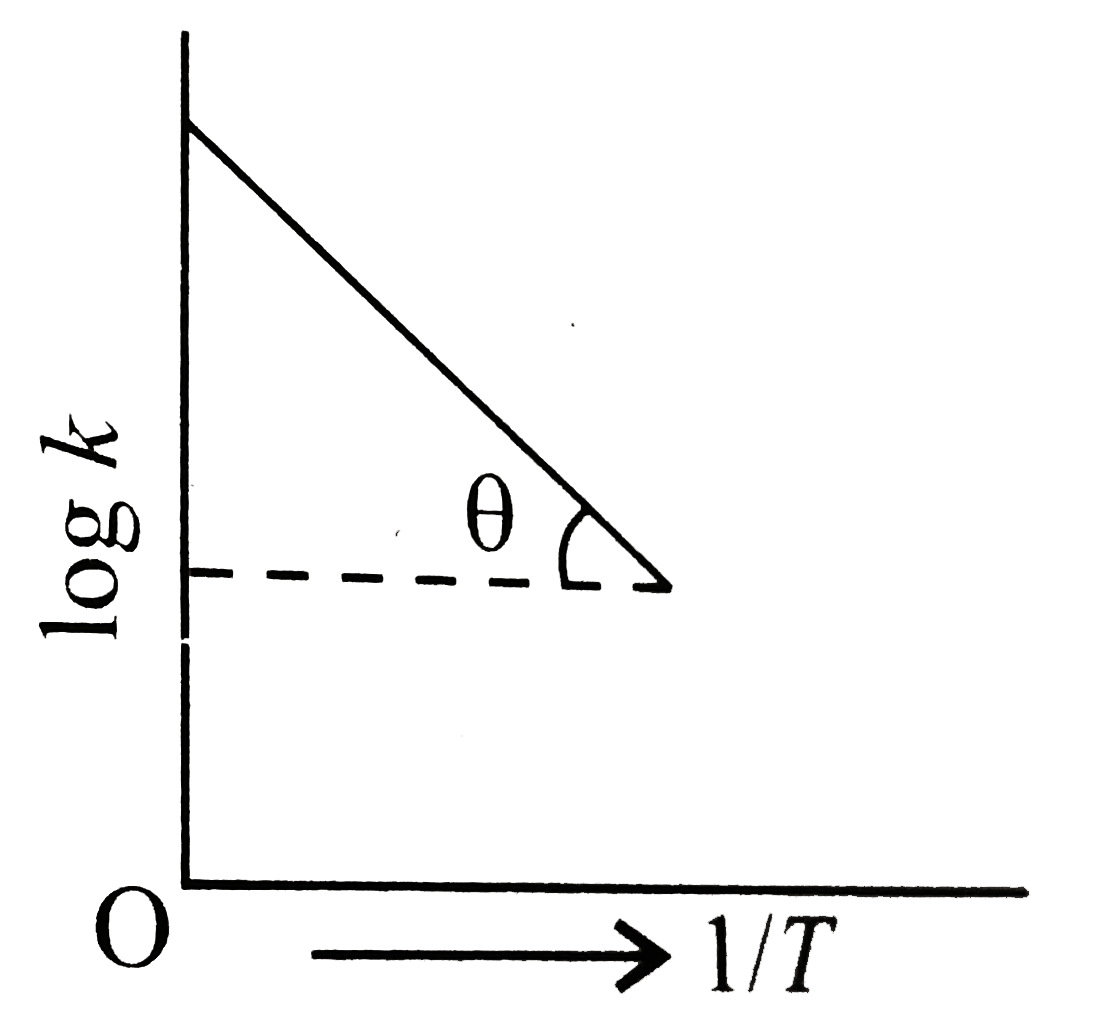
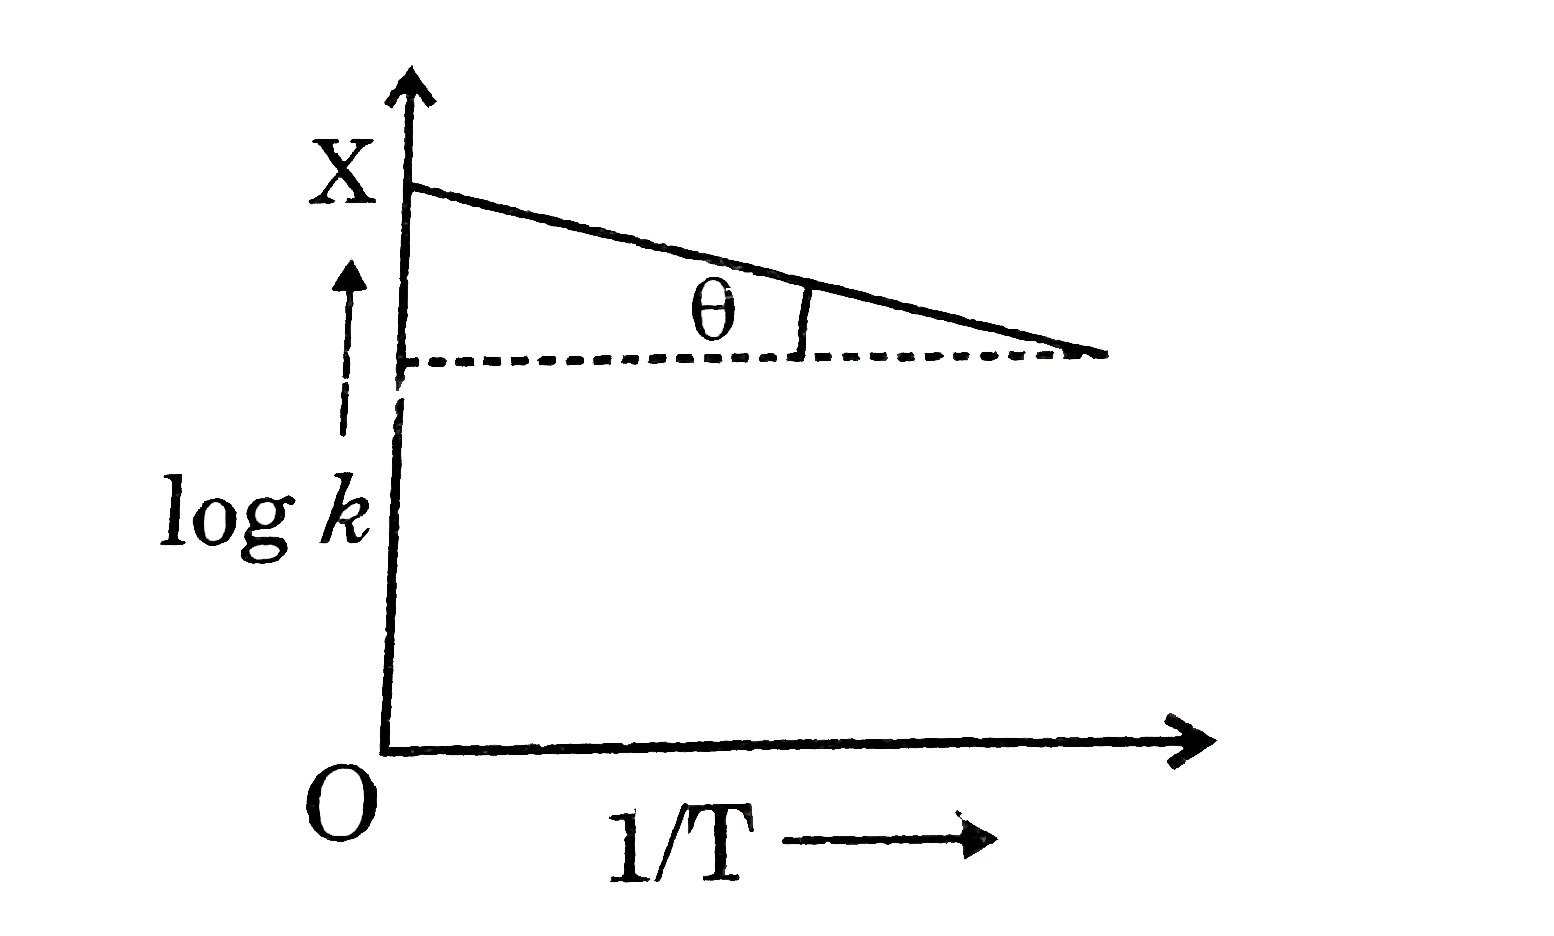
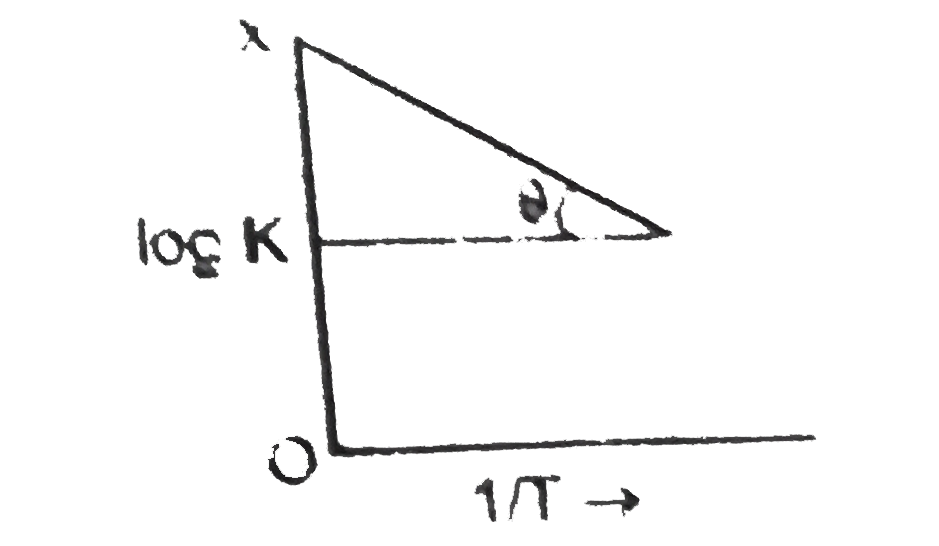
Graph between logk and 1/T [k rate constant (s−1) and T and the temperature (K)] is a straight line with OX=5,θ=tan−1(1/2.303). Hence −Ea will be
![Graph between log k and 1//T [k rate constant (s^(-1)) and T and the temperature (K)] is a straight line with OX =5, theta = tan^(-1) (1//2.303). Hence -E(a) will be](https://d10lpgp6xz60nq.cloudfront.net/physics_images/KSV_PHY_CHM_P2_C04_E01_154_Q01.png)
A
2.303×2cal
B
22.303cal
C
2cal
D
None of these
Video Solution
Text Solution
The correct Answer is:3
We know, logK=logA−Ea2.303RT
compare this by y=mx+c
m=−Ea2.303Rslpe of this
Given −Ea2.303R=−12.303
Ea=R=2cal
|
Topper's Solved these Questions
- CARBONYL COMPOUNDS (ALDEHYDES & KETONES ) & CARBOXYLIC ACID Book:RESONANCEChapter:CARBONYL COMPOUNDS (ALDEHYDES & KETONES ) & CARBOXYLIC ACID Exercise:Part -IV
Explore 23 Videos
- CHEMISTRY IN EVERYDAY LIFEBook:RESONANCEChapter:CHEMISTRY IN EVERYDAY LIFEExercise:ORGANIC CHEMISTRY(Chemistry in every day life)
Explore 31 Videos
Similar Questions
Knowledge Check
Graph between logk and 1/T [k rate constant (s−1) and T and the temperature (K)] is a straight line with OX=5,θ=tan−1(1/2.303). Hence −Ea will be
 A2.303×2 calB2/2.303 calC2 calDnone
Graph between log k and 1/T [where K is rate constant in s−1 and T is the temperature (in K) is a straight line with Hence, Ea will be
 A2.303×2 calB22.303calC2 calDNone of these
Graph between log k and 1T (k is rate constant in s−1 and T is the temperature in K) is a straight line. As shown in figure if OX = 5 and slope of the line =−12.303then Ea is :
 A2.303×2calB22.303calC2 calDnone of these
A graph plotted between log k vs 1T is represented by
View SolutionThe graph between the log K versus 1T is a straight line. The slope of the line is
View SolutionIf a graph is plotted between ln k and 1/T for the first order reaction, the slope of the straight line so obtained is given by
View SolutionRate constant k varies with temperature by equation logk(−1min)=log5−2000kcalRT×2.303. We can conclude that
View SolutionWhen loge k is plotted against 1T using the Arrhenius equation a straight line is expected with a slope equal to ,
View Solution


