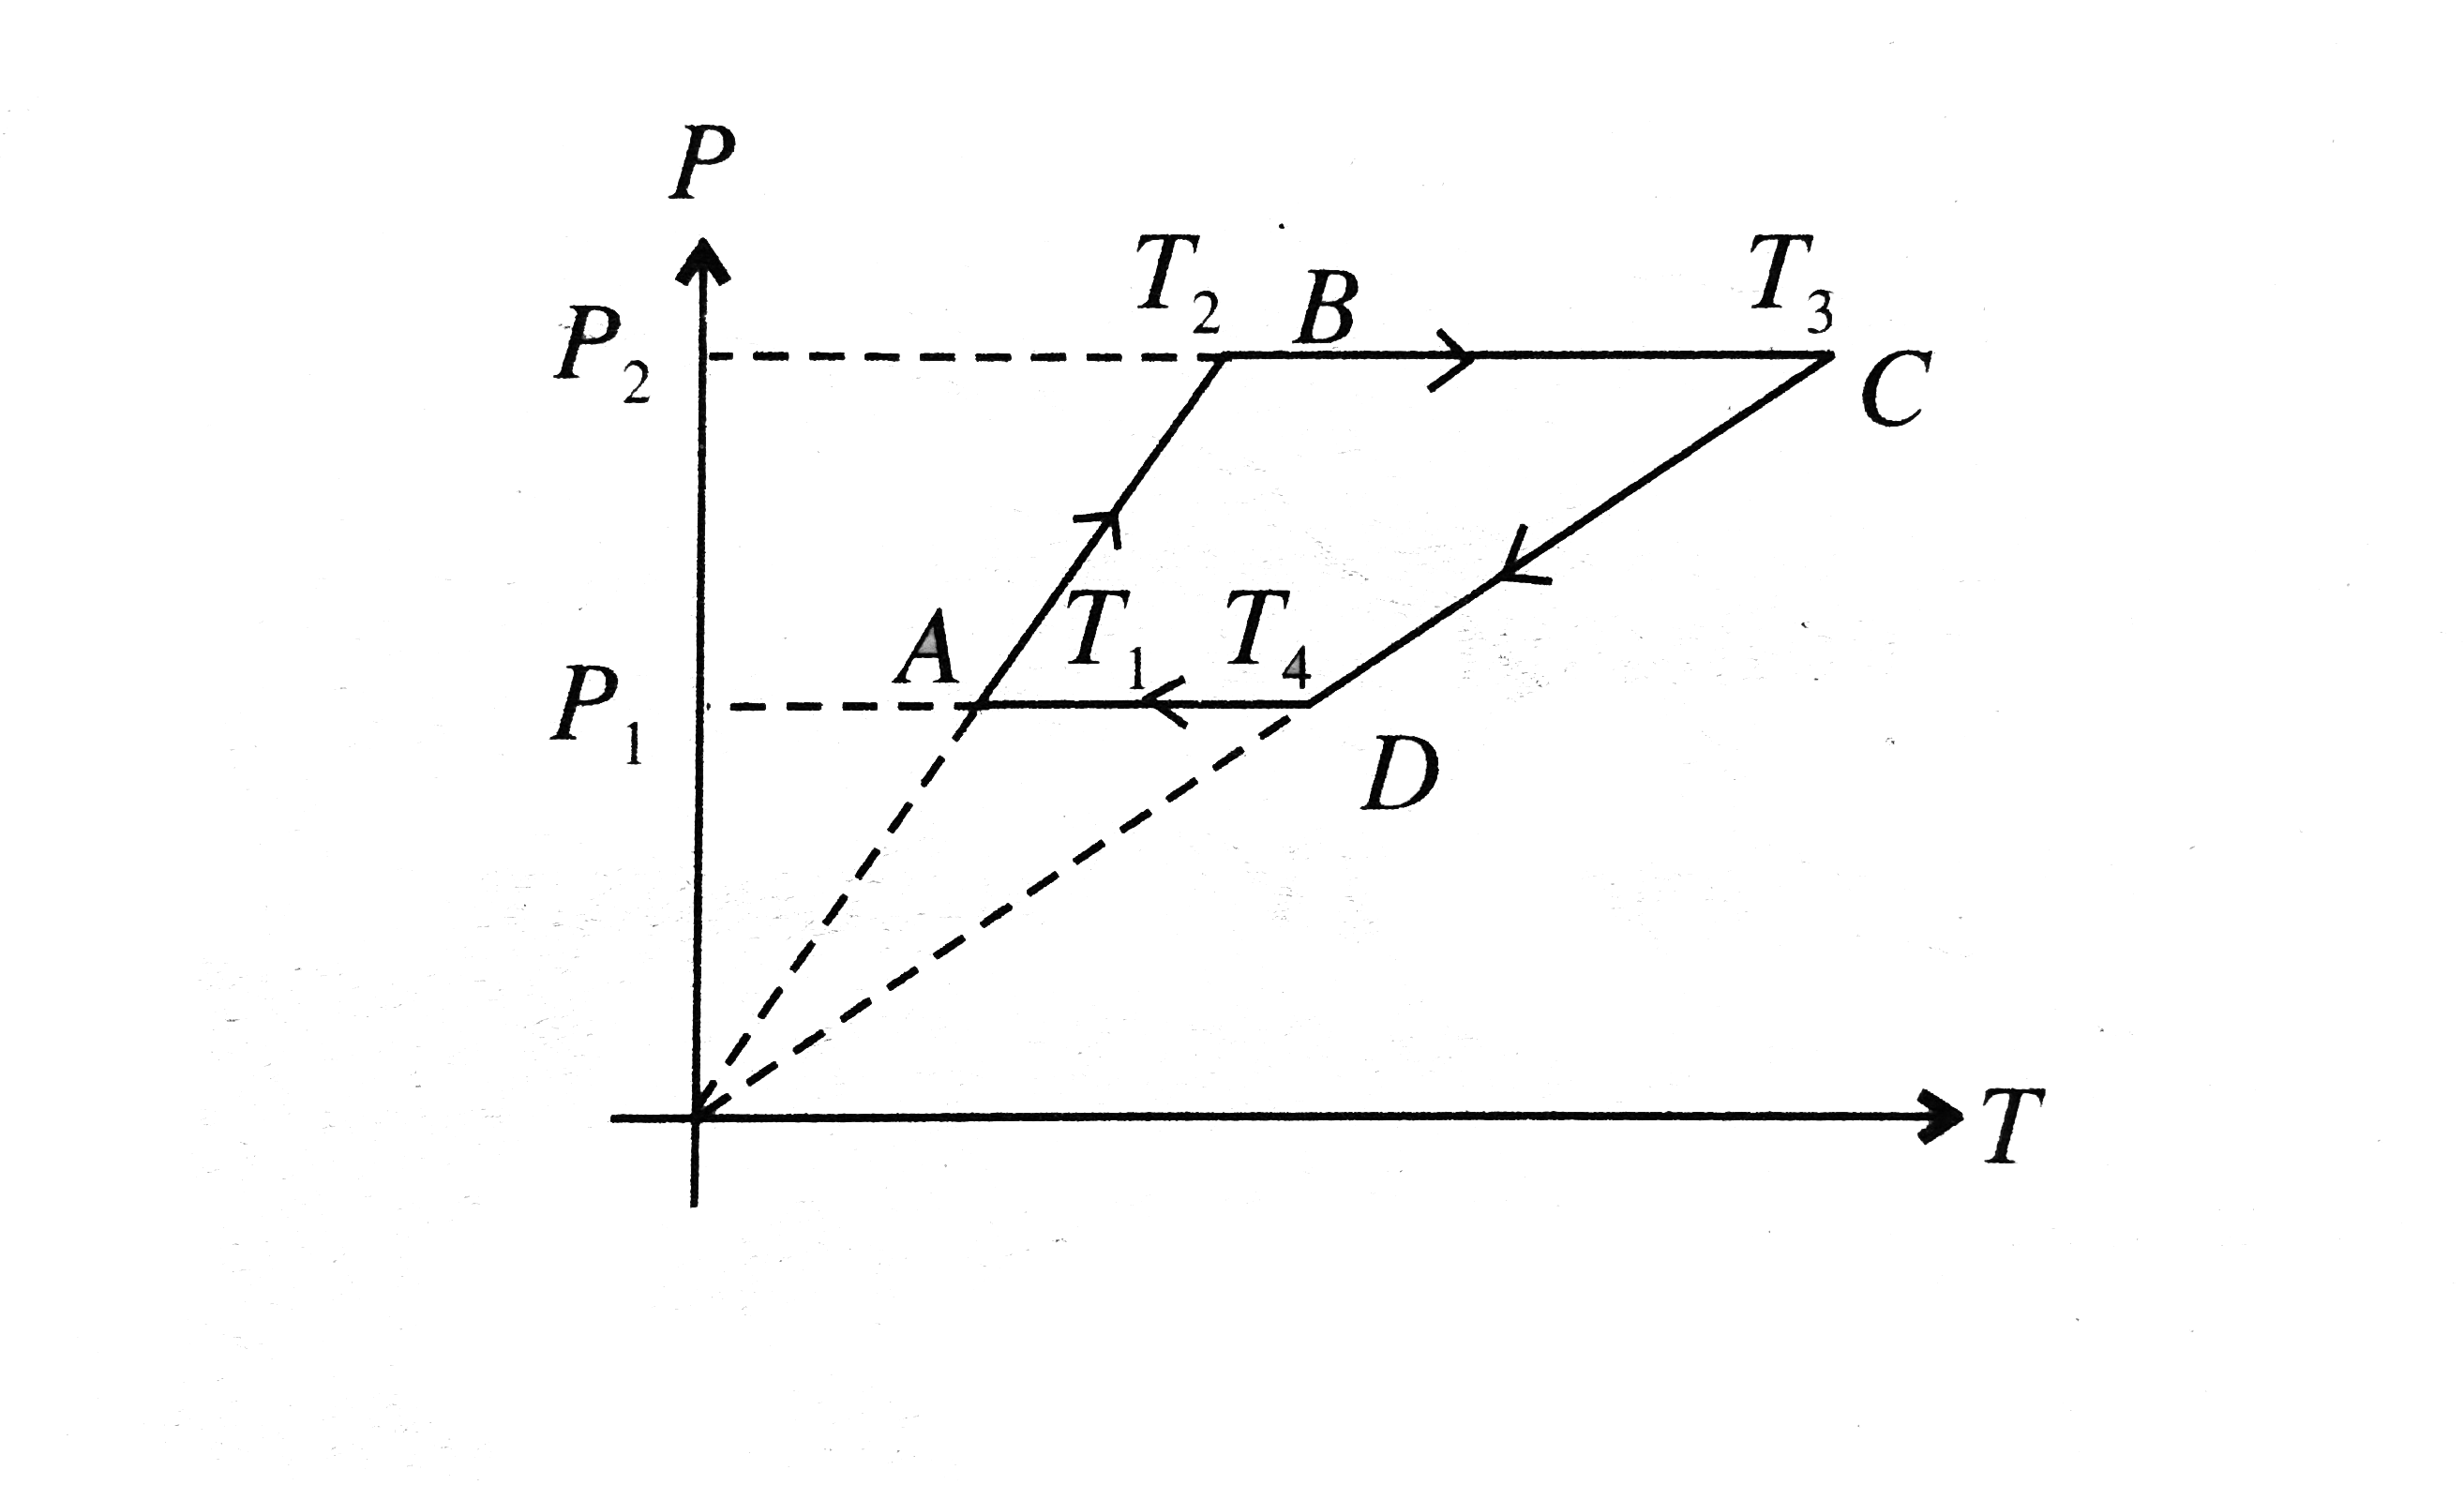
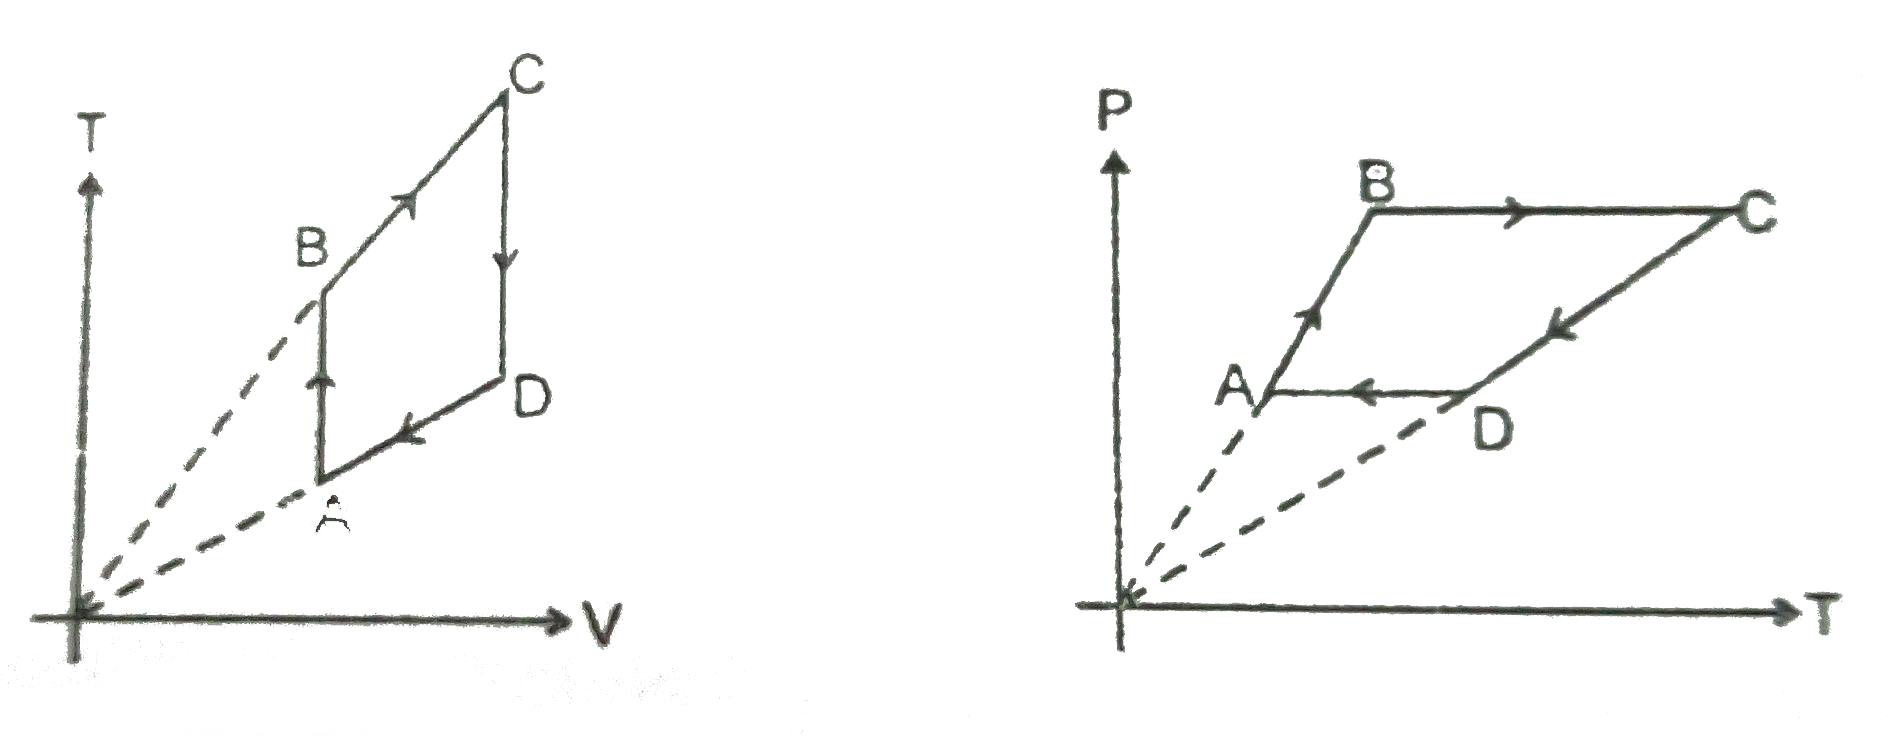
Find out the work done in the given graph. Also draw the corresponding T -V curve and P-T curve.
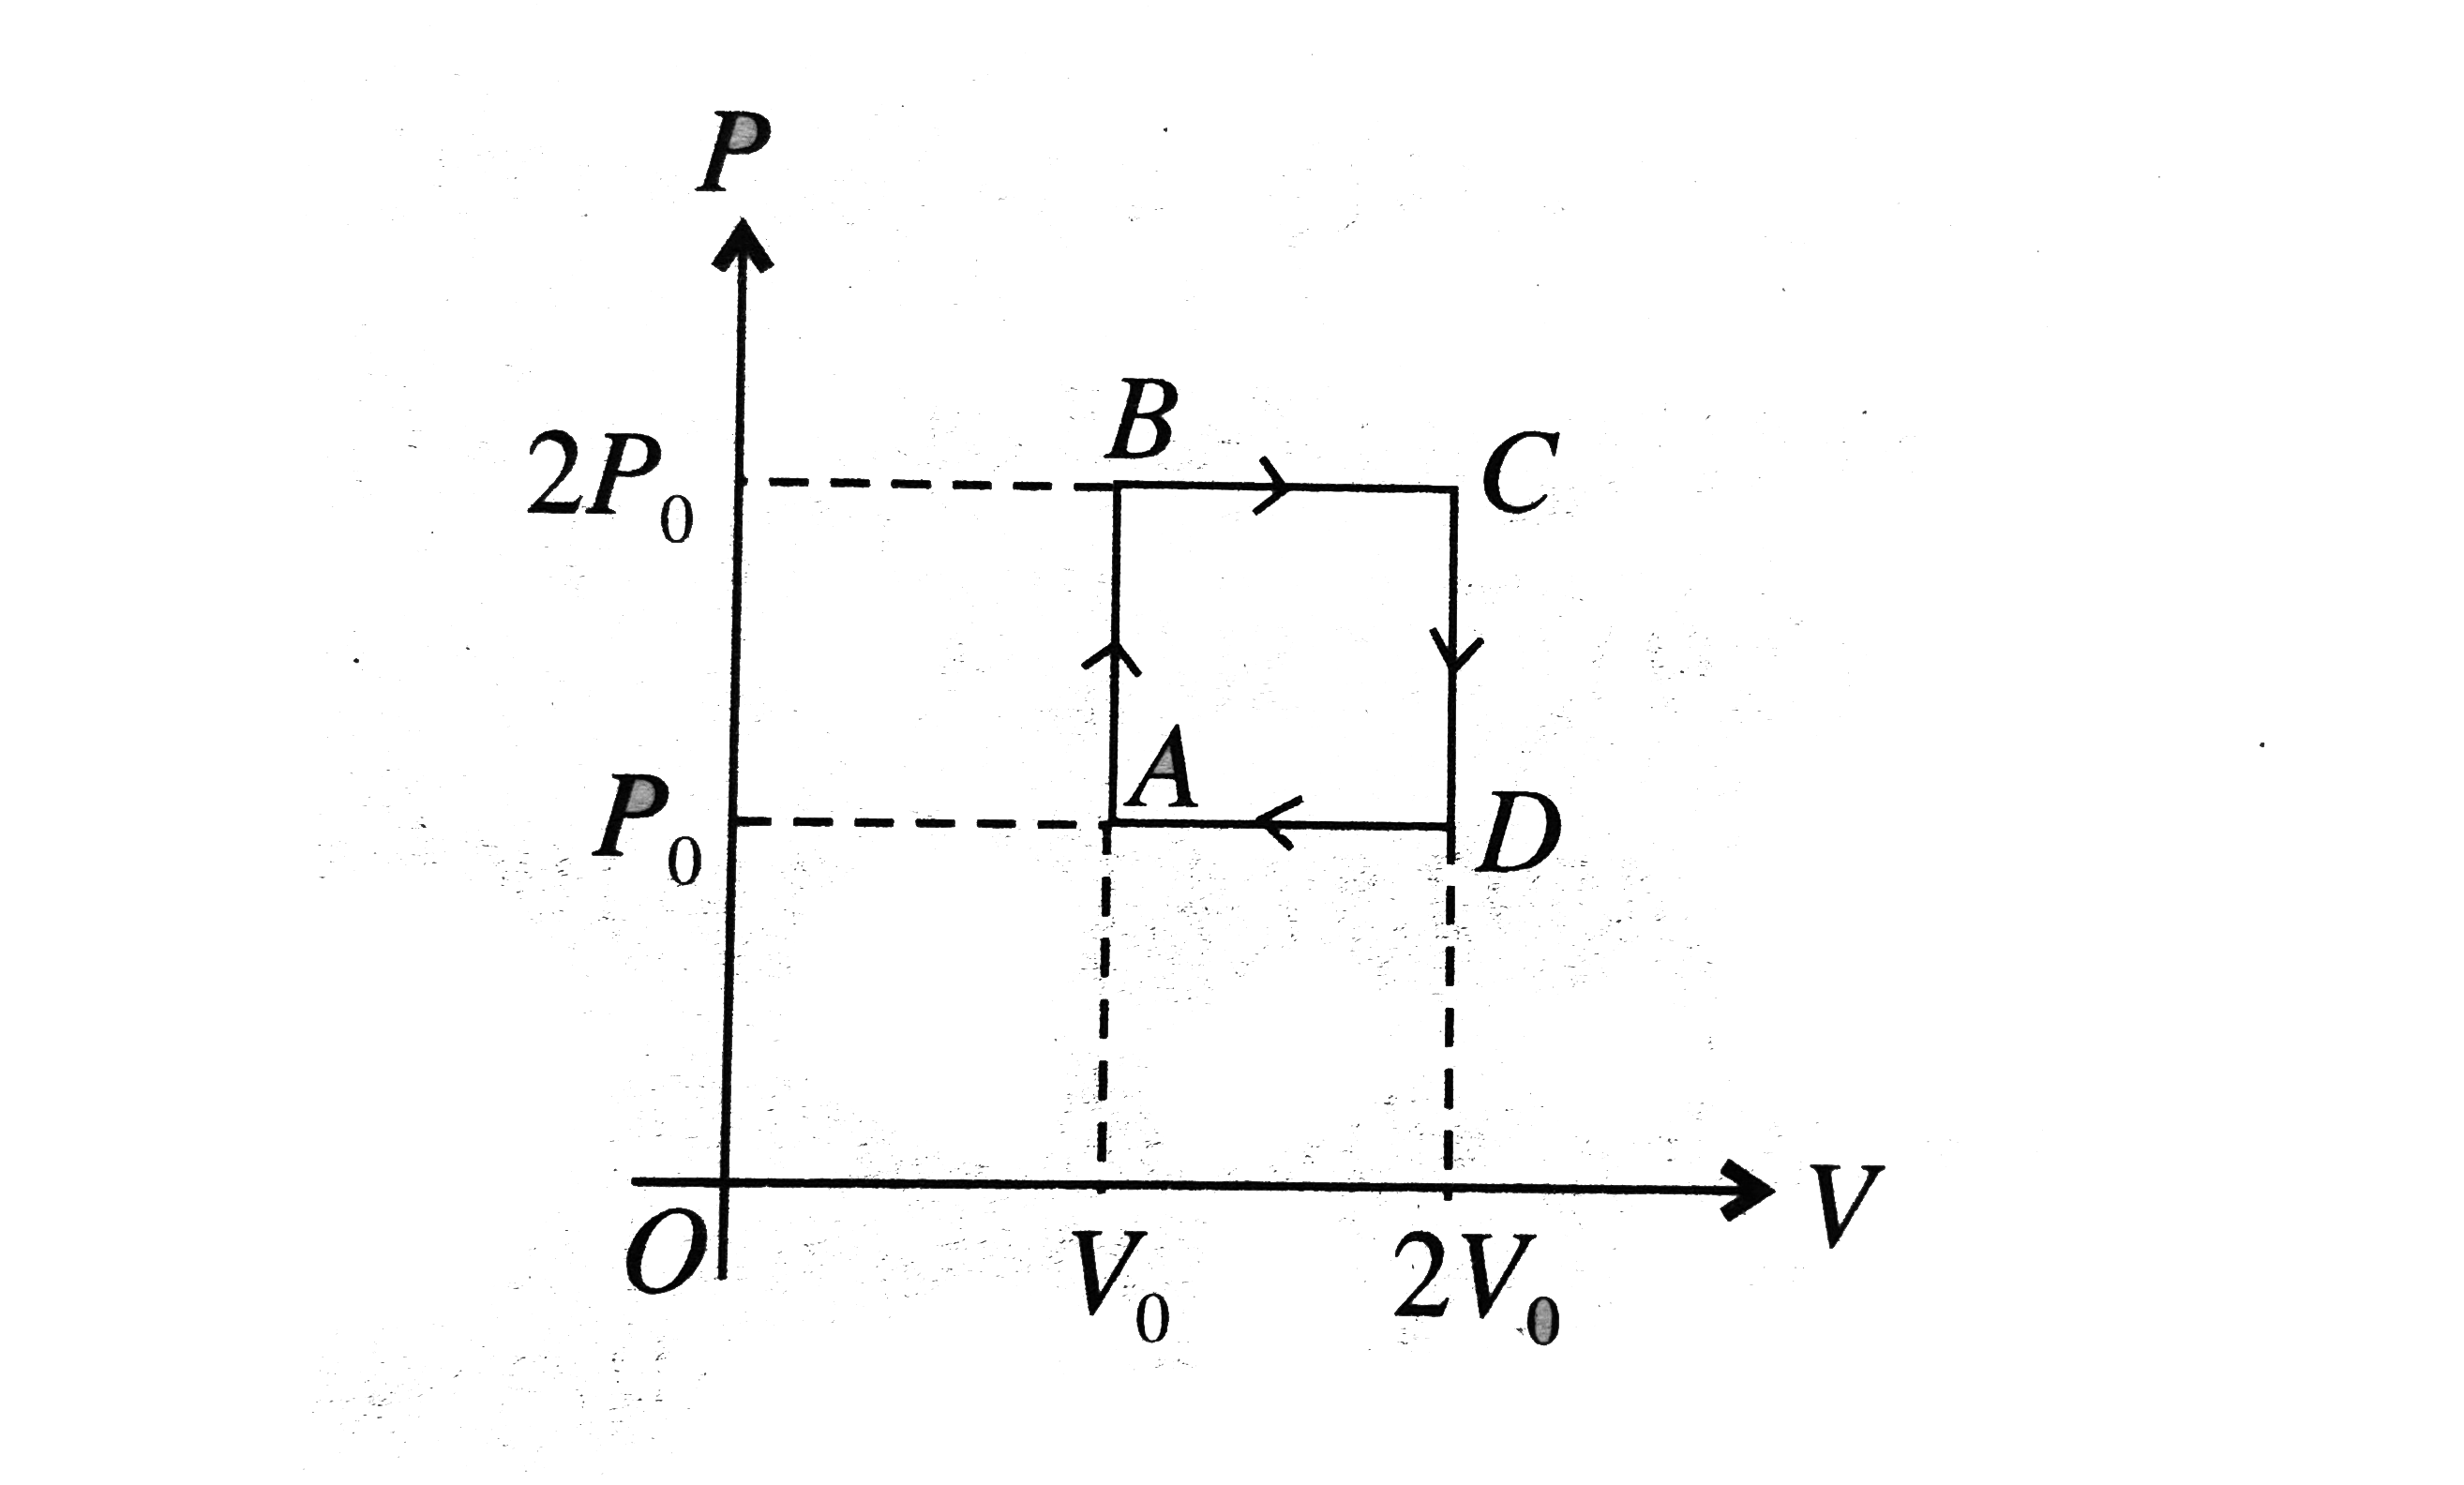
Solution in P−V curves area unde the cycle is equal to work done therefore work done by the gas is equal to P0V0.
Line AB and CD are isochoric line, line BC and DA are isobaric line.
∴ the T−V curve and P−T curve are drawn as shown.
Topper's Solved these Questions
- KTG & THERMODYNAMICSBOOK - RESONANCECHAPTER - KTG & THERMODYNAMICSEXERCISE - Solved problem
1 Videos
- KTG & THERMODYNAMICSBOOK - RESONANCECHAPTER - KTG & THERMODYNAMICSEXERCISE - Problem
3 Videos
- KTG & THERMODYNAMICSBOOK - RESONANCECHAPTER - KTG & THERMODYNAMICSEXERCISE - SUBJECTIVE QUESTIONS
27 Videos
- KINETIC THEORY OF GASES AND THERMODYNAMICSBOOK - RESONANCECHAPTER - KINETIC THEORY OF GASES AND THERMODYNAMICSEXERCISE - Exercise
64 Videos
- MAGNETIC FIELD AND FORCESBOOK - RESONANCECHAPTER - MAGNETIC FIELD AND FORCESEXERCISE - Exercise
65 Videos
Similar Questions
Knowledge Check
The x-t equation is given as x=2t+1. The corresponding v-t graph is
Aa straight line passing through originBa straight line not passing through originCa parabolaDNone of the aboveThe total work done in the following PV curve is
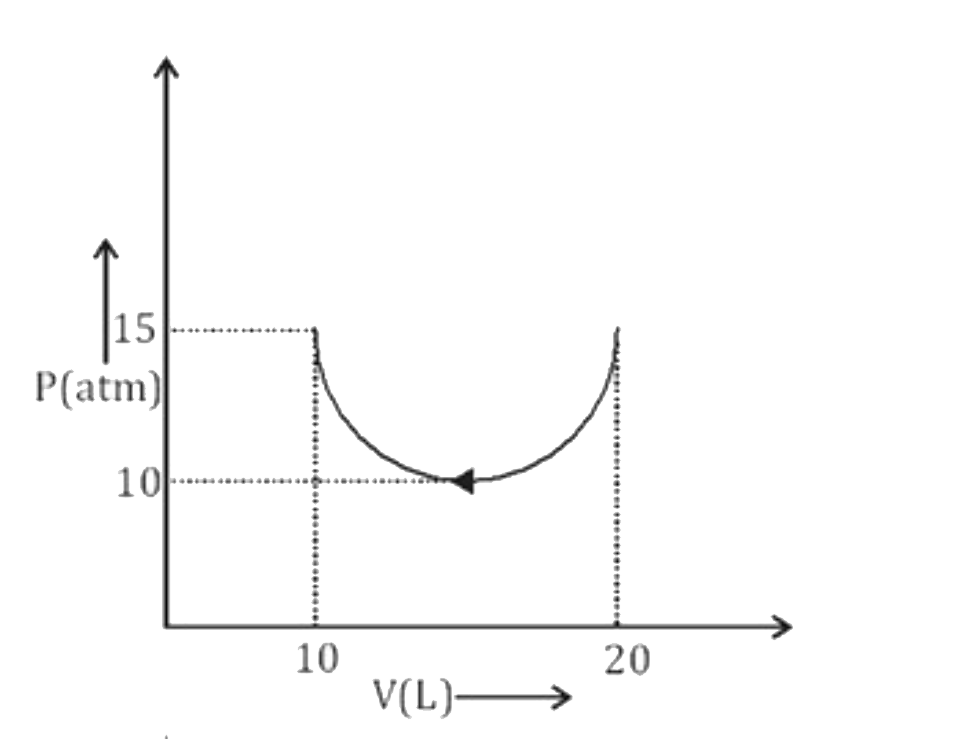 A(150−25π2)L - atmB(150+25π2)L - atmC(−25π2)L - atmD150 L - atm
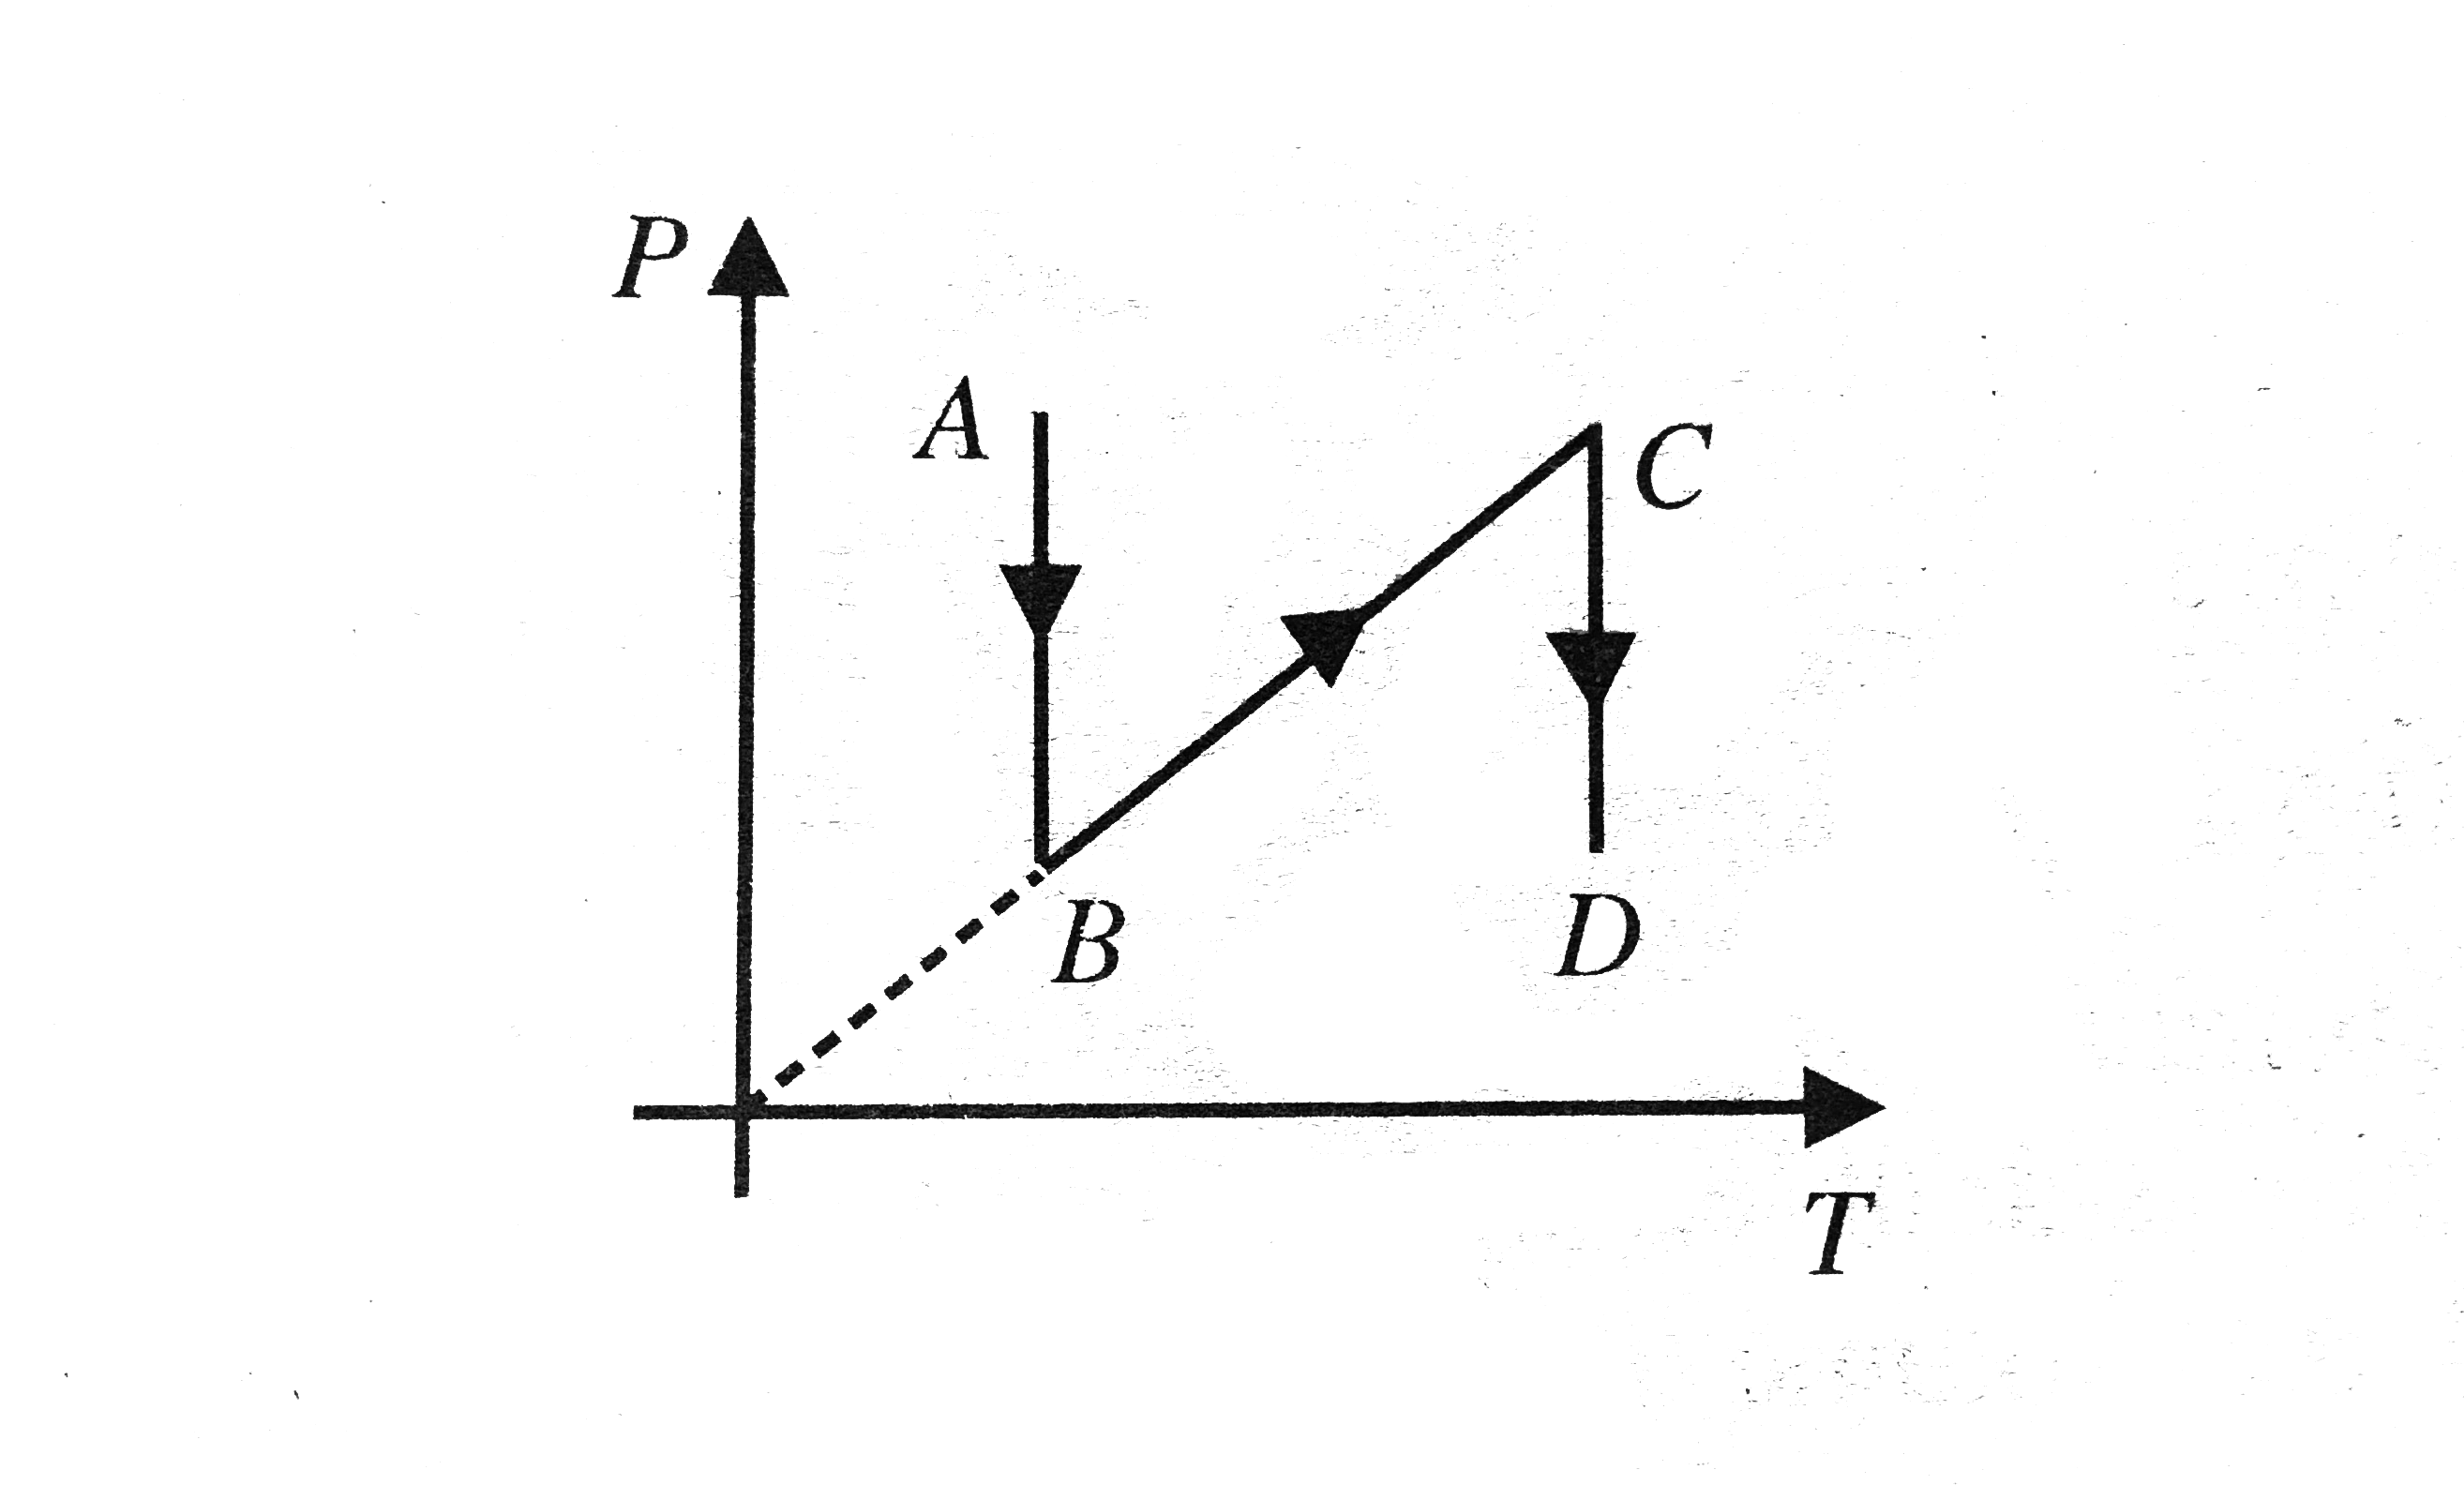
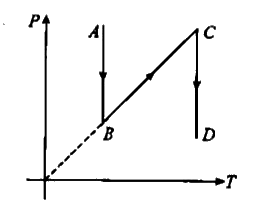
P−T diagram is shown in Fig. Choose the corresponding V−T diagram.
 A
A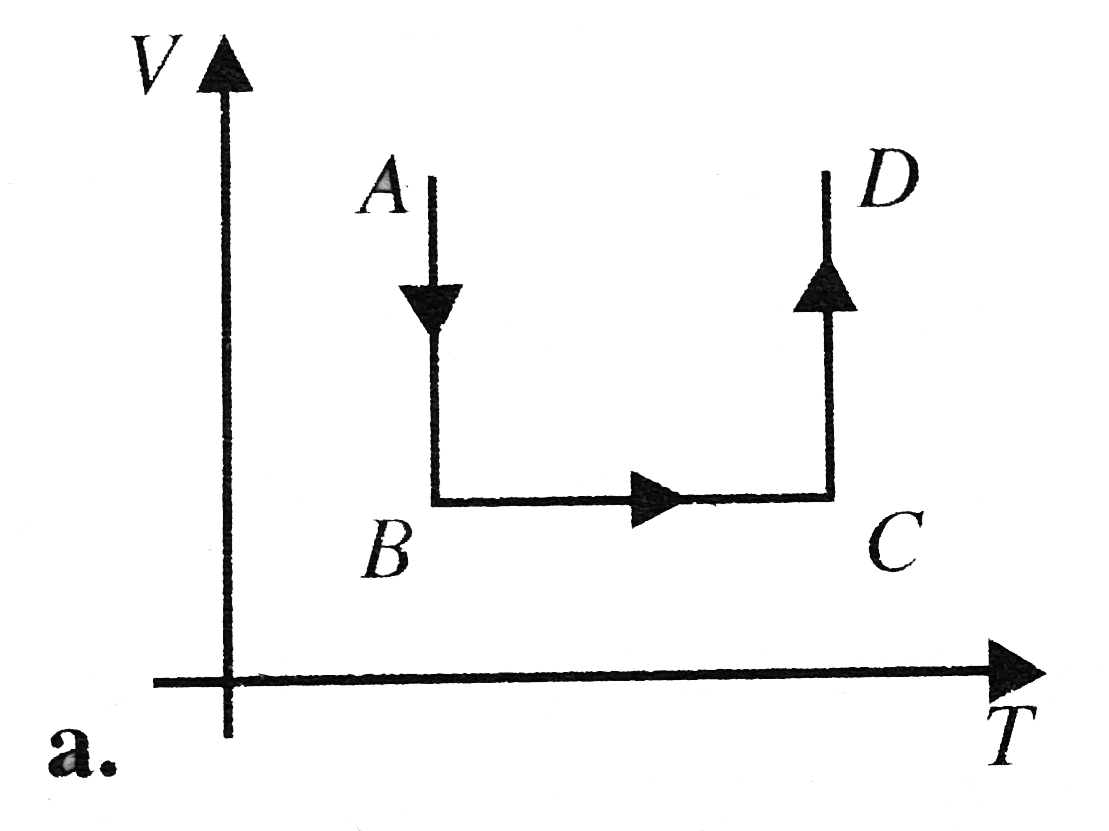 B
B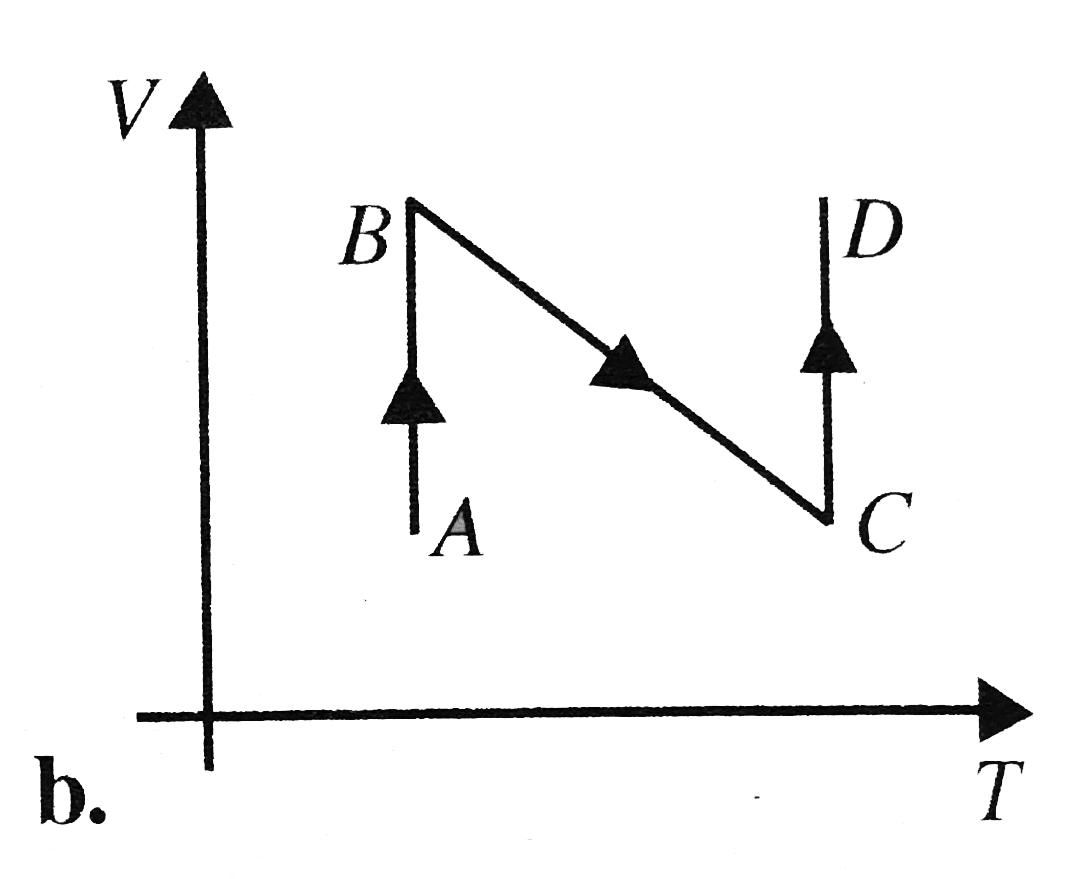 C
C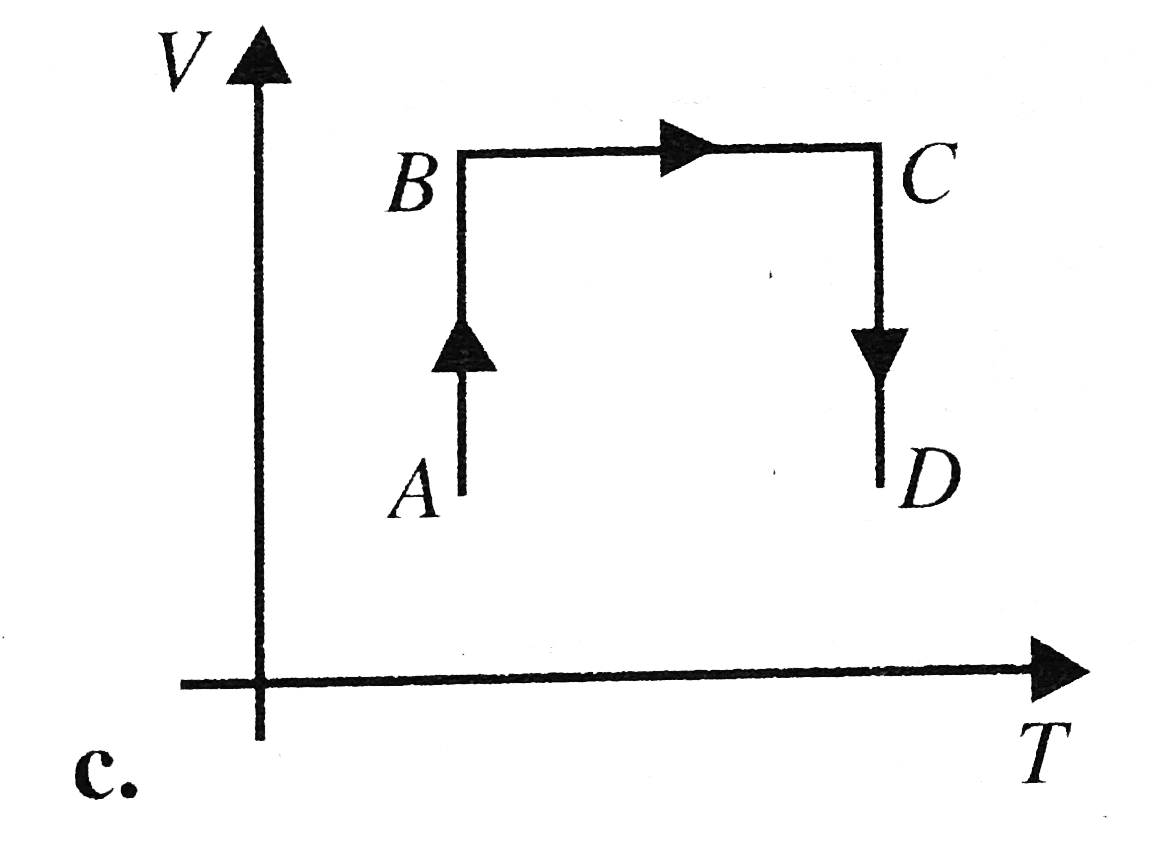 D
D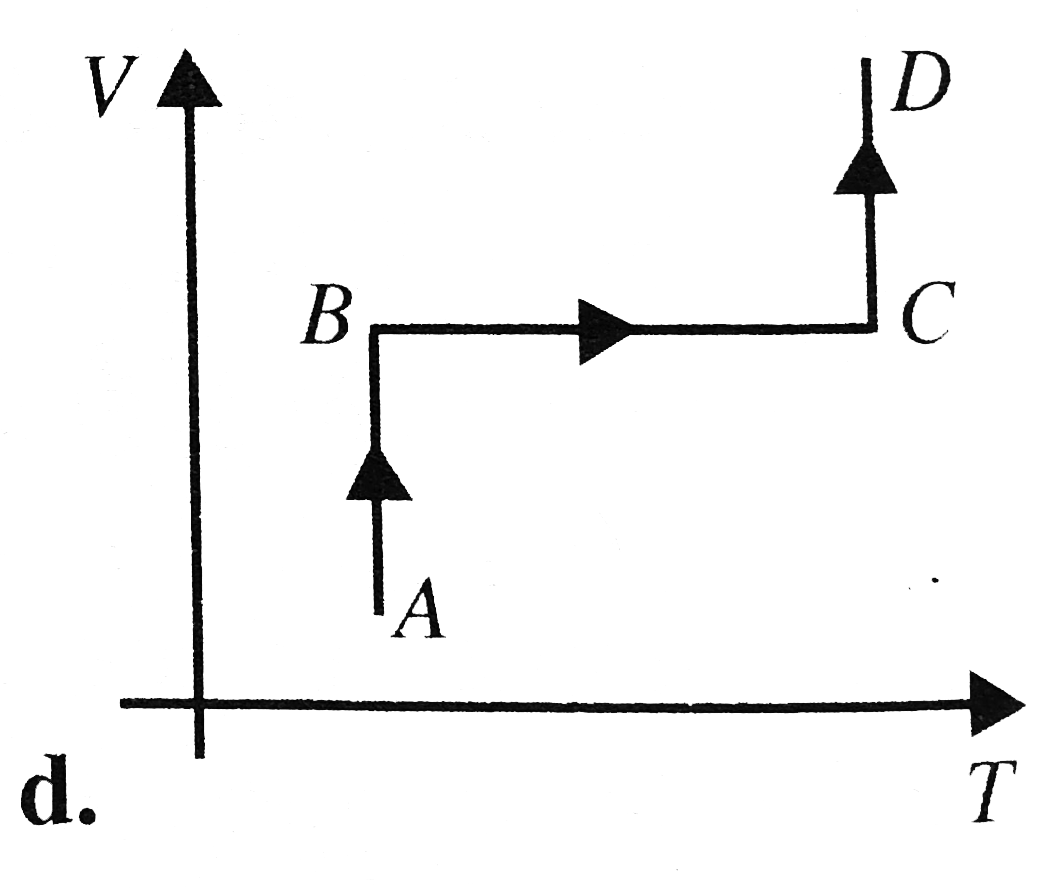
P-T diagram is shown below then choose the corresponding V-T diagram
View Solution2.The velocity-time (v-t) graph for a particle in straight line motion is given below the corresponding acceleration time graph will be?
View SolutionFind the area of the region bounded by the curve x=at2 and y=2at between the ordinates corresponding to t = 1 and t = 2.
View Solution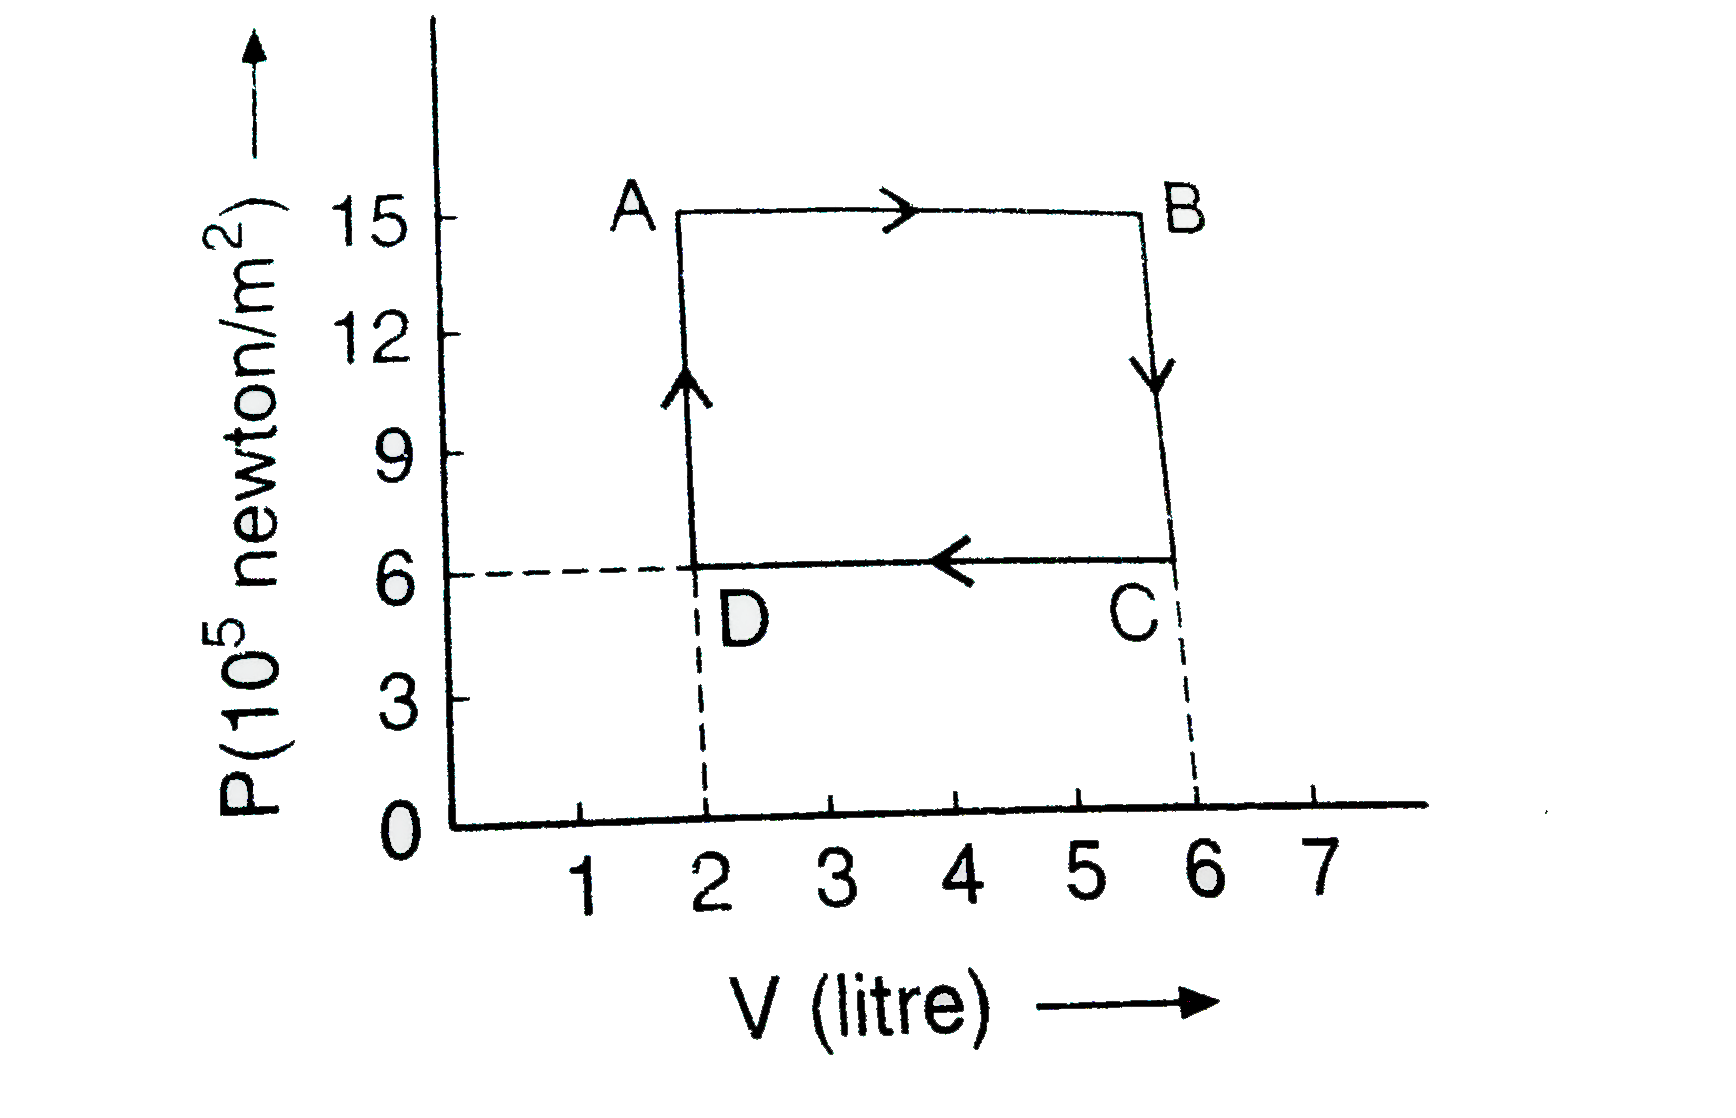
In the adjoining diagram, the p-V graph of an ideal gas is shown. Find out from the graph (i) work done in taking the gas
From the state A→B (ii) Work done in taking the gas from B→C (iii) Work done in a complete cycle. (1 litre=10−3m3)
View SolutionWhen a sample of ideal gas is changed from an initial state to a final state, various curves can be plotted for the process like P-V curve, V-T curve,P-T curve etc.
For example, P-V curve for a fixed amount of an ideal gas at constant temperature is a rectangular hyperbola, V-T curve for a fixed amount of an ideal gas at constant volume is again a straight line. However, the shapes may vary if the constant parameters are also changed.
Now, answer the following questions :
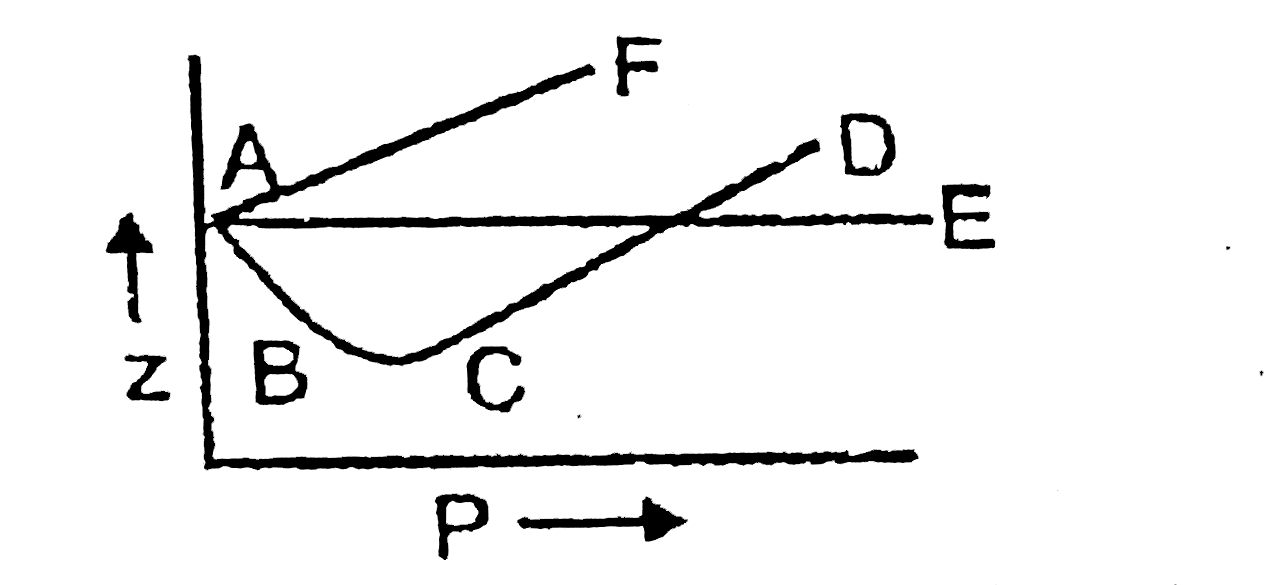
The figure shows the effect of pressure on the compressibility factor, Z of a gas :
View Solution

