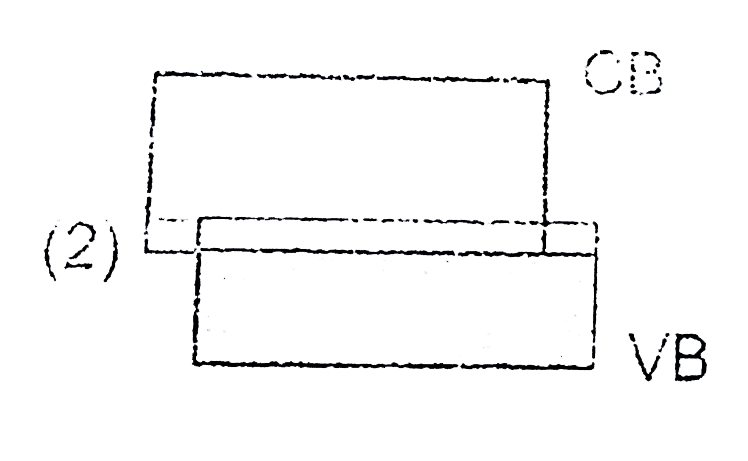
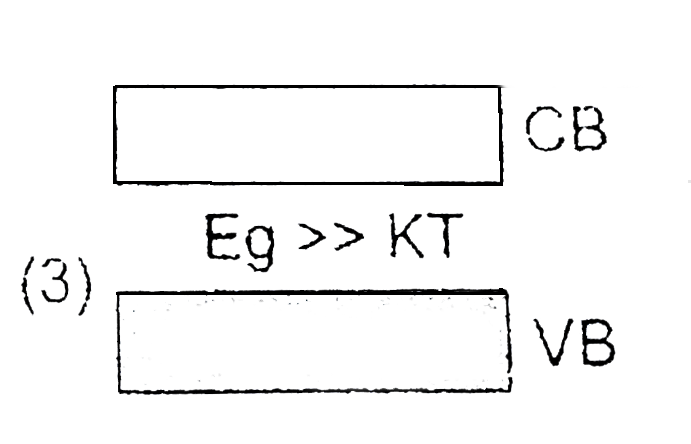
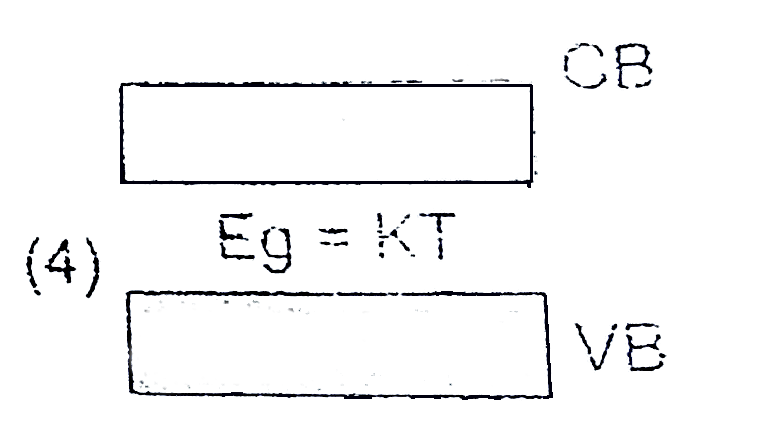
Which of the energy band diagrams shown in the figure corresponds to that of a semiconductor?
A

B
C
D
Video Solution
Text Solution
The correct Answer is:D
In semiconductors the forbidden energy gap between the valence band and conduction band is very small almost equal to kT. Moreover, valence bank is completely filled where as conduction band is empty.
|
Topper's Solved these Questions
- SEMICONDUCTORSBOOK - RESONANCECHAPTER - SEMICONDUCTORSEXERCISE - Exercise
100 Videos
- SEMICONDUCTORSBOOK - RESONANCECHAPTER - SEMICONDUCTORSEXERCISE - Exercise 2
16 Videos
- REVISION DPPBOOK - RESONANCECHAPTER - REVISION DPPEXERCISE - All Questions
444 Videos
- SIMPLE HARMONIC MOTION BOOK - RESONANCECHAPTER - SIMPLE HARMONIC MOTION EXERCISE - Advanced Level Problems
13 Videos
Similar Questions
Knowledge Check
Which of the following energy band diagrams shows the N-type semiconductor?
A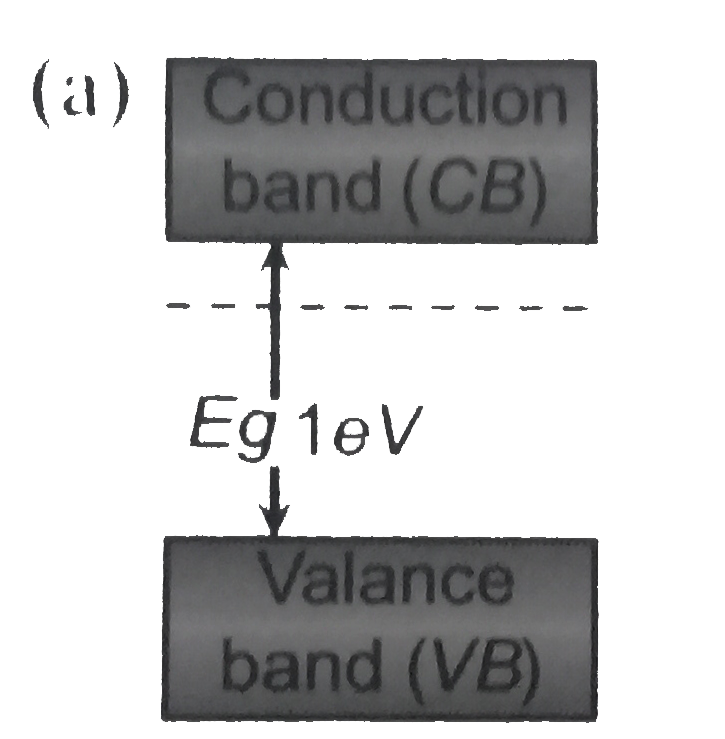 B
B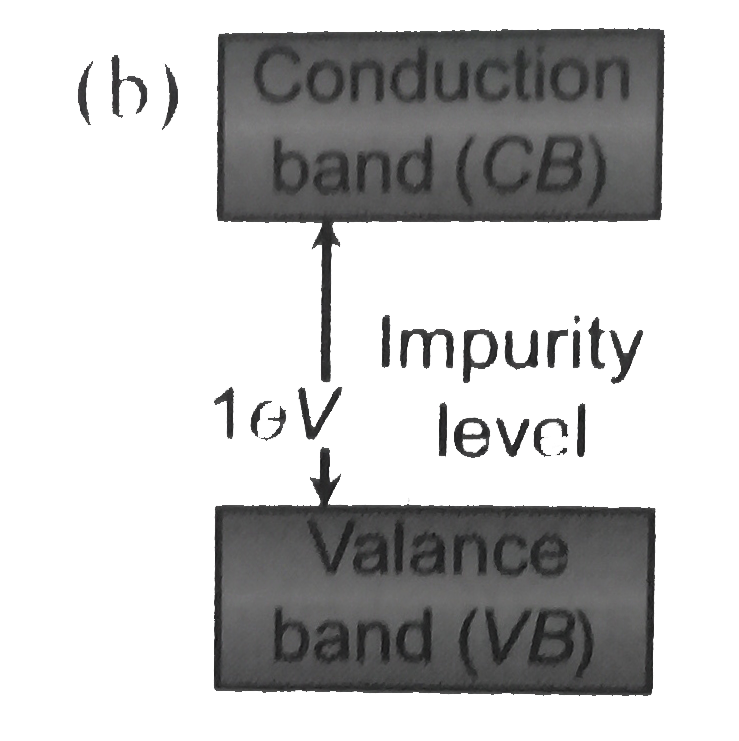 C
C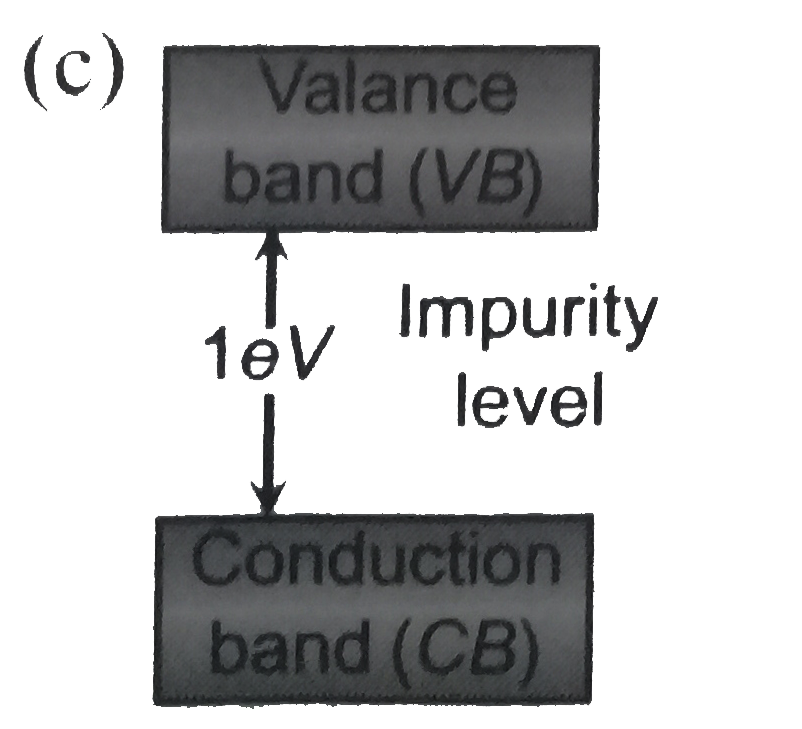 D
D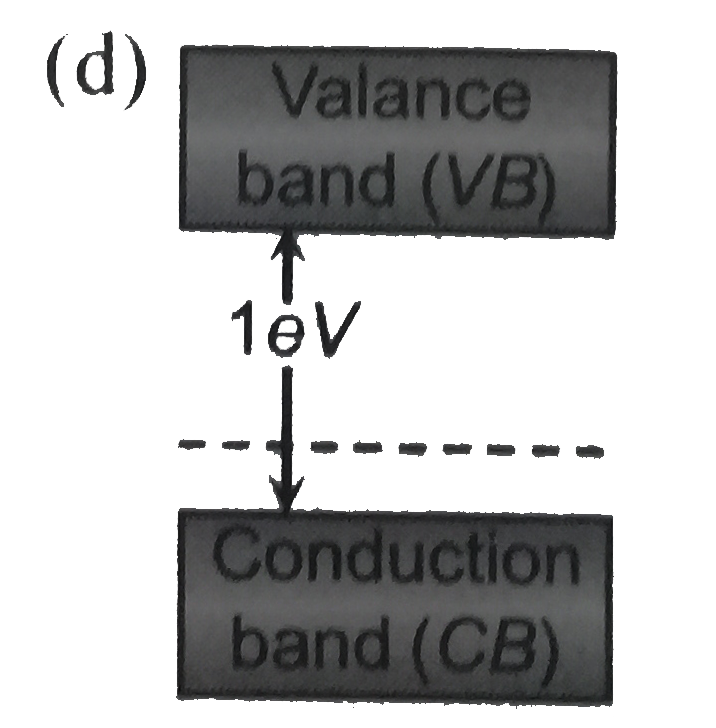
Which of the diagram shown in figures respresents variation of total mechanical energy of a pendulam oscillation in air as function of time?
A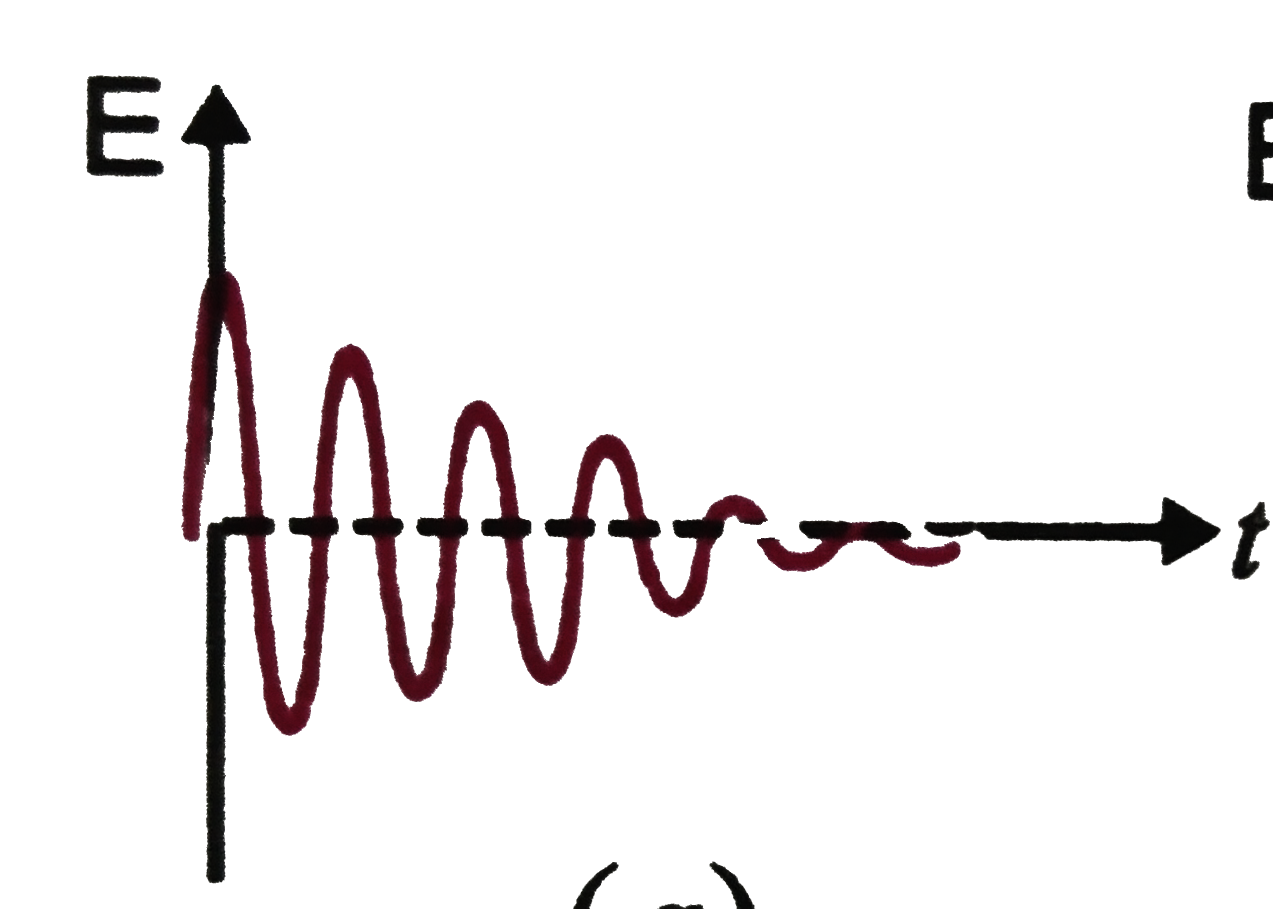 B
B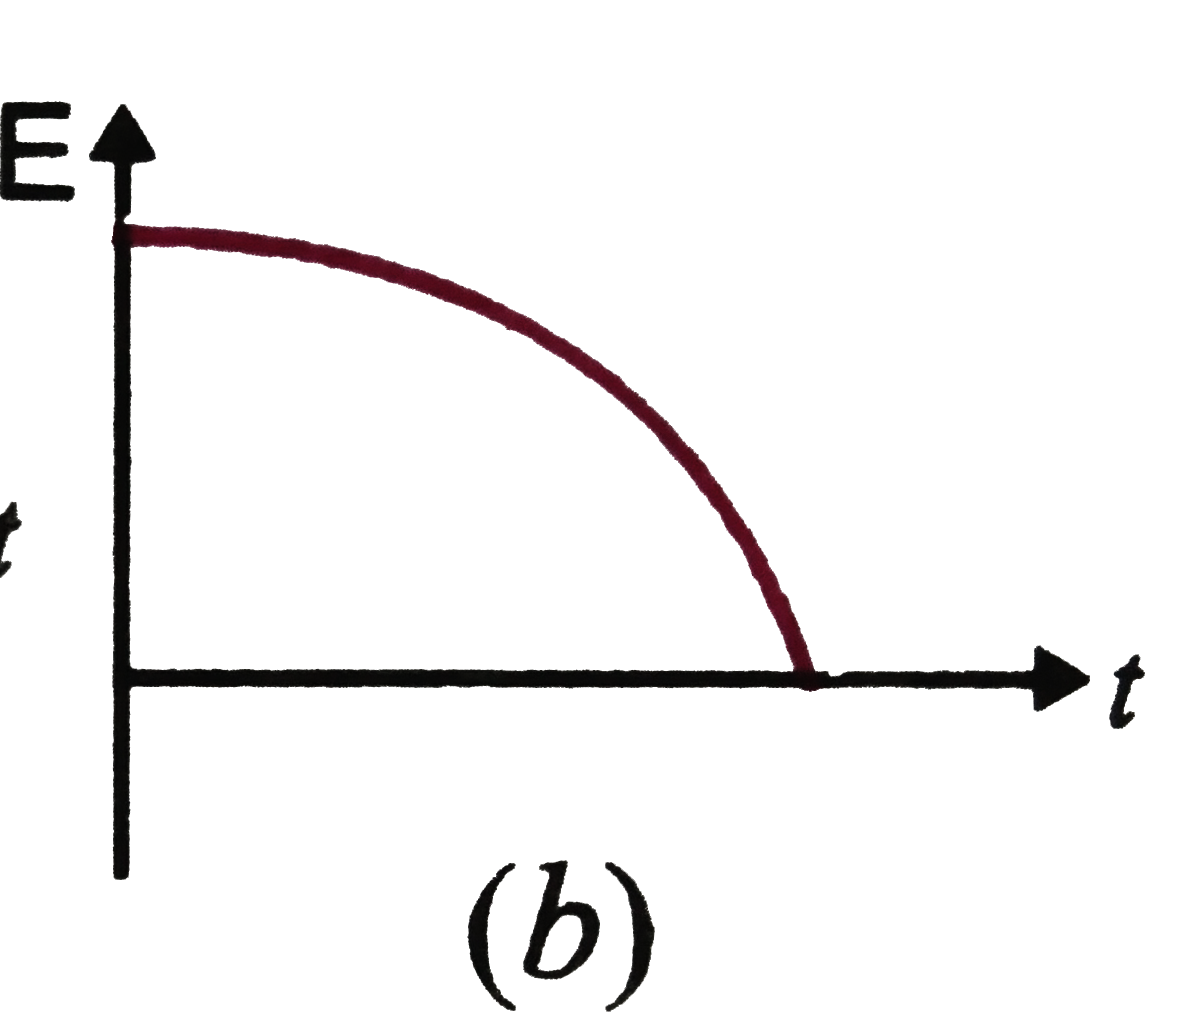 C
C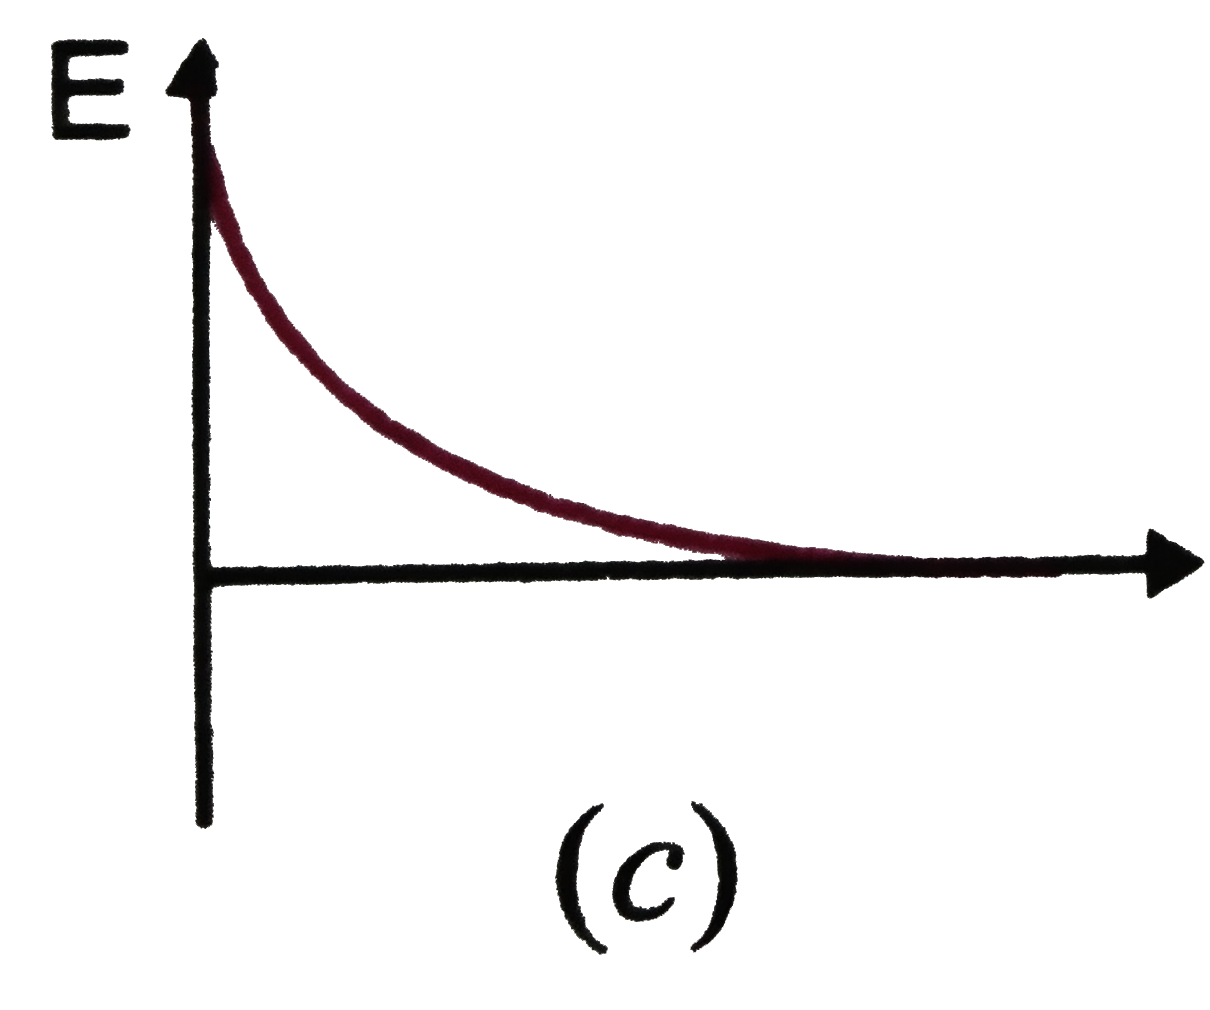 D
D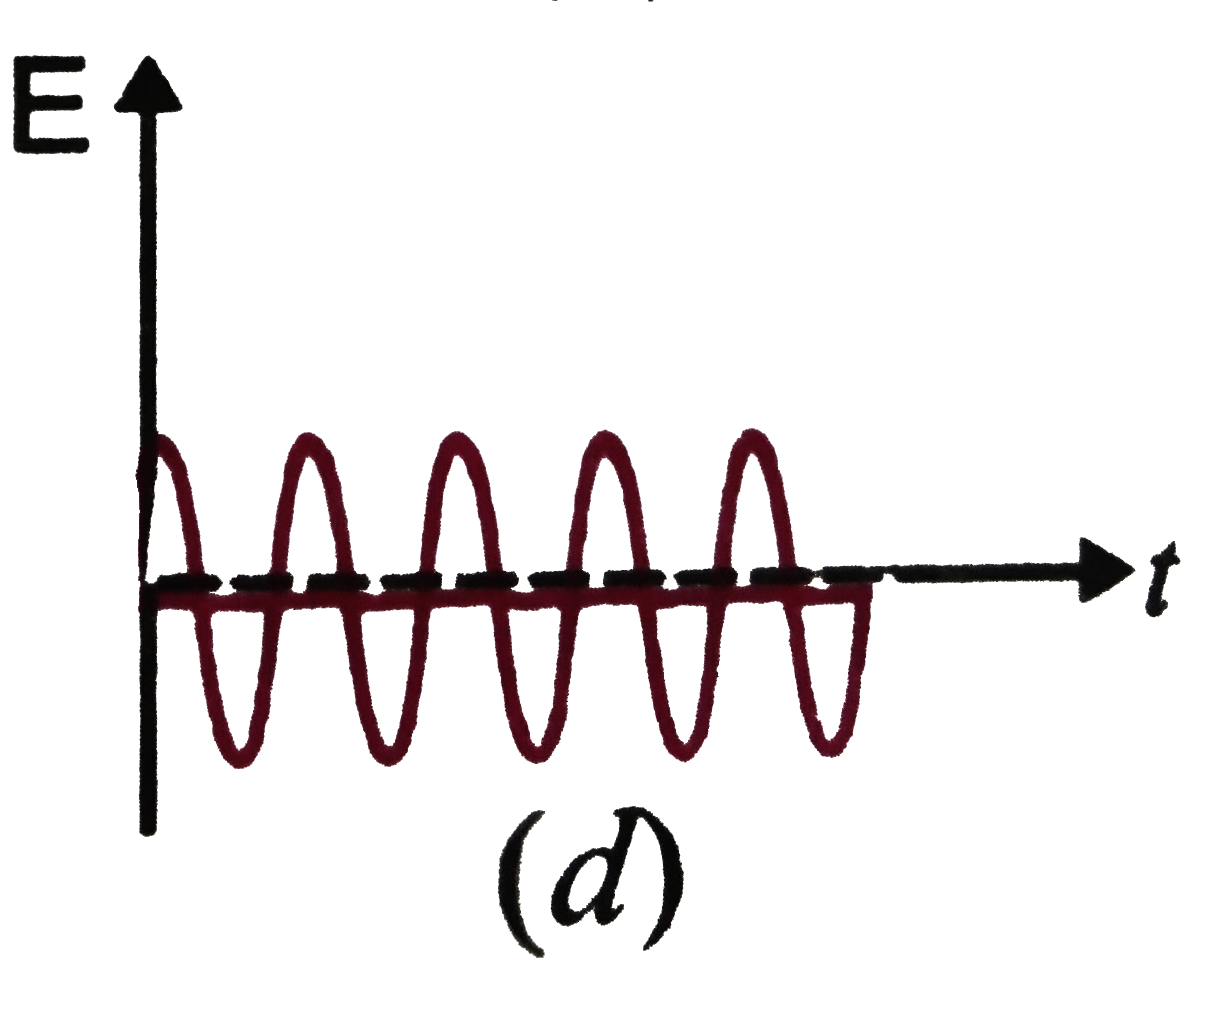
Which of the diagram shown in figures respresents variation of total mechanical energy of a pendulam oscillation in air as function of time?
A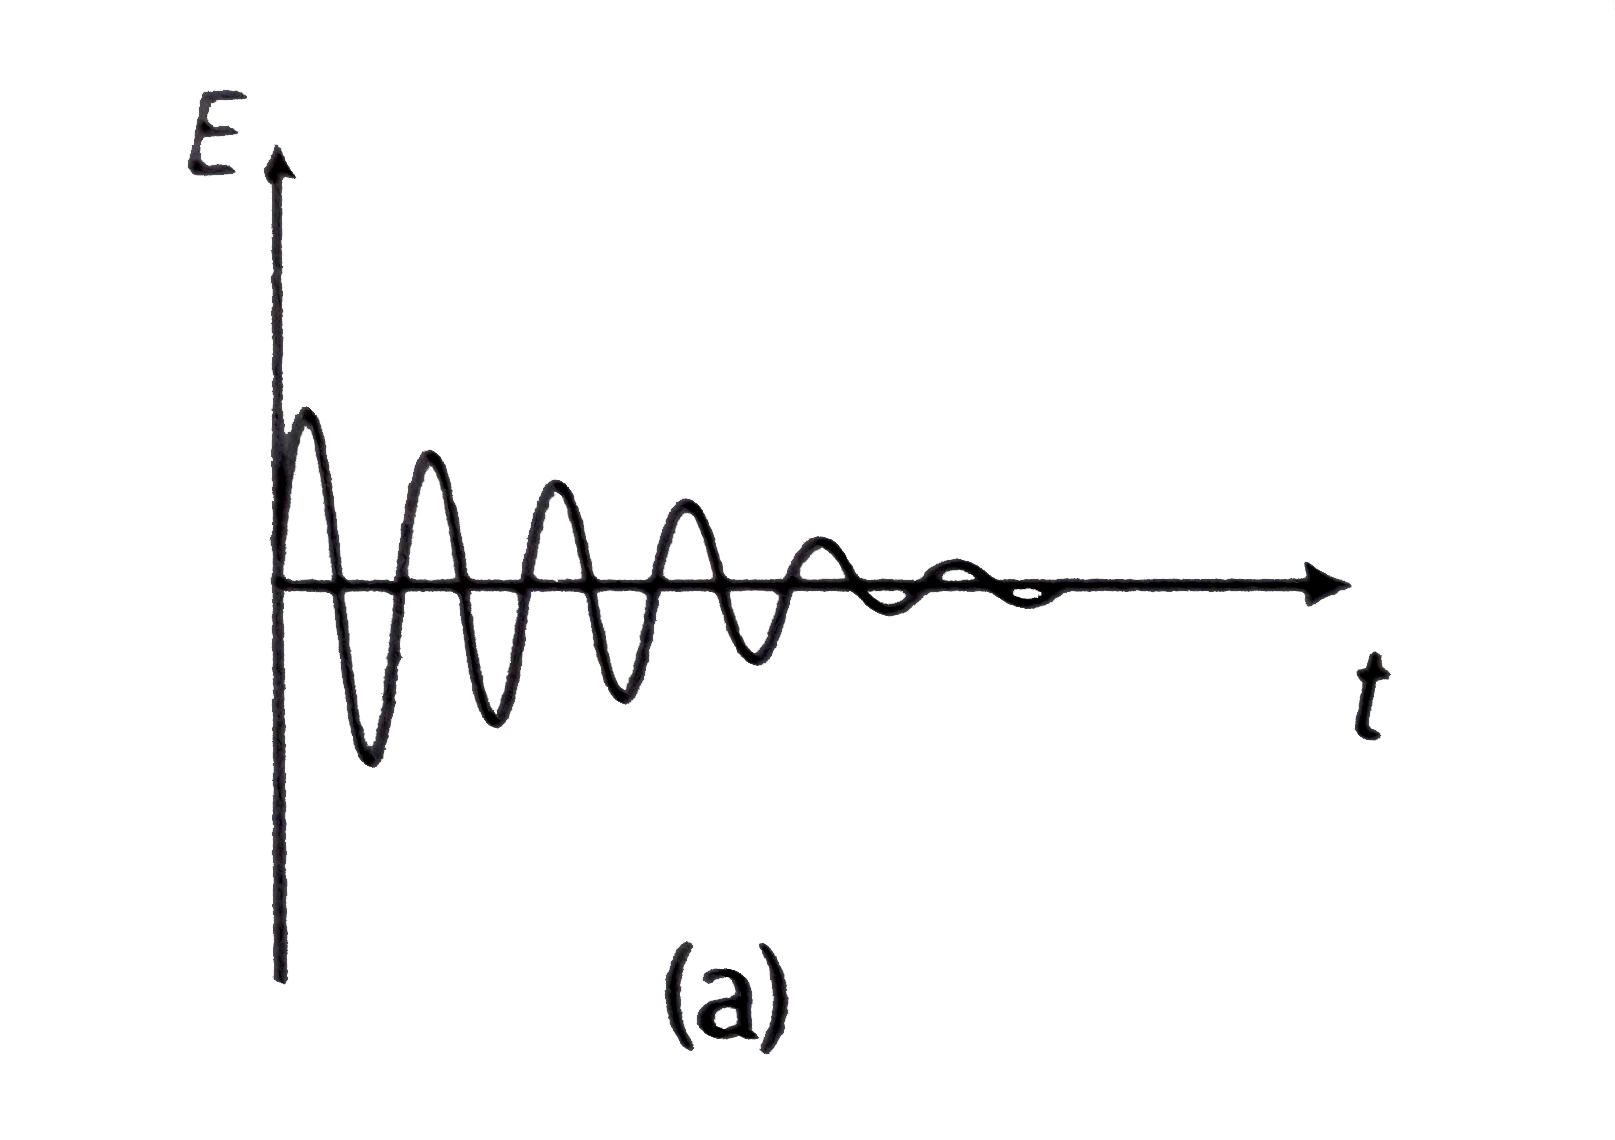 B
B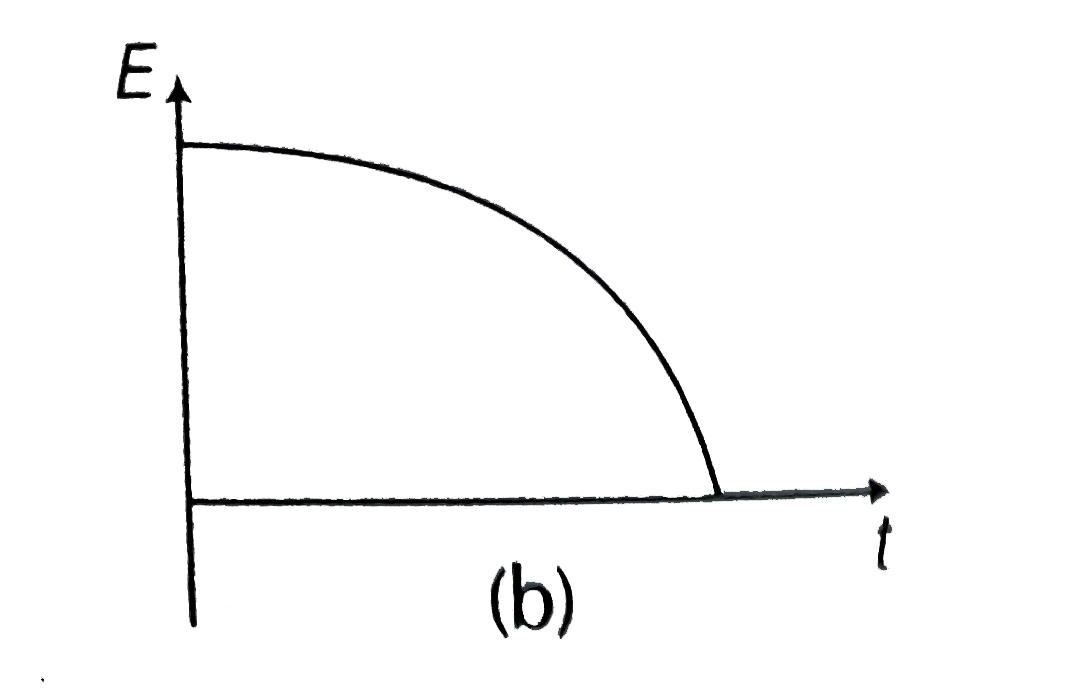 C
C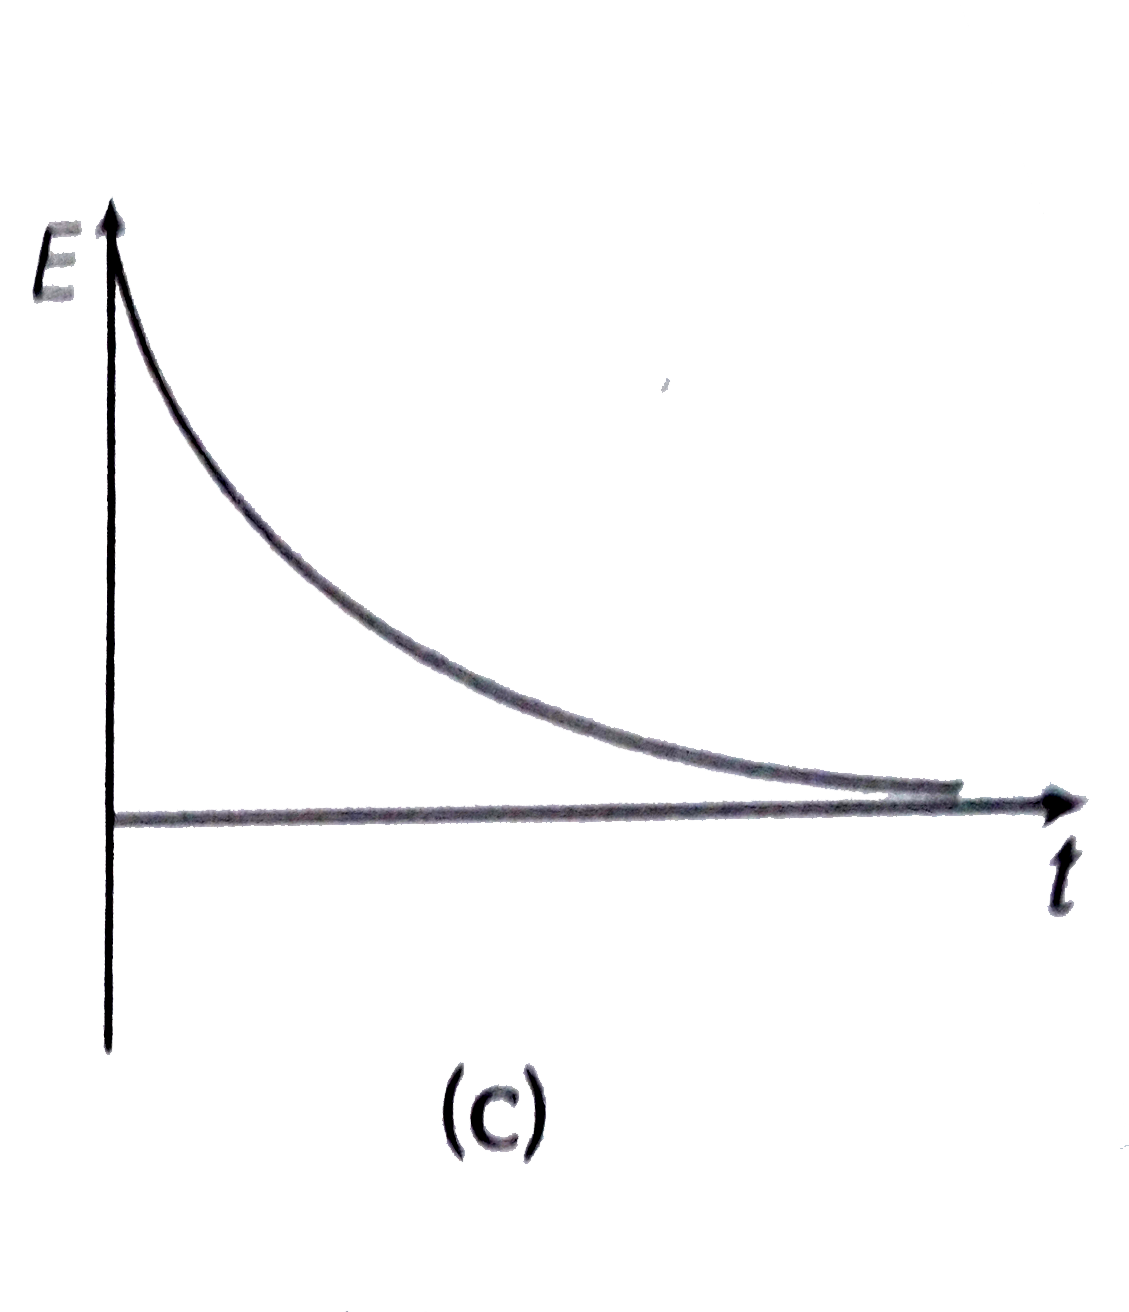 D
D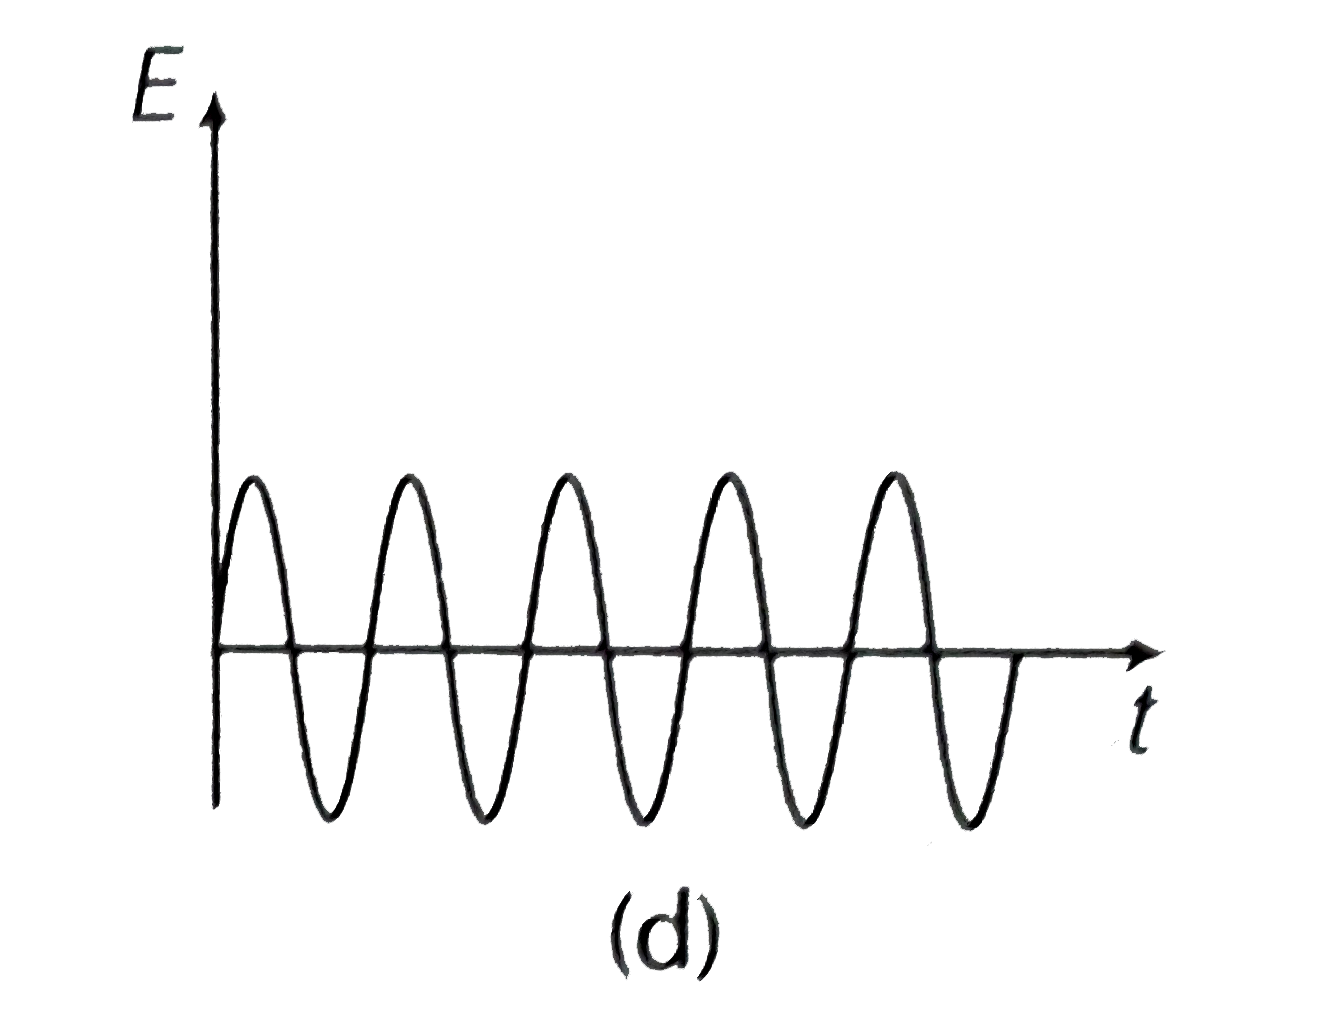
Draw the energy band diagram of a p-type semiconductor. Deduce an expression for the conductivity of a p-type semiconductor.
View SolutionWith a neat labelled energy band diagram, explain the working of an LED.
View SolutionP−T diagram is shown in Fig. Choose the corresponding V−T diagram.
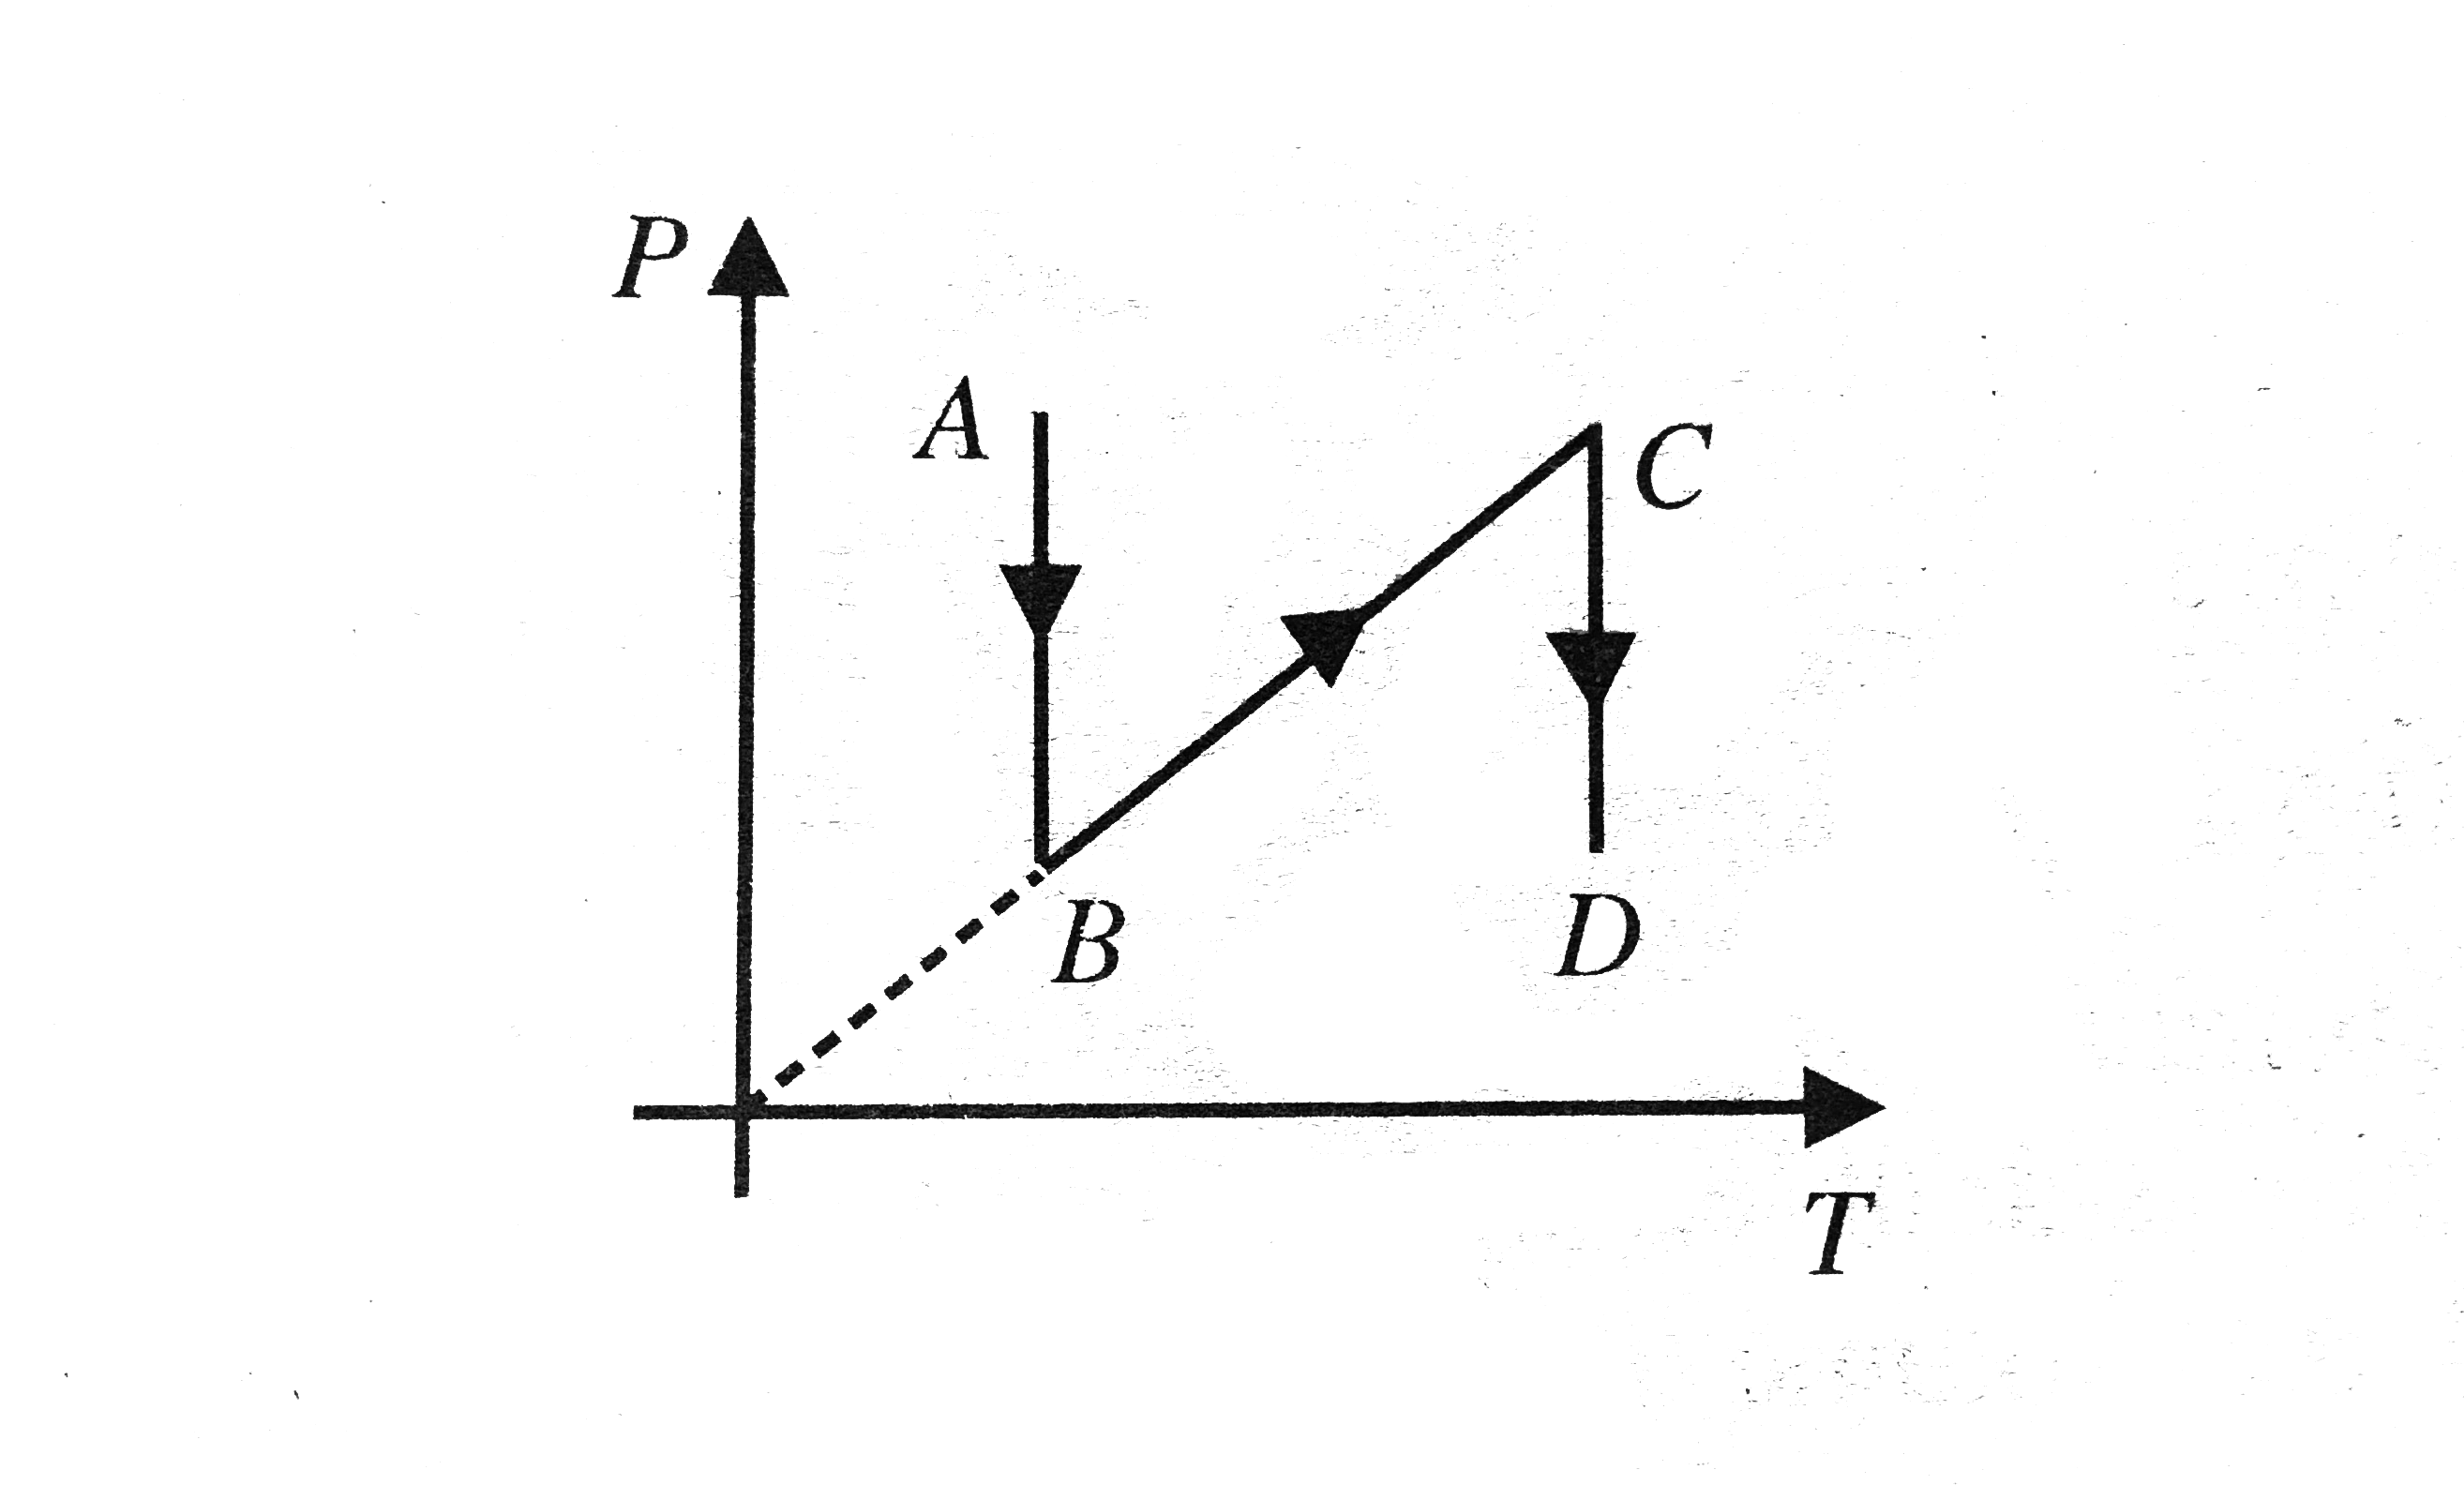
View SolutionWhich of the diagrams shown in figure. Most closely shows the variation in kinetic energy of the earth as it moves once around the sun in its elliptical orbit ?
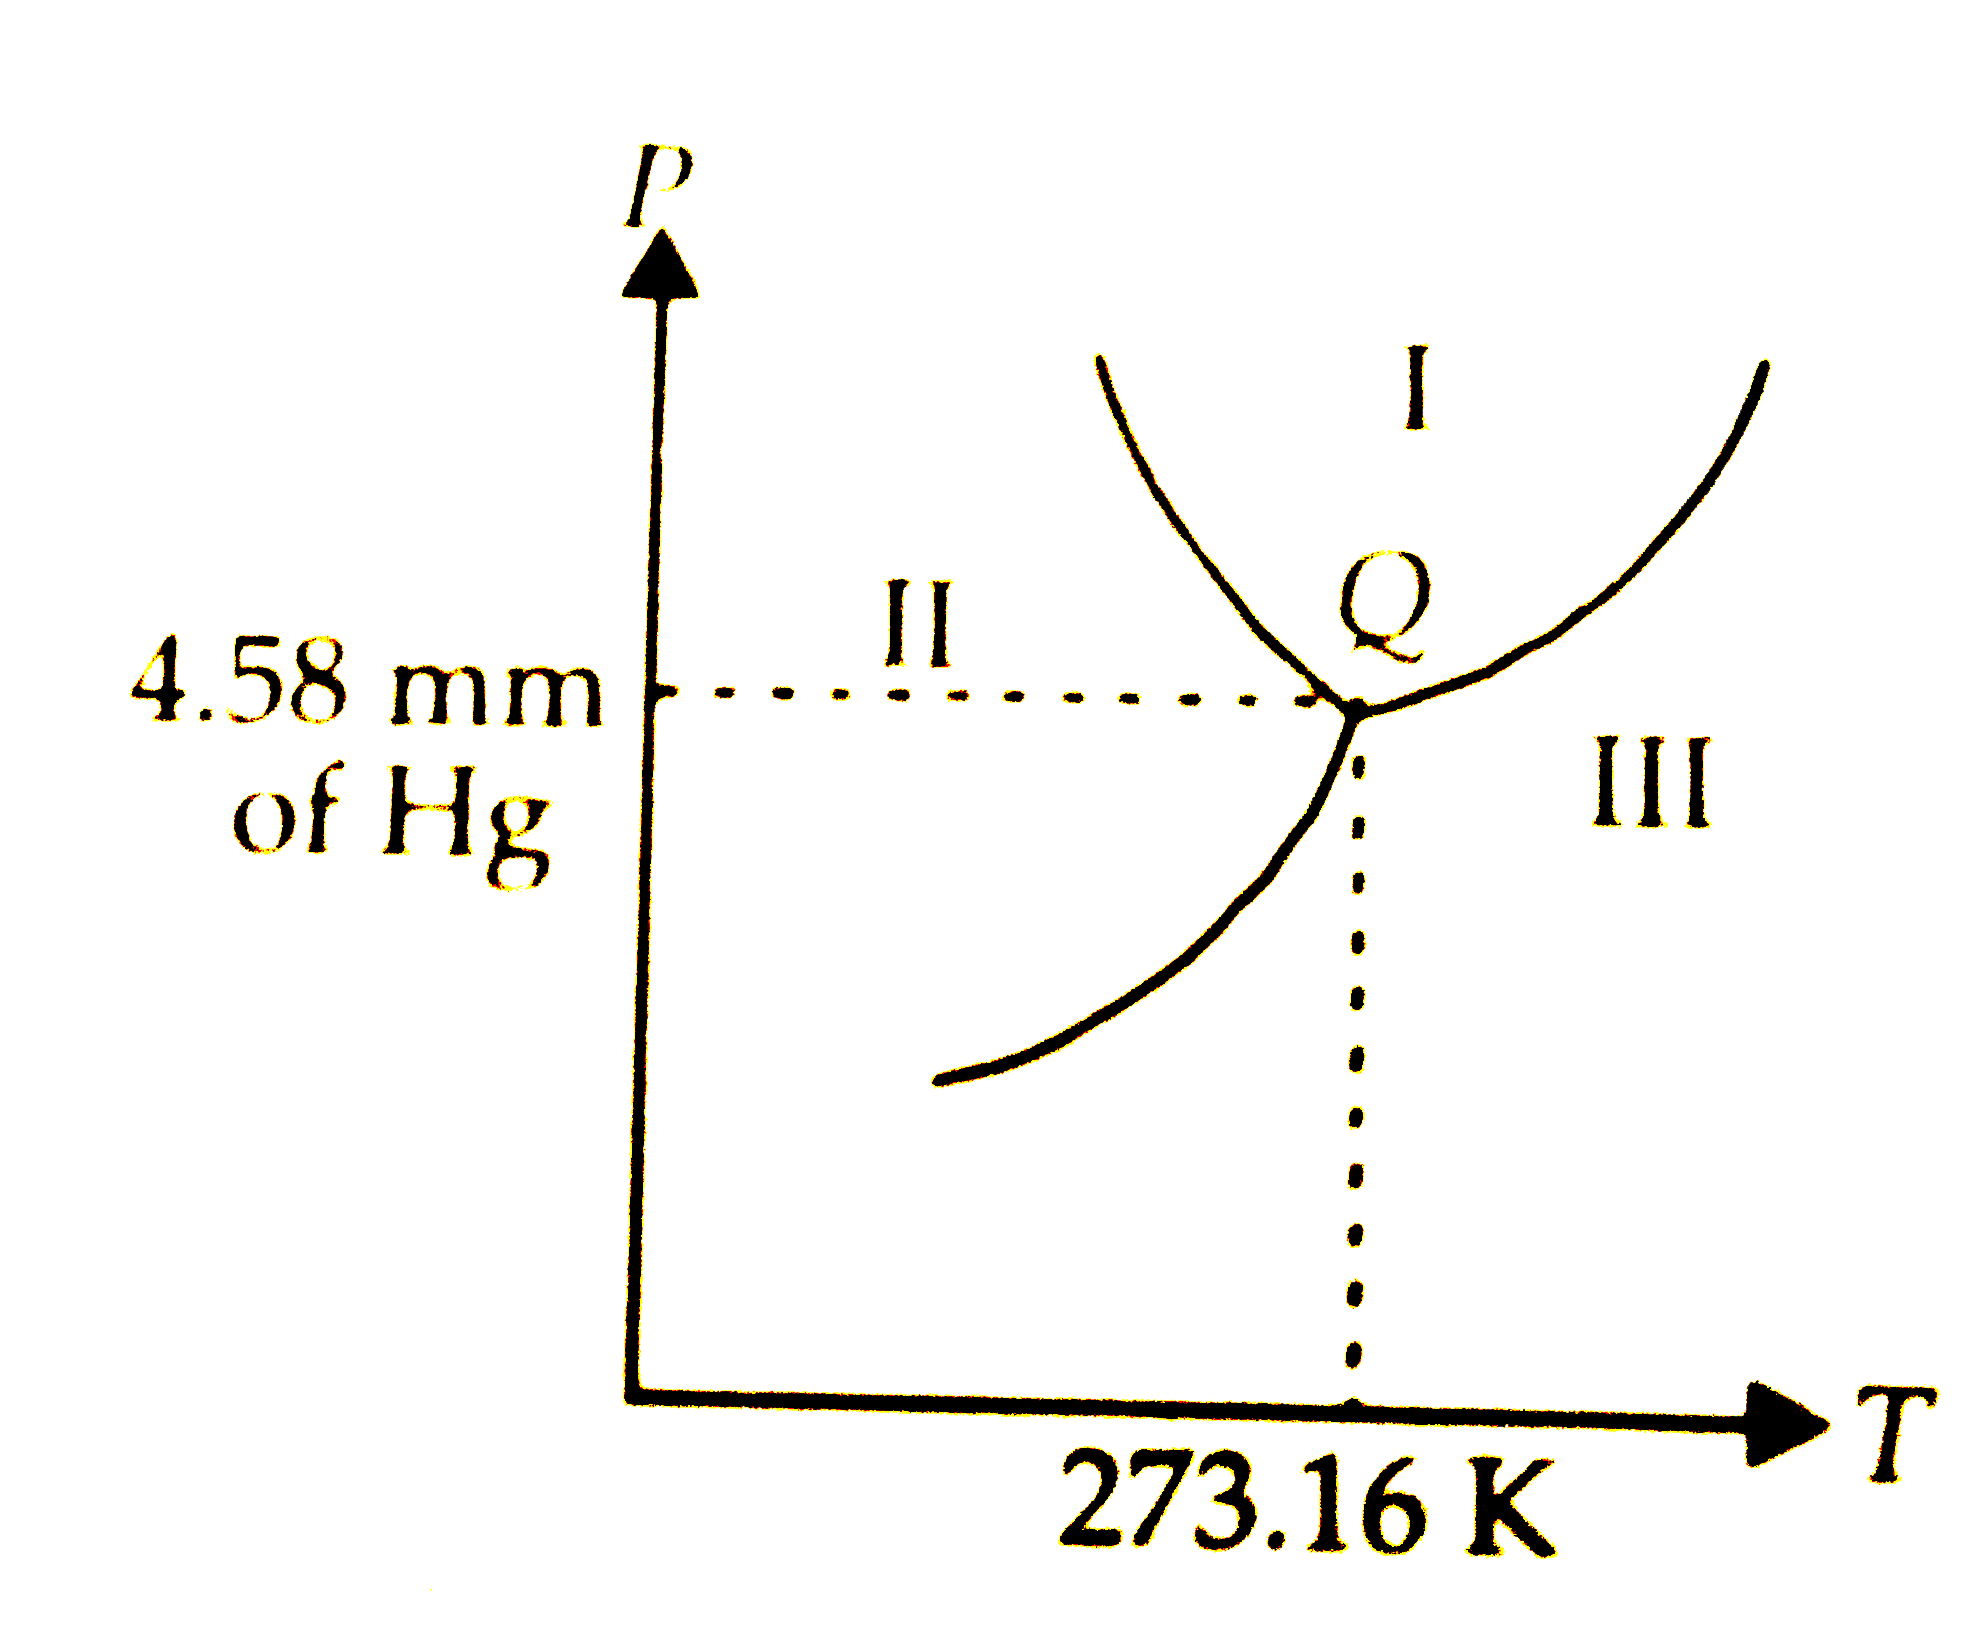
View SolutionIn the phase diagram showns, the point Q corresponds to the triple point of water. The region I, II and III respectively correspond to phases
View Solution
