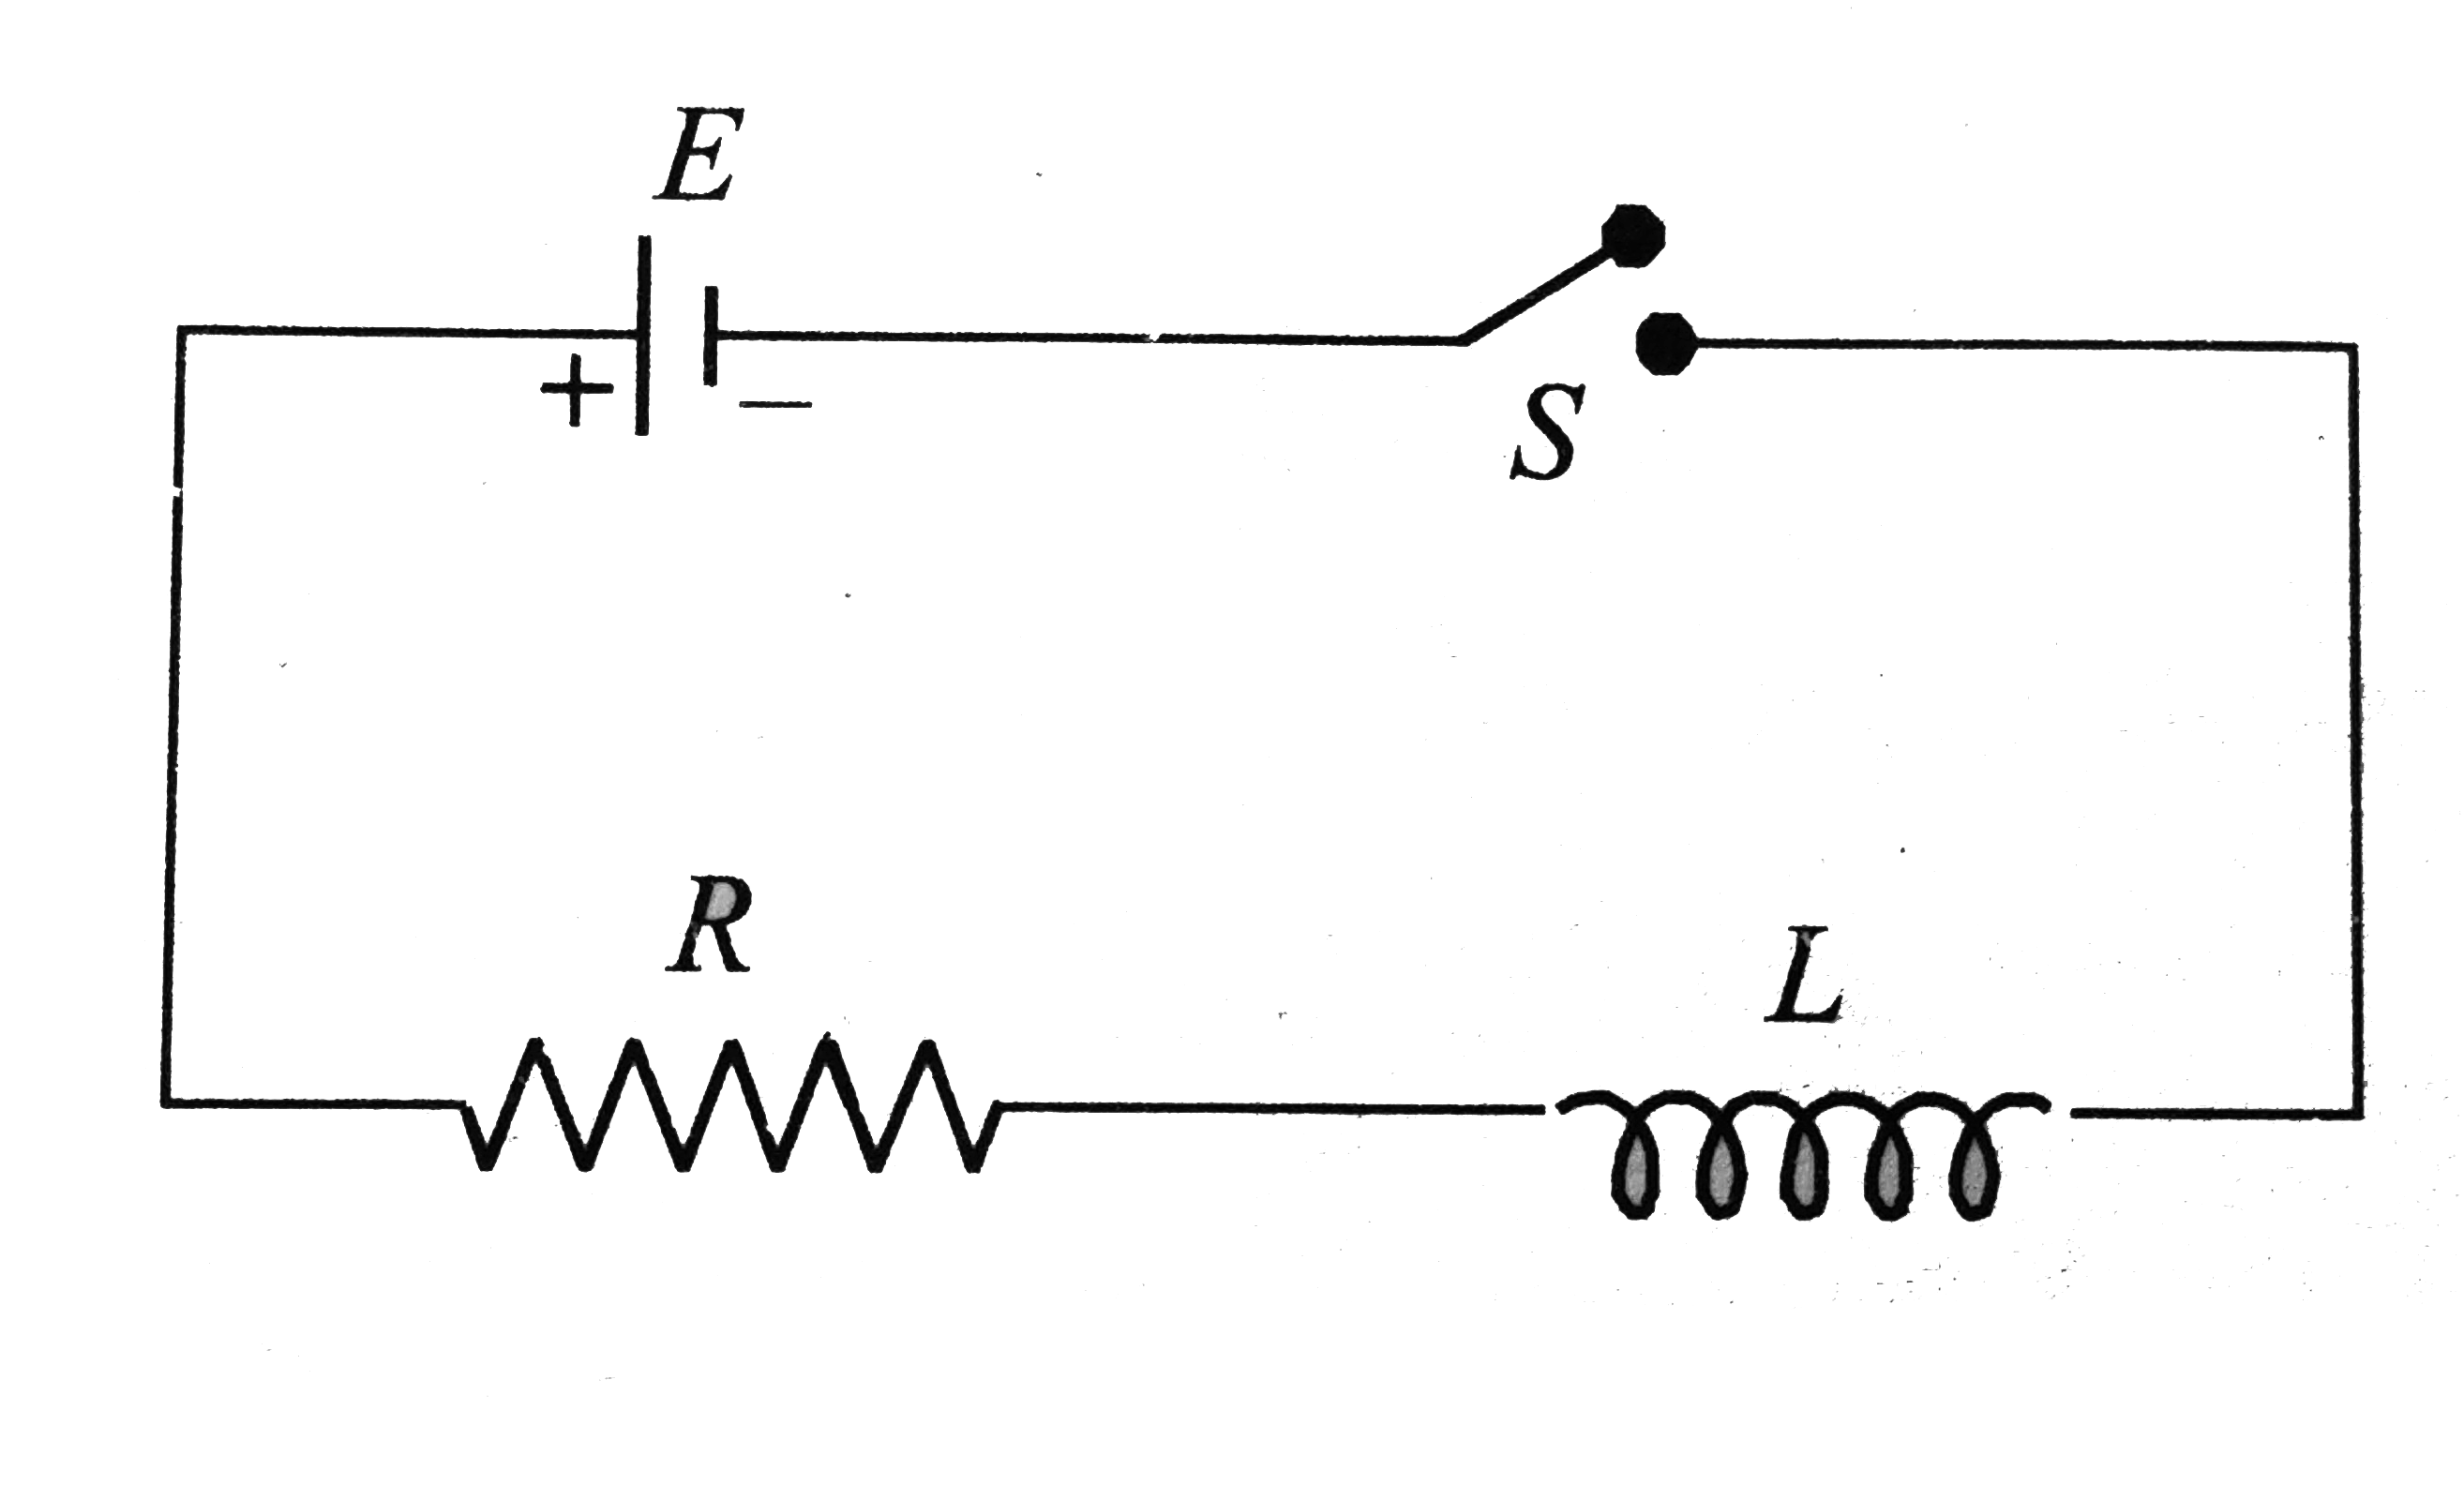
Switch S of the circuit shows in Fig. is closed at t=0. If e denotes the induced emf in L and i the current flowing through the circuit at time t, then which of the following graphs correctly represents the variation of e with i?
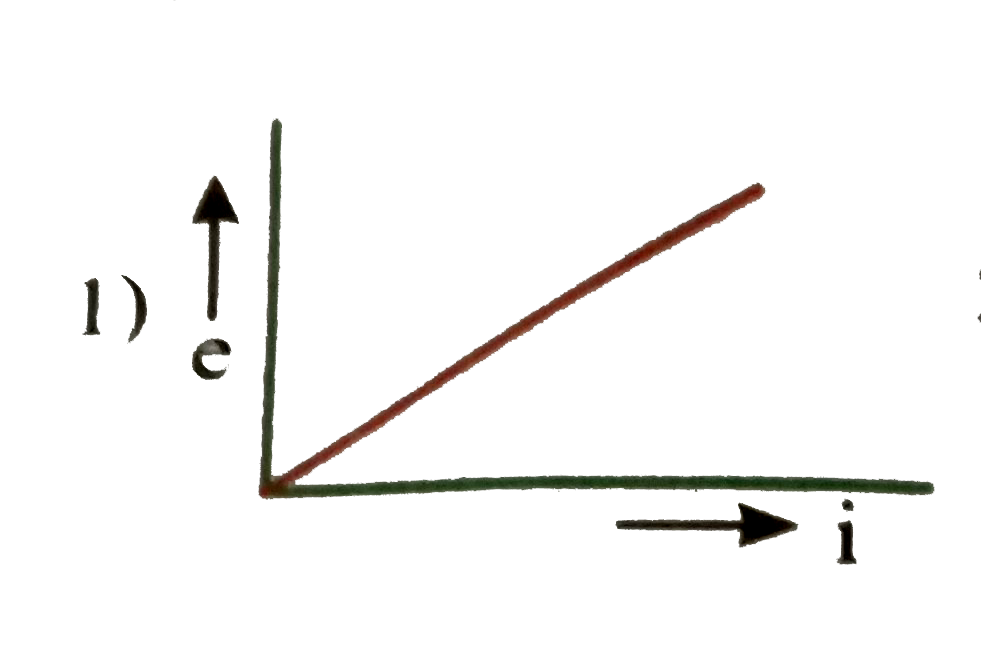
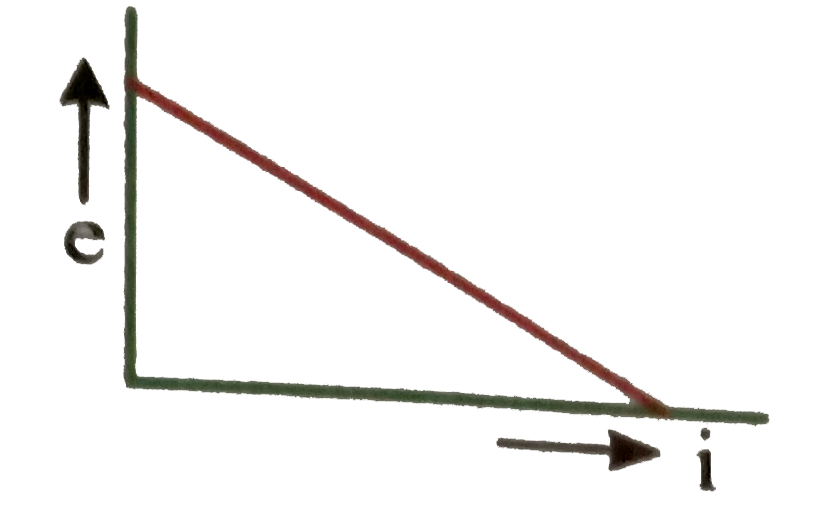
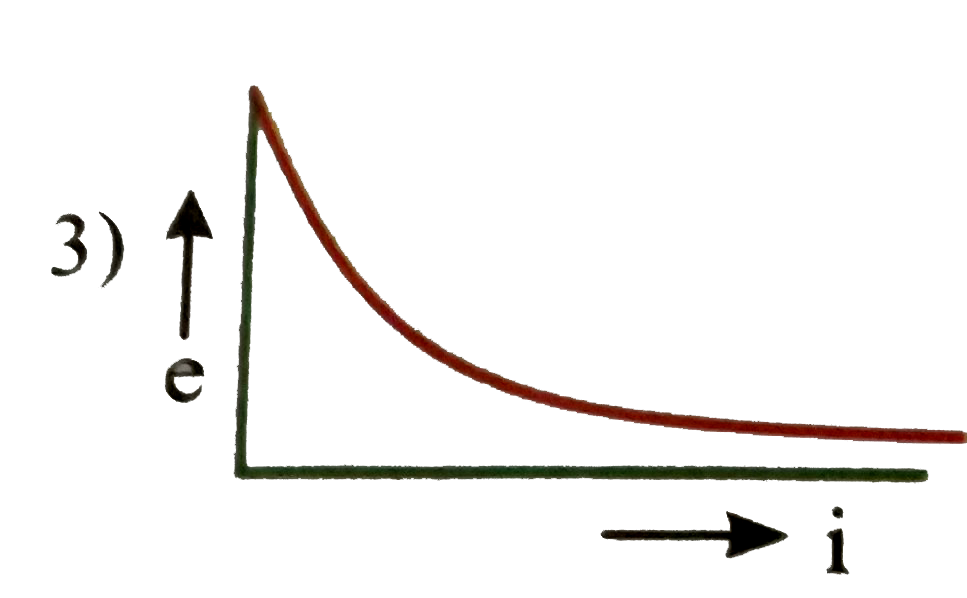
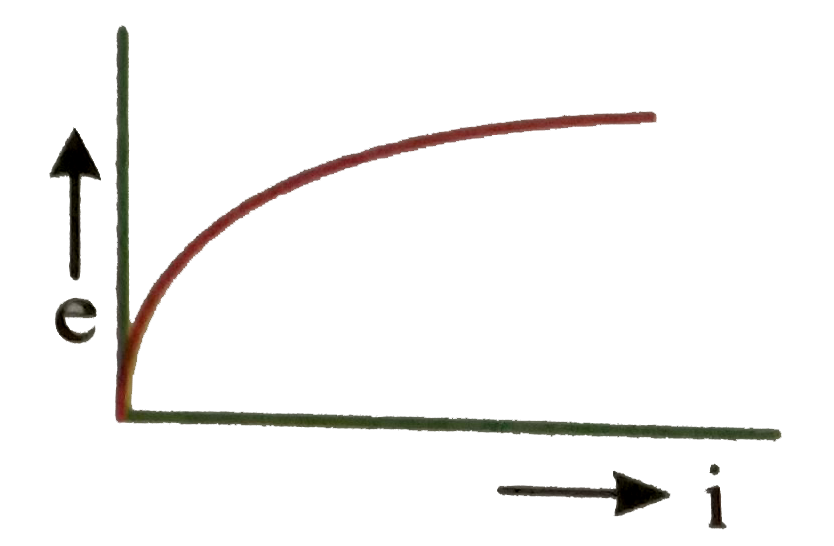
The correct Answer is:B
Step by step video, text & image solution for Switch S of the circuit shows in Fig. is closed at t = 0. If e denotes the induced emf in L and i the current flowing through the circuit at time t, then which of the following graphs correctly represents the variation of e with i? by Physics experts to help you in doubts & scoring excellent marks in Class 12 exams.
Updated on:21/07/2023Topper's Solved these Questions
- ELECTRO MAGNETIC INDUCTIONBOOK - NARAYNACHAPTER - ELECTRO MAGNETIC INDUCTIONEXERCISE - NCERT Based Questions
10 Videos
- ELECTRO MAGNETIC INDUCTIONBOOK - NARAYNACHAPTER - ELECTRO MAGNETIC INDUCTIONEXERCISE - Single Answer Questions Level -V
11 Videos
- ELECTRO MAGNETIC INDUCTIONBOOK - NARAYNACHAPTER - ELECTRO MAGNETIC INDUCTIONEXERCISE - Level-II (C.W)
28 Videos
- ELECTRIC CHARGES AND FIELDSBOOK - NARAYNACHAPTER - ELECTRIC CHARGES AND FIELDSEXERCISE - EXERCISE -4
43 Videos
- ELECTRO MAGNETIC WAVESBOOK - NARAYNACHAPTER - ELECTRO MAGNETIC WAVESEXERCISE - LEVEL-II(H.W)
14 Videos
Similar Questions
Switch is closed at t=0 then the current in the circuit at t=L2R is
_PHY_E06_157_Q01.png)
View SolutionIn an L-R circuit connected to a battery of constant e.m.f. E switch S is closed at time t=0. If e denotes the magnitude of induced e.m.f. across inductor and i the current in the circuite at any time t. Then which of the following graphs shows the variation of e with i?
View Solution
Knowledge Check
Switch S of the circuit shows in Fig is closed at t=0. If e denotes the induced emf in L and I is the current flowing through the circuit the circuit at time t, which of the following graphs is//are correct?
 A
A B
B C
C D
D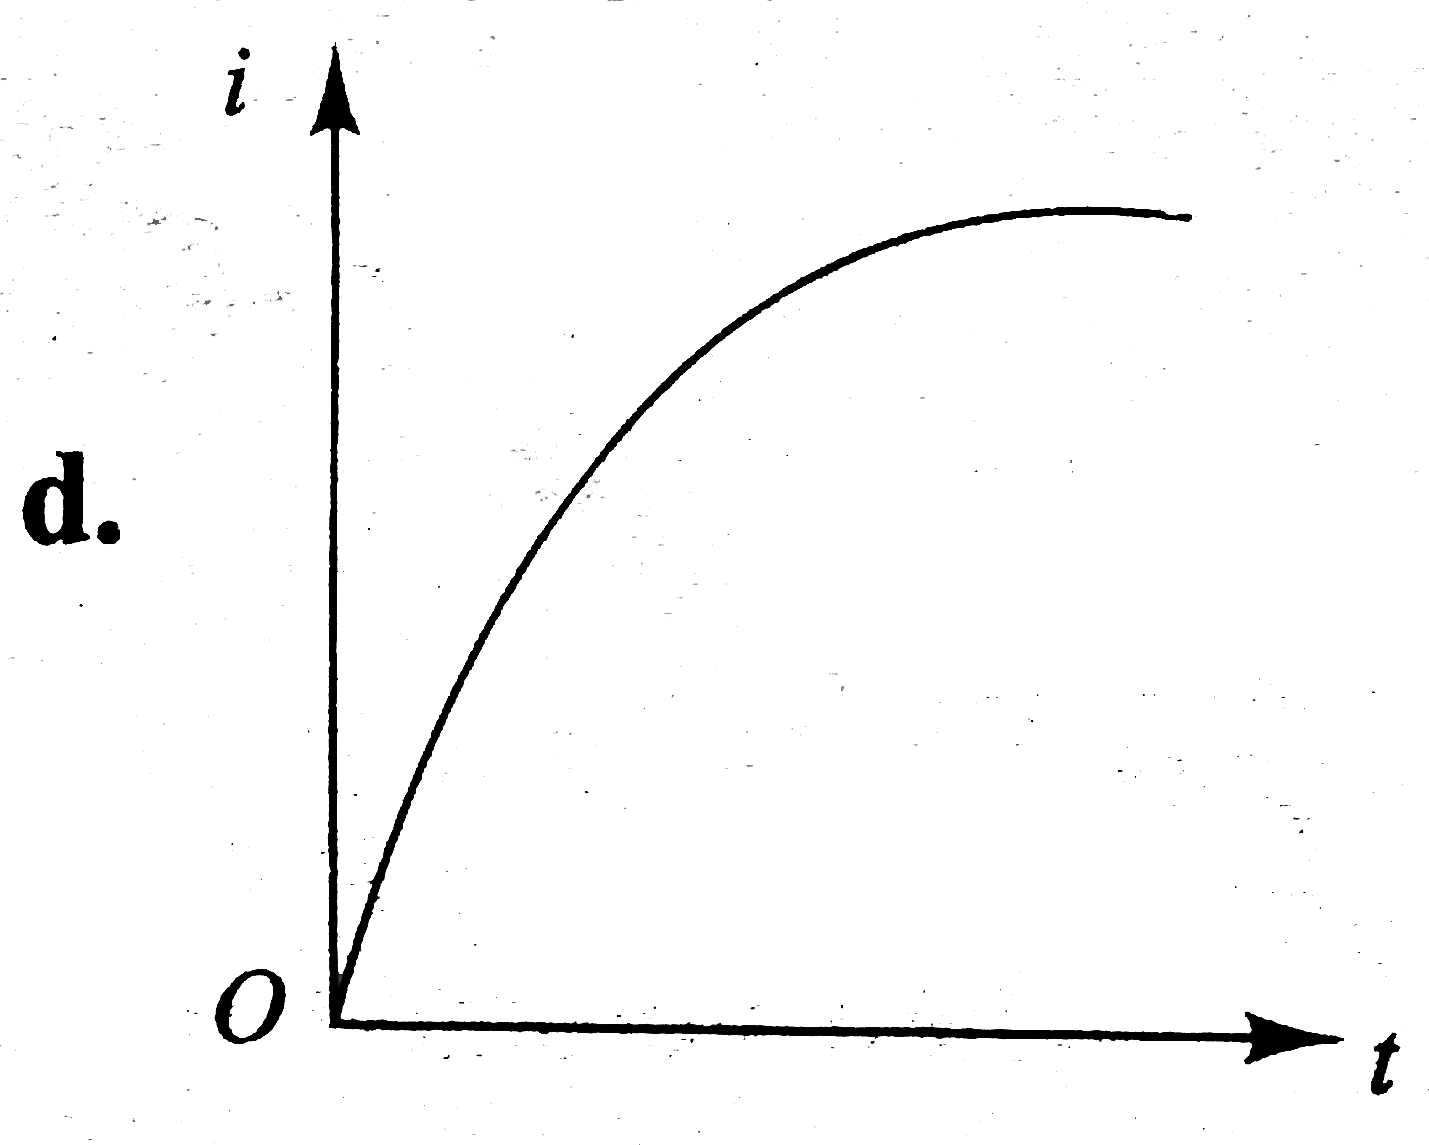
In the circuit shows in Fig the switch is closed at t=0.
 AAt t=0,I1=I2=0BAt any time t,I0I2=L2L1CAt any time t, I1+I2=εRDAt t=∞,I1 and I2 are independent of L1 and L2
In an L-R circuit connected to a battery of constant emf E, switched is closed at time t=0. If denotes the induced emf across inductor and I the current in the circuit at any time t. Then which of the following graphs shown the variation of e with i?
A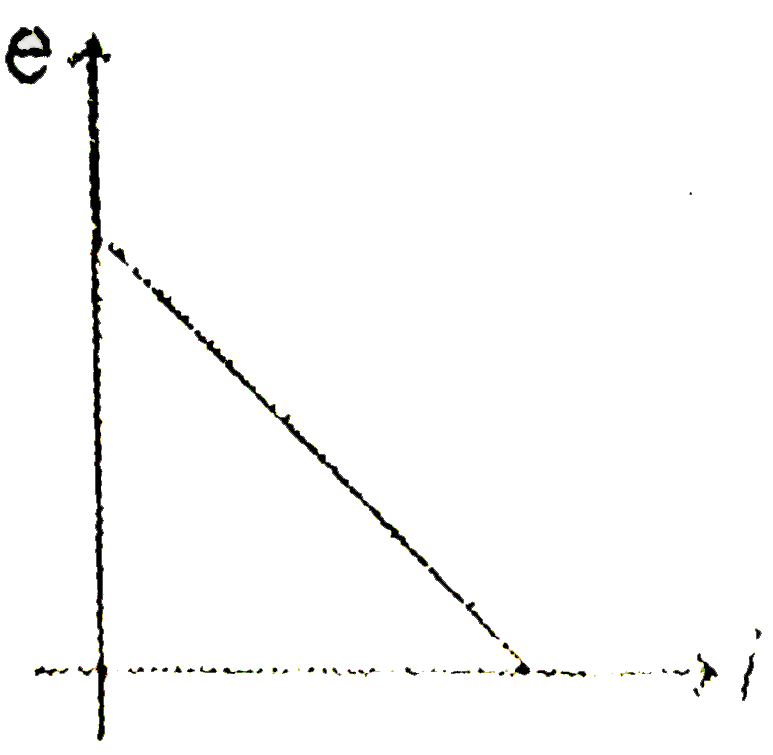 B
B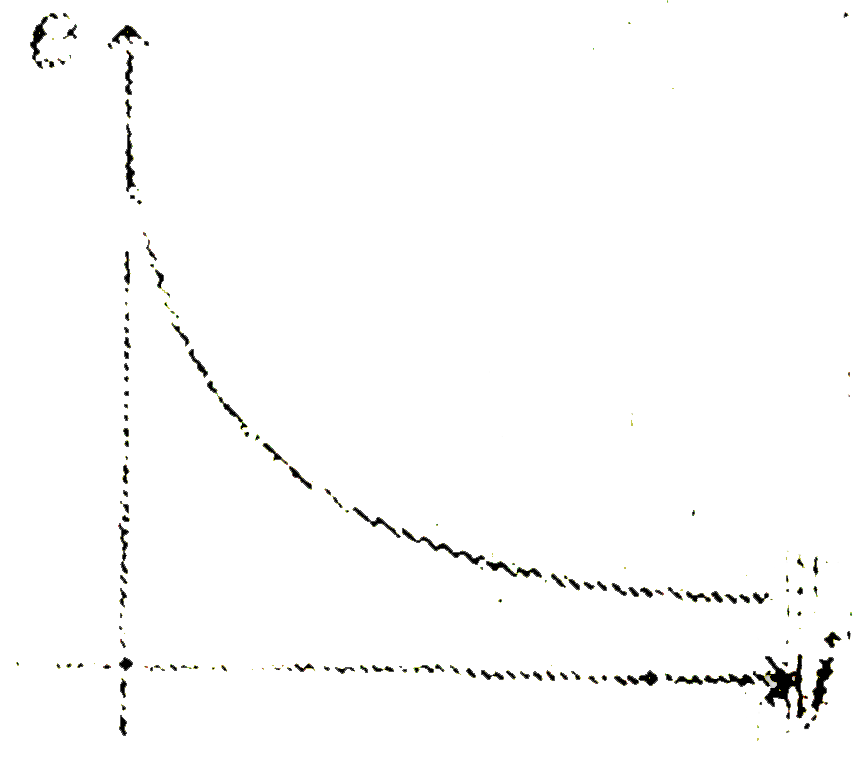 C
C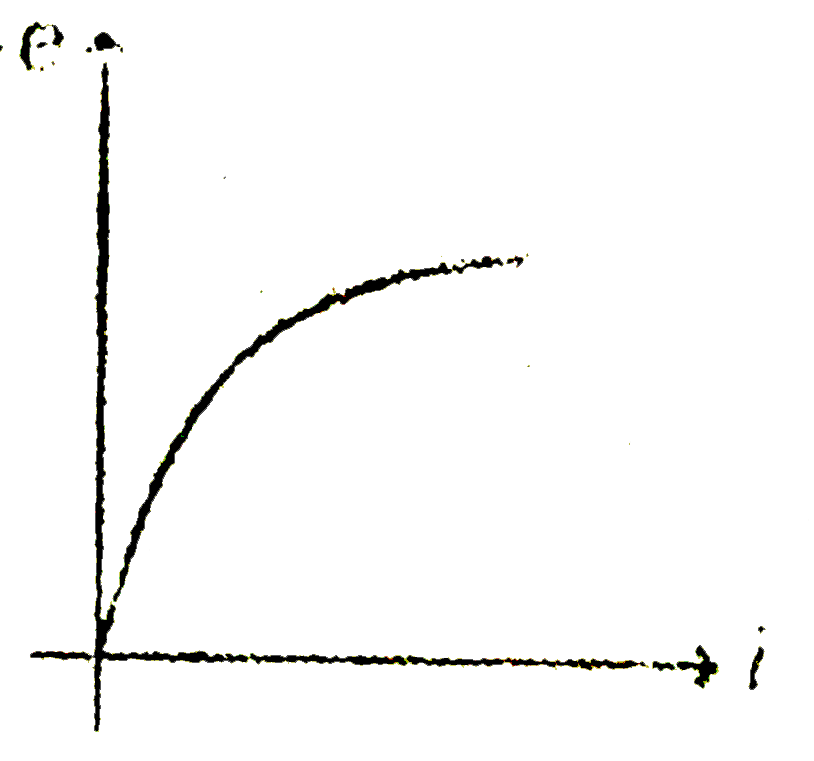 D
D
Two plates of a charged capacitor are connected to each through a resistance and a switch which is kept open initially. The switch is closed at t= 0. If q is charge on capacitor and I is the current in the circuit at time t then the curves that correctly represent the variation of the change and current with time are:
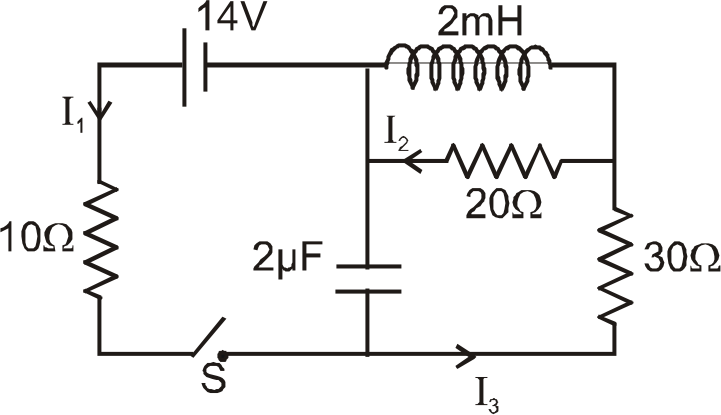
View SolutionIn the circuit shown, the switch is closed at t=0, the currents I1,I2 and I3 are
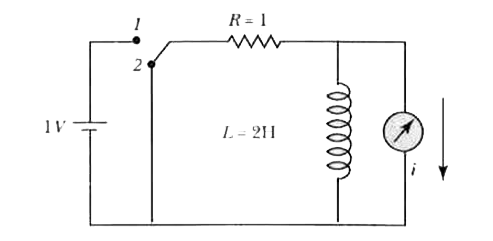
View SolutionIn the circuit shown in the following figure, the switch is moved to position 1 at t = 0. Which of the following most closely represents the current I as a function of time?
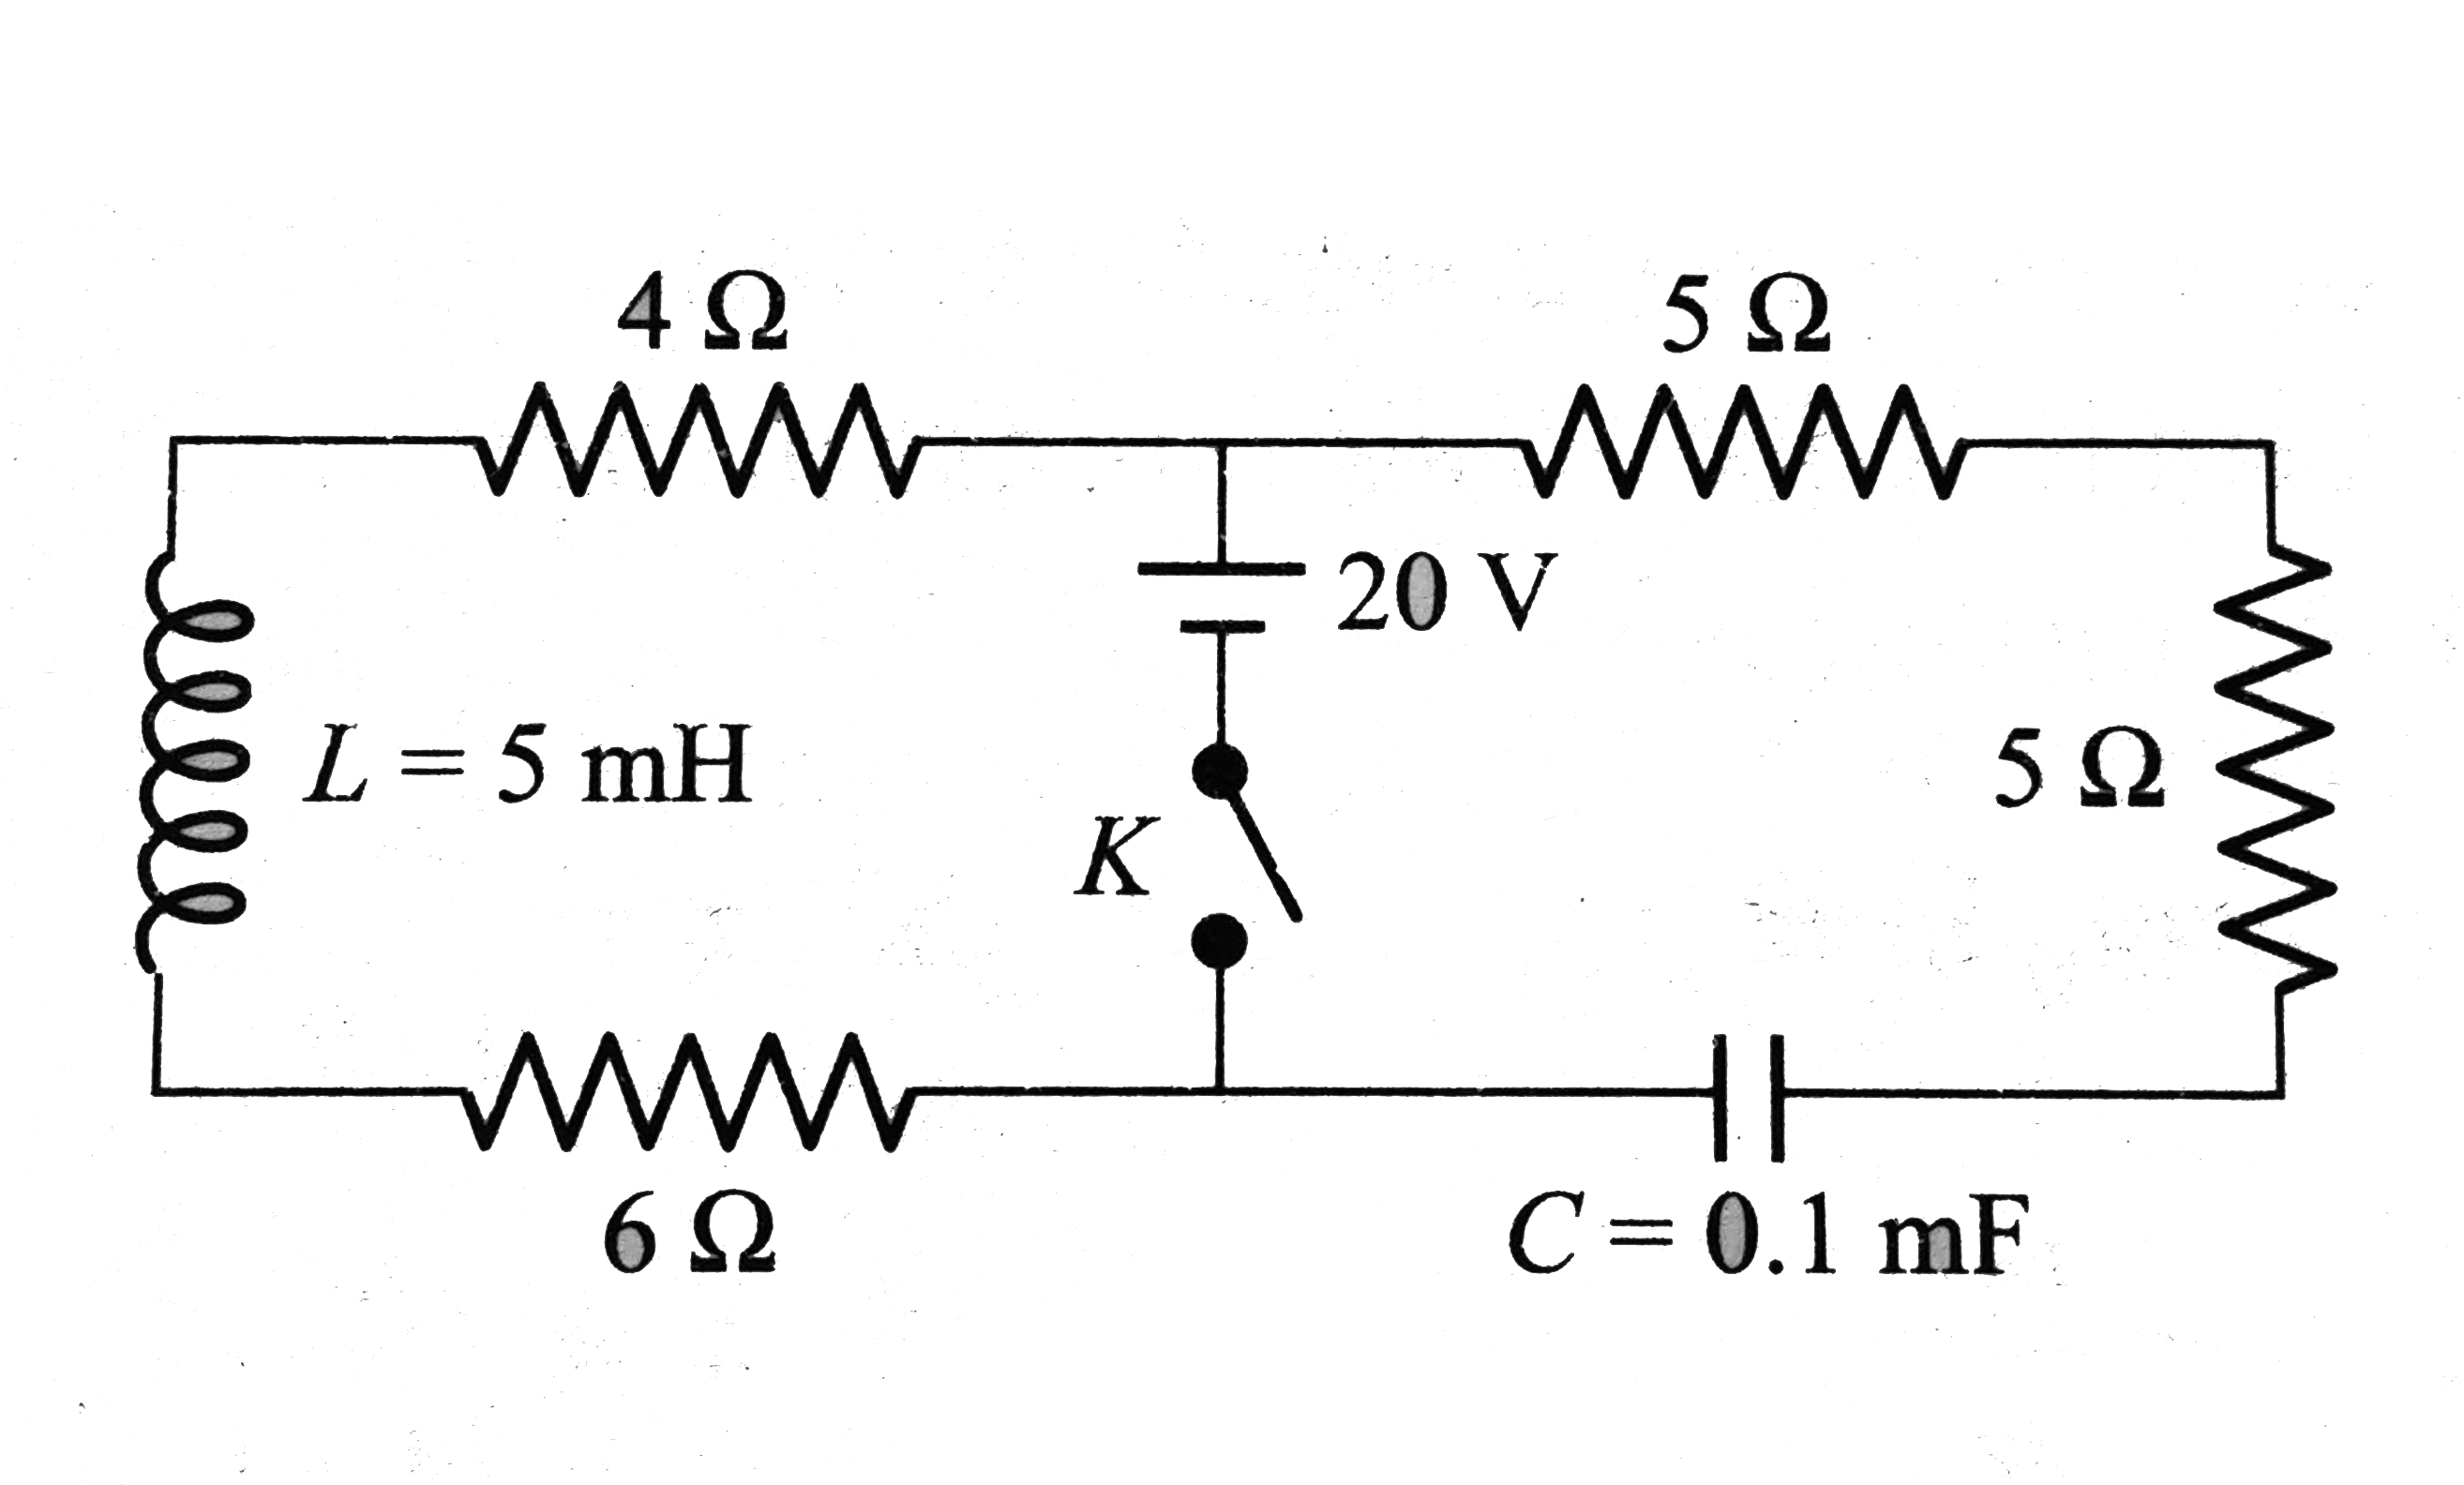
View SolutionIn the circuit shows in Fig. kay K is closed at t=0, the current through the key at the instant t=10−3In2s is
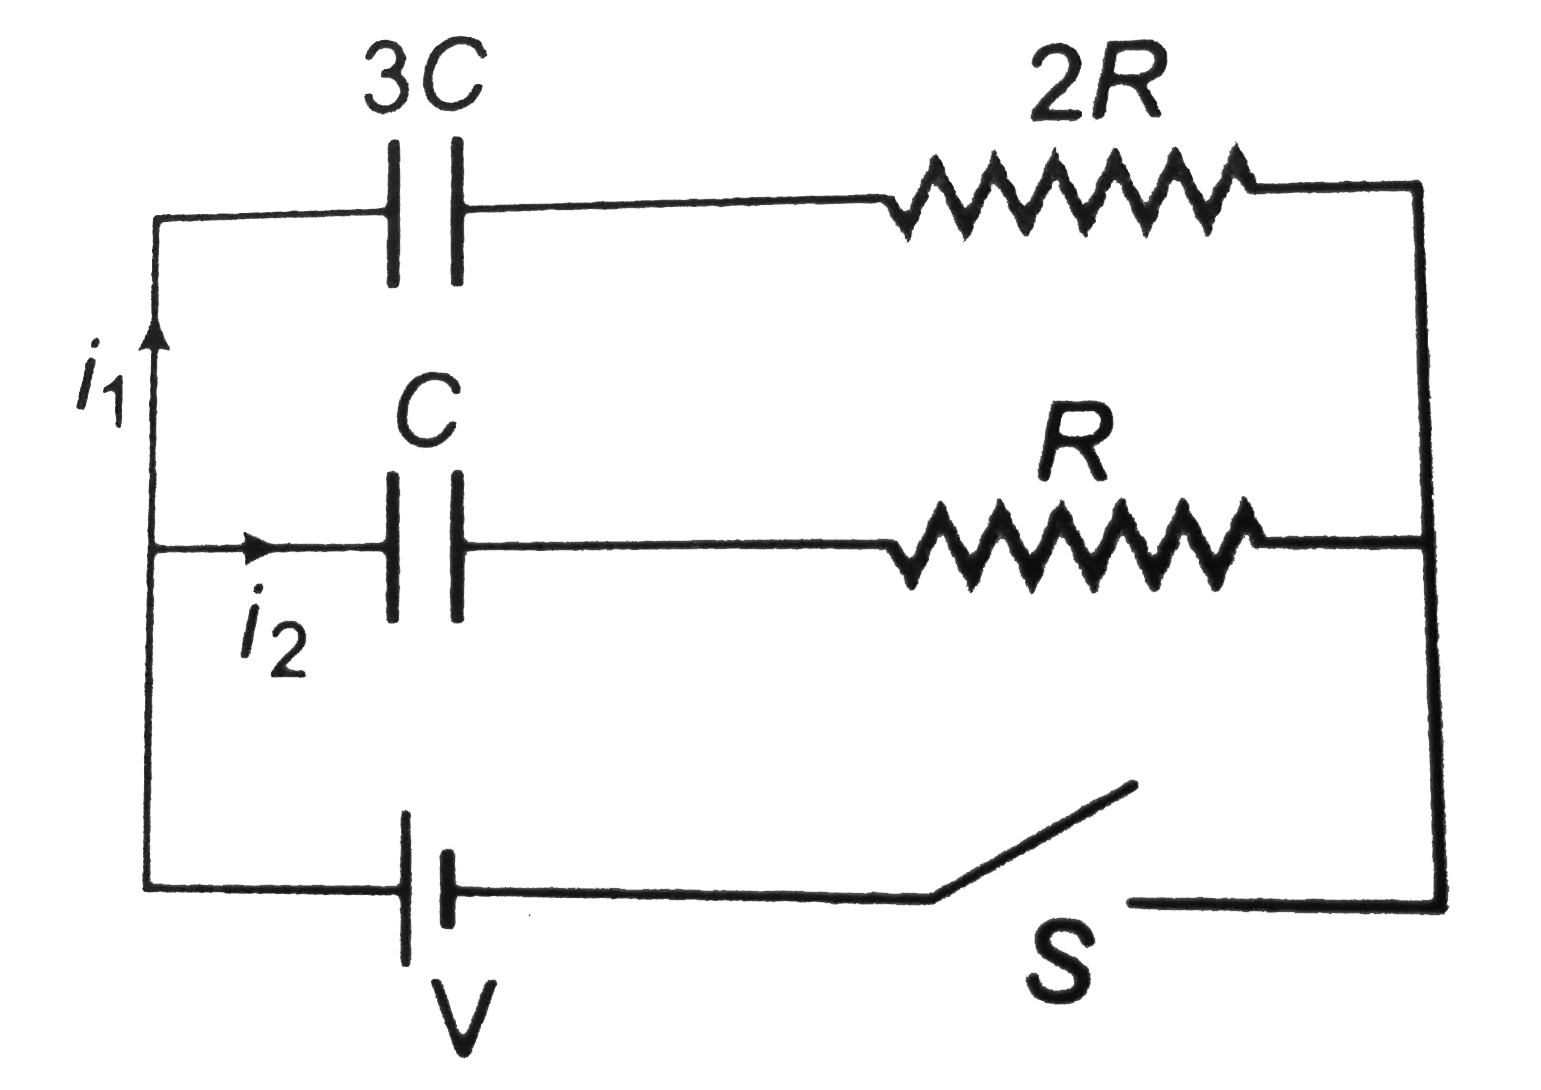
View SolutionIn the circuit shown switch S is closed at t=0. Let i1 and i2 be the current at any finite time t then the ratio i1i2
View Solution
