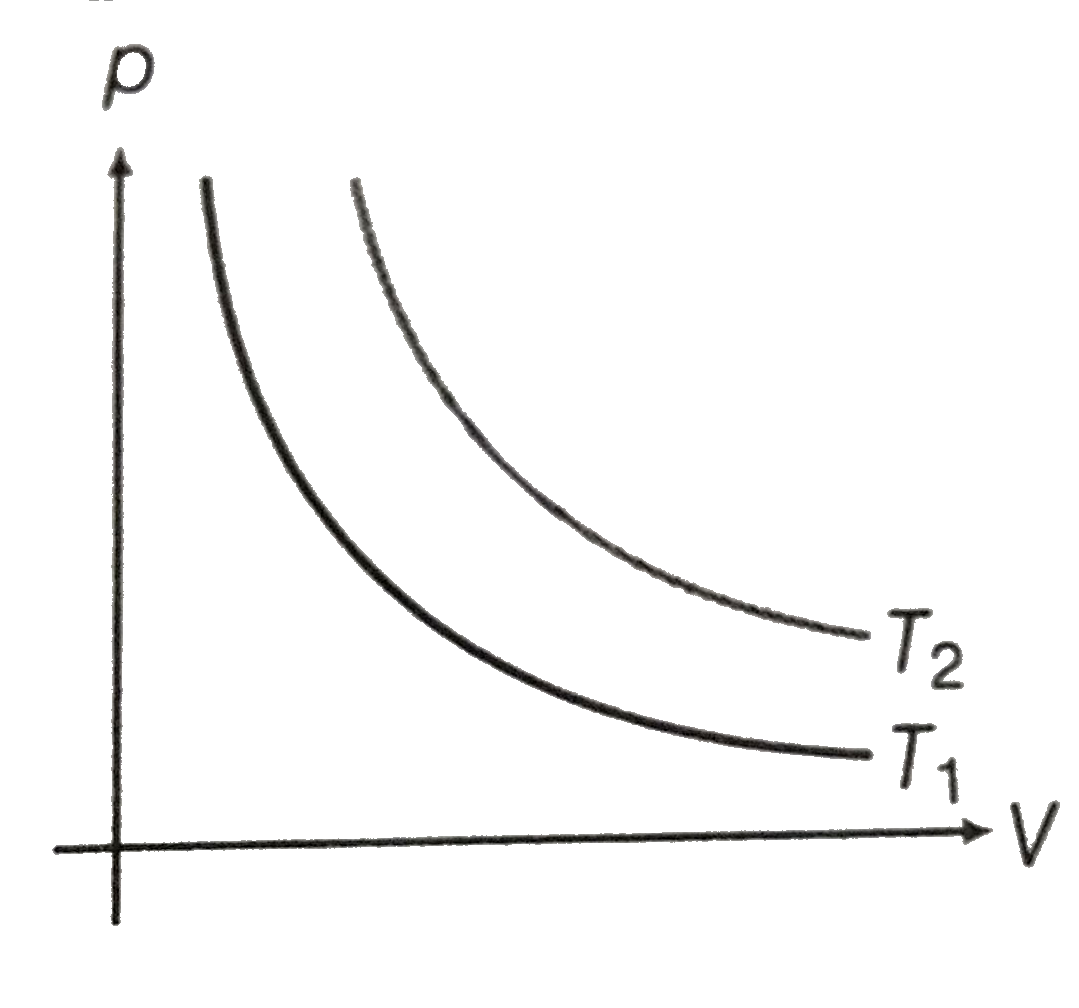
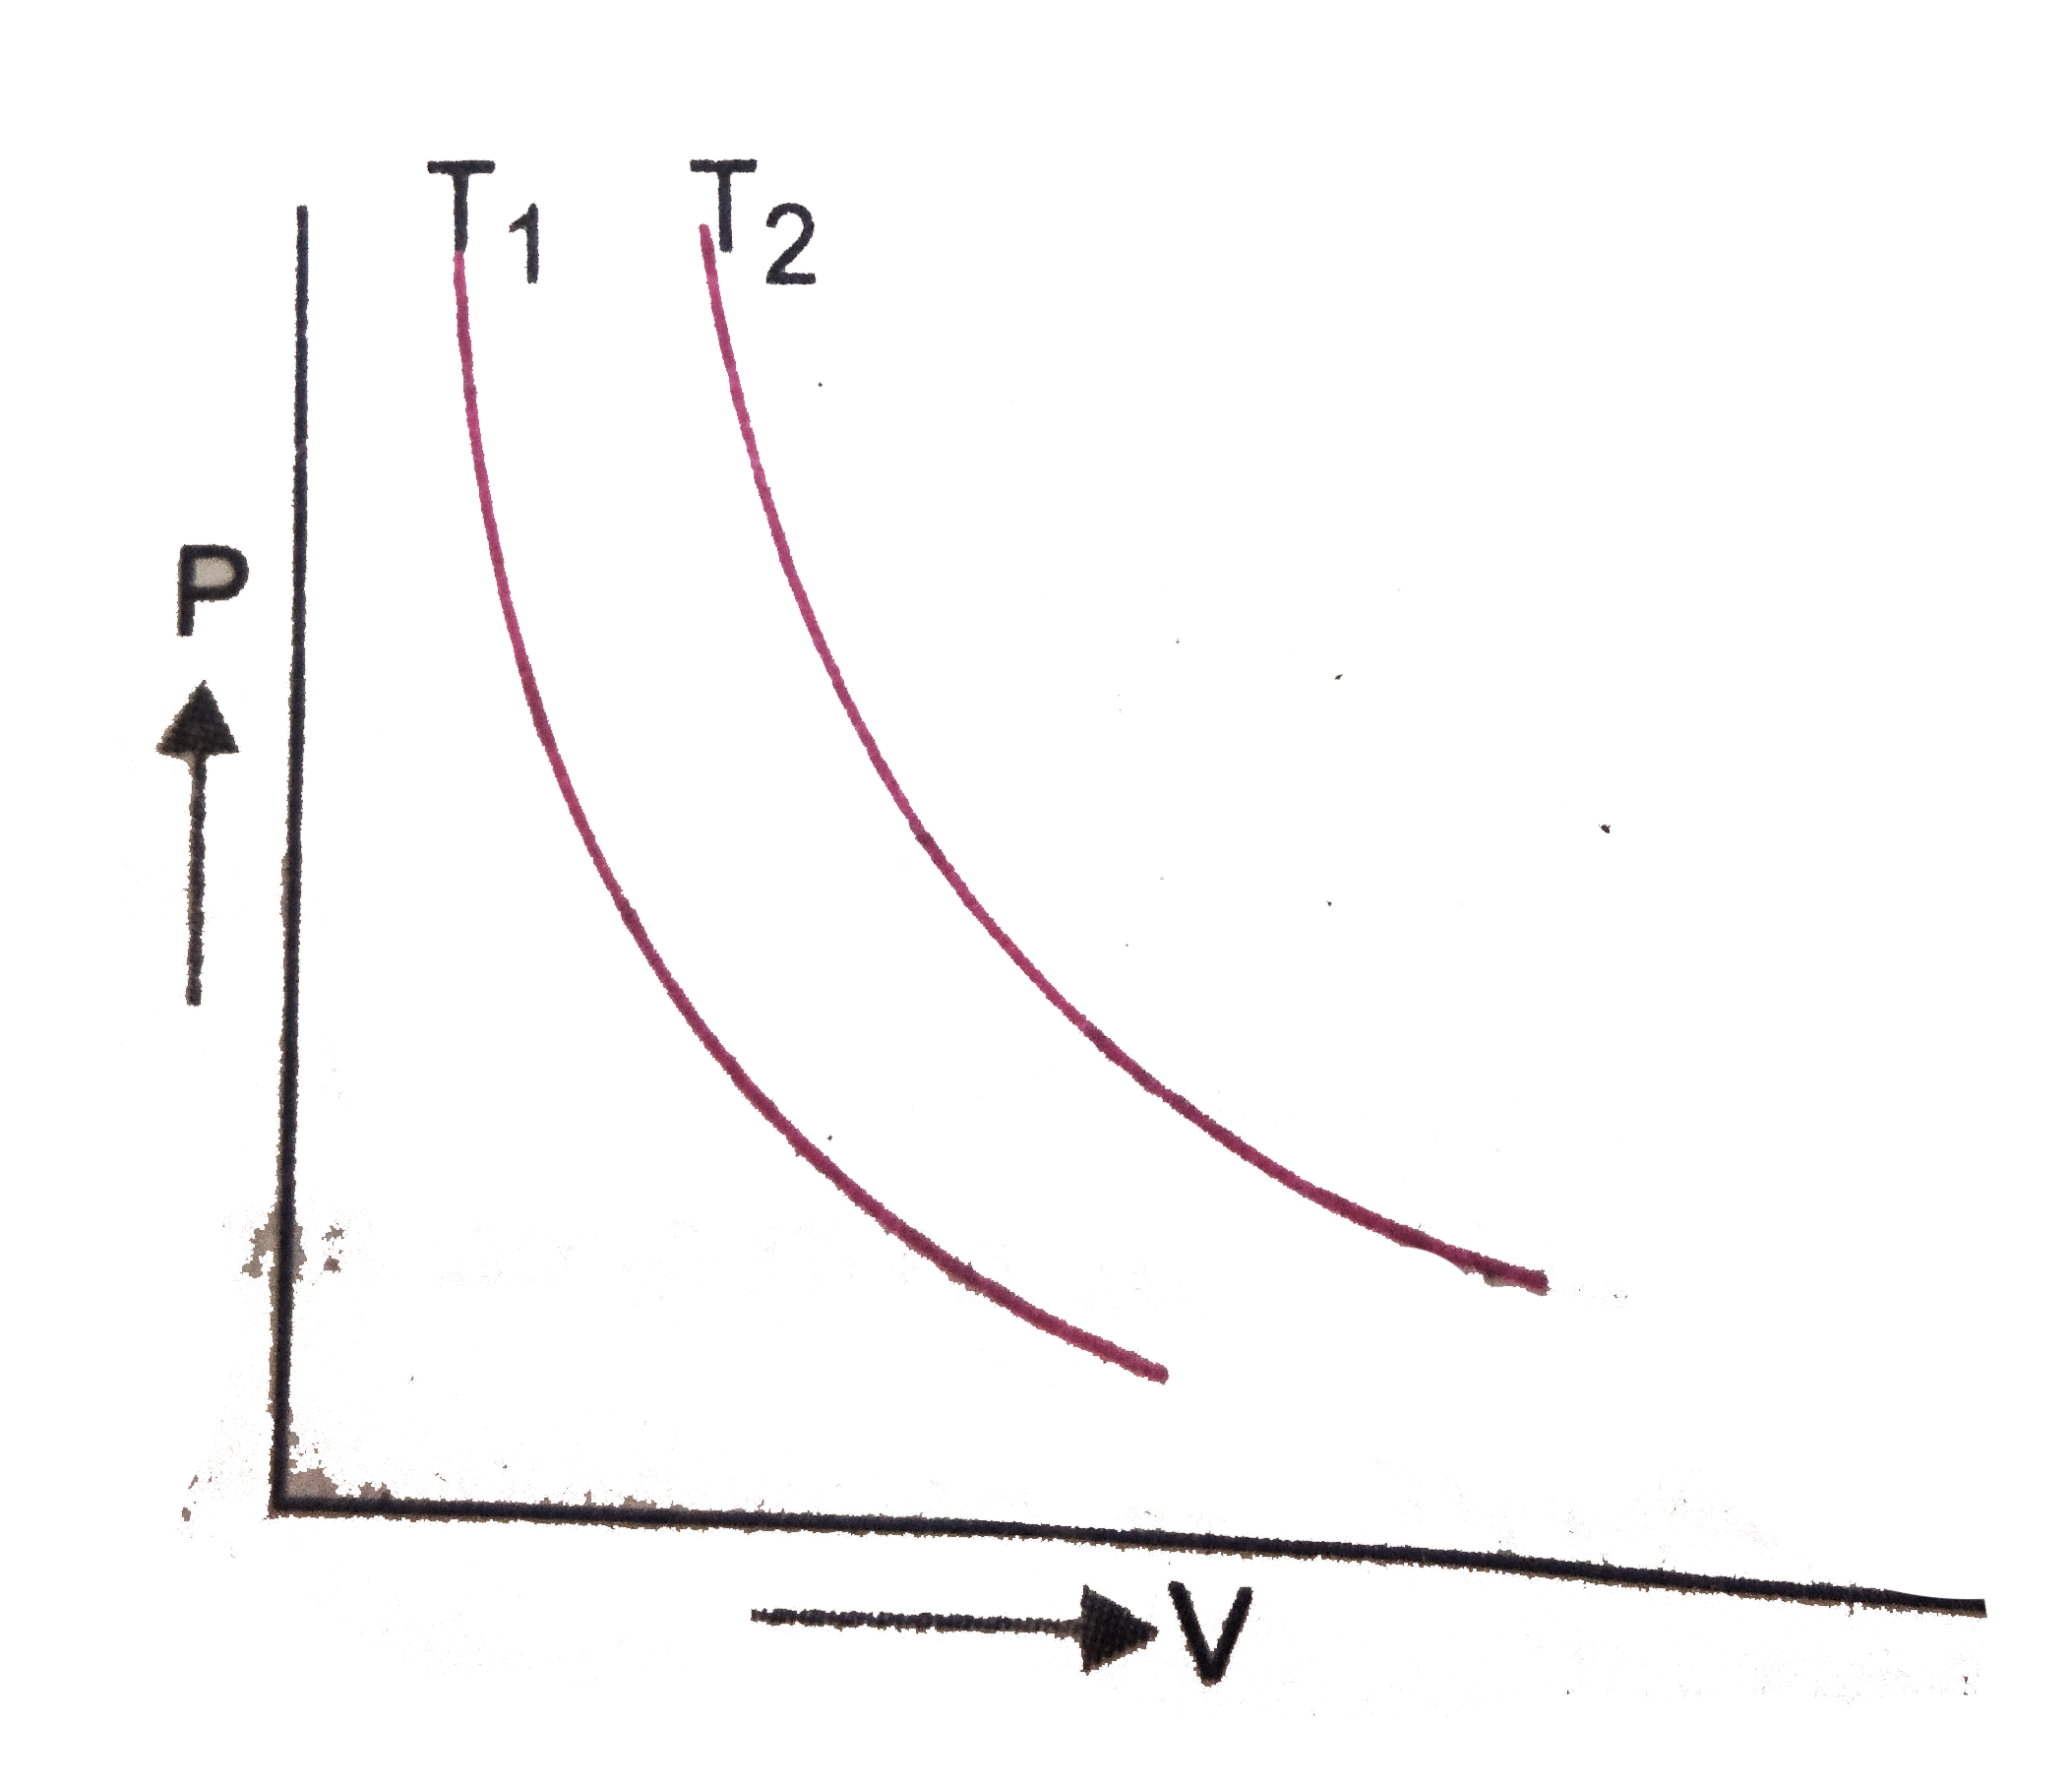
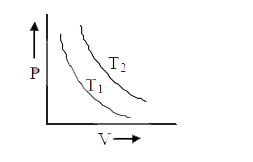
Isothermal curves for a given mass of gas are shown at two different temperture T1andT2 in Fig. State whether T1>T2orT2>T1. Justify your answer.
Video Solution
Text Solution
Keeping the pressure of the gas remains constant.
According to Charles's law V∝T
_S01_009_S01.png)
In the graph is pressure kept constant and volumes are comapred
From Charles's law at constant pressure V∝T
From the graph V2>V1 so T2>T1
|
Topper's Solved these Questions
- THERMAL PROPERTIES OF MATTERBook:NARAYNAChapter:THERMAL PROPERTIES OF MATTERExercise:LEVEL-III
Explore 22 Videos
- THERMAL PROPERTIES OF MATTERBook:NARAYNAChapter:THERMAL PROPERTIES OF MATTERExercise:LEVEL-I (C.W.)
Explore 23 Videos
- THERMAL PROPERTIES OF MATTERBook:NARAYNAChapter:THERMAL PROPERTIES OF MATTERExercise:LEVEL-I(H.W.)
Explore 21 Videos
- SYSTEM OF PARTICLES AND ROTATIONAL MOTION Book:NARAYNAChapter:SYSTEM OF PARTICLES AND ROTATIONAL MOTION Exercise:EXERCISE - IV
Explore 39 Videos
- THERMODYNAMICSBook:NARAYNAChapter:THERMODYNAMICSExercise:Exercise
Explore 187 Videos
Similar Questions
Knowledge Check
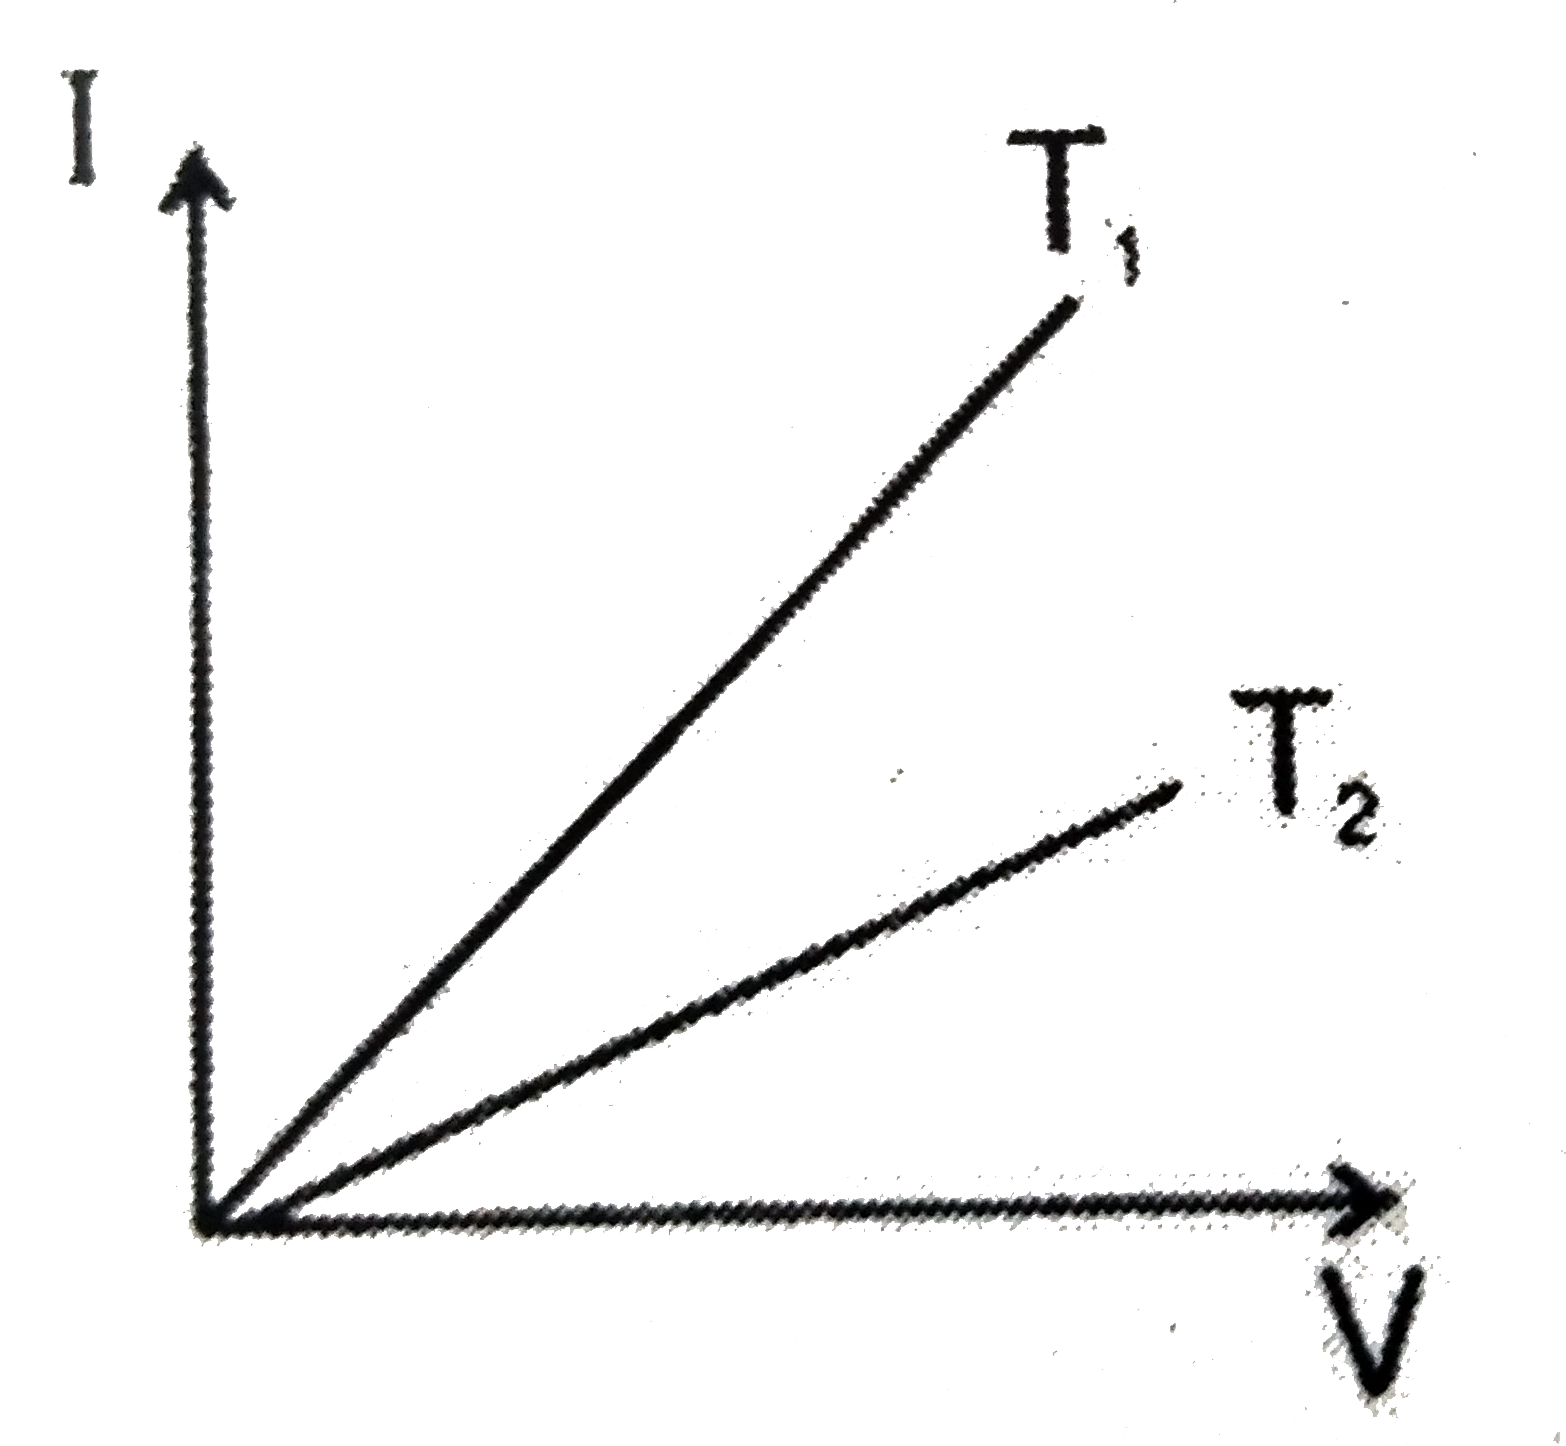
The current (I) and voltage (V) graphs for a given metallic wire at two different temperature (T1) and (T2) are shown in fig. It is concluded that
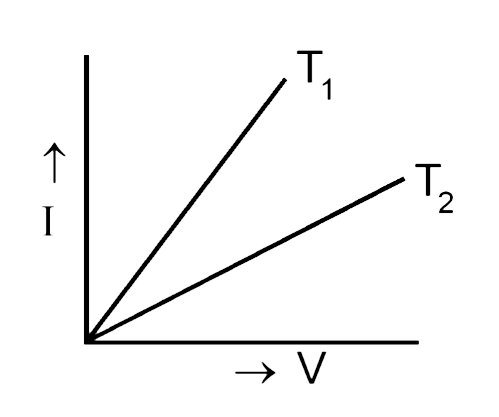 AT1=T2BT1>T2CT1<T2DNone of these
The isothermal diagram of a gas at three different temperatures T1,T2and_(3), is show in the given figure .Then
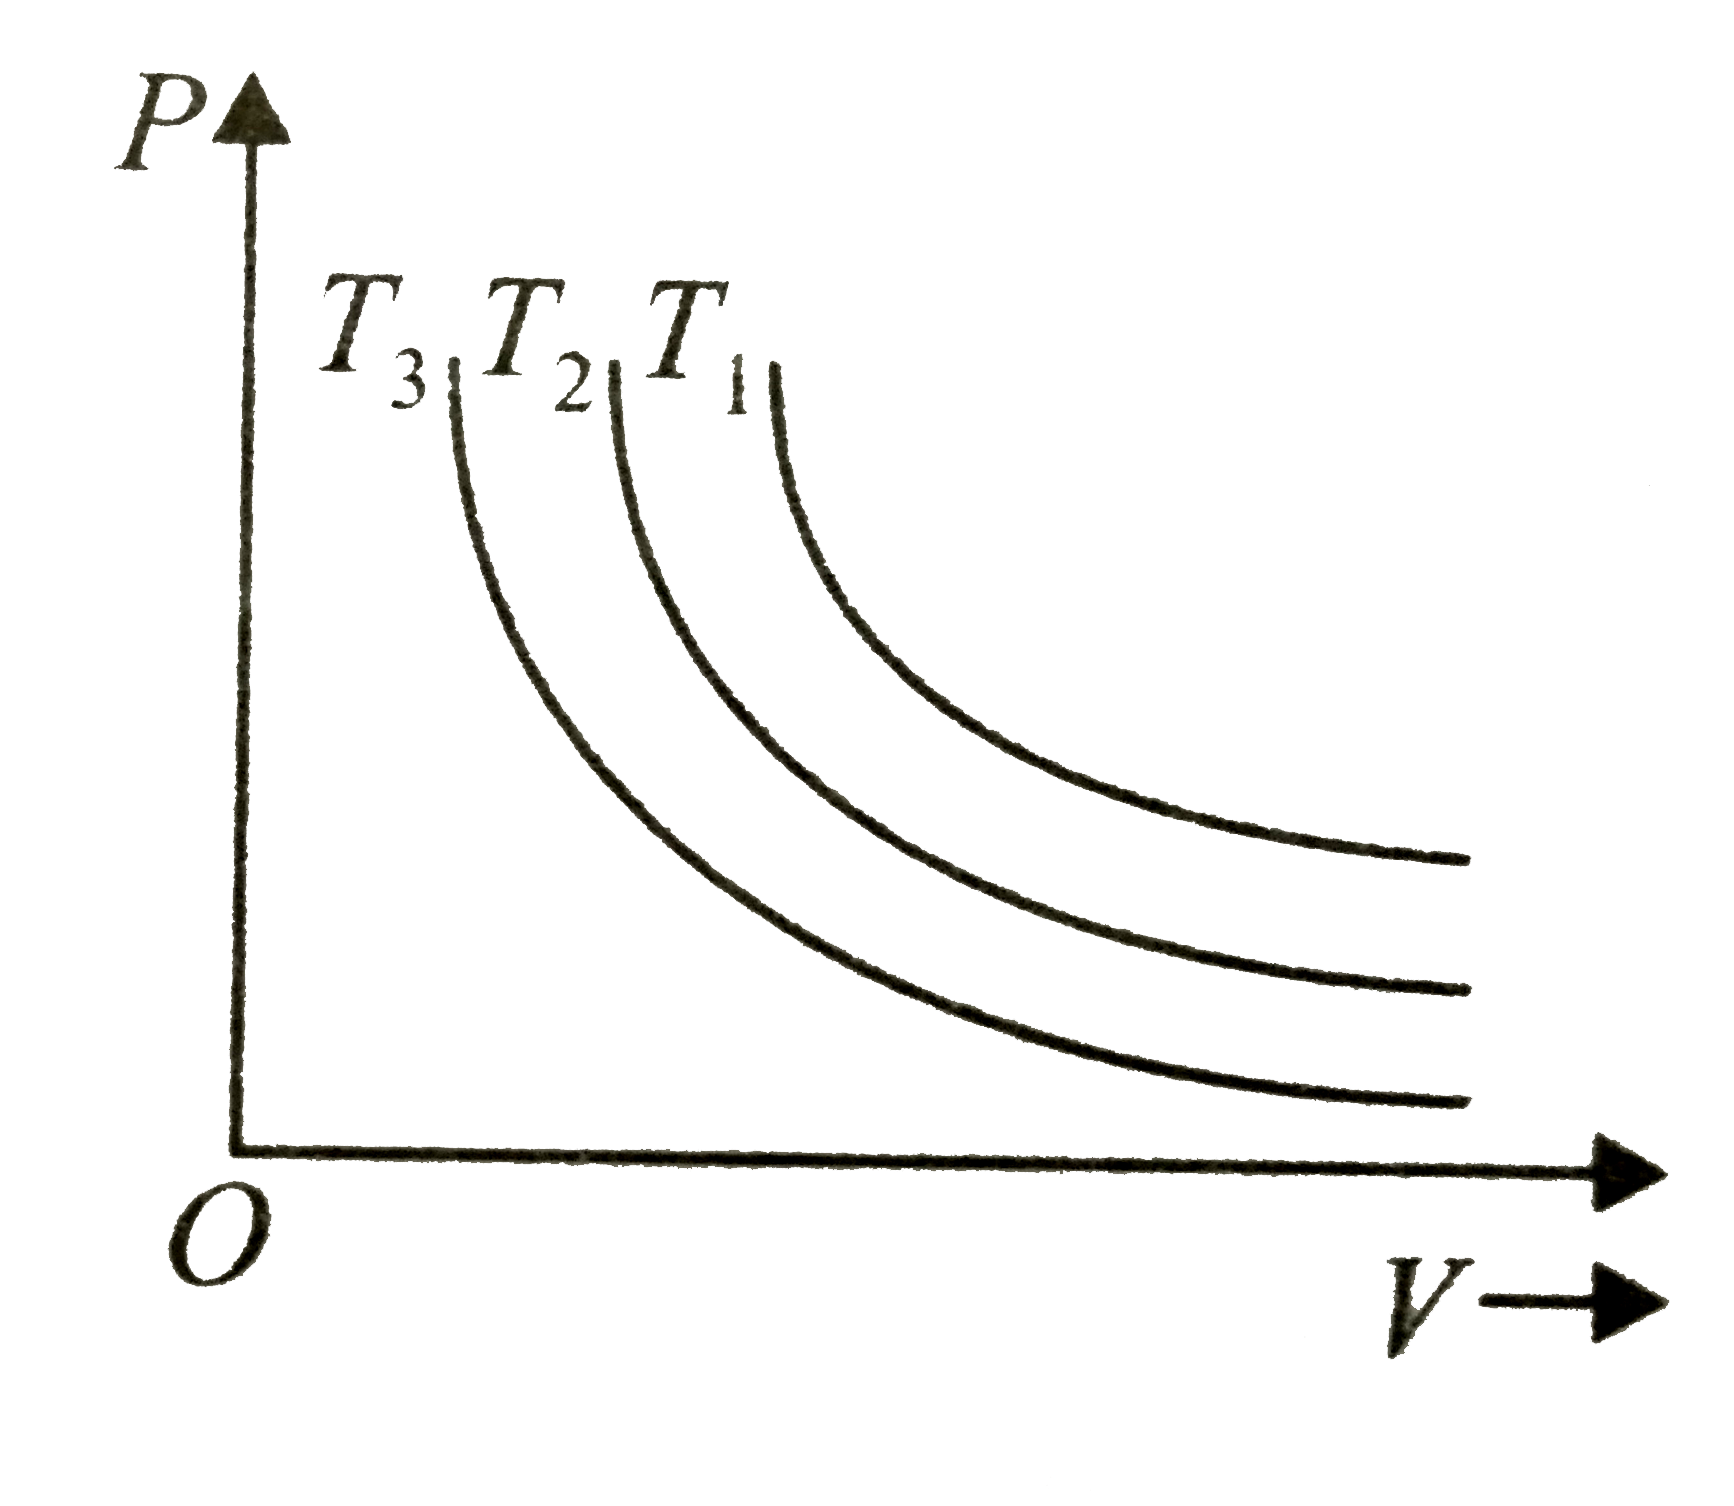 AT1<T2<T3BT1<T2>T3CT1>T2>T3DT1>T2<T3
The stress-strain graph for a metallic wire is shown at two different temperature, T1 and T2 which temperature is high T1 or T2 ?
View SolutionT1andT2 in the given figure are
View SolutionFind T1andT2 in the given figure.
View SolutionThe current-coltage graphs for a given metallic wire at two differenct tempeature T1 and T2 are shown in the figure. Which one is higher, T1 or T2
View SolutionFind T1andT2 in the given figure .
View SolutionTwo curves are given at temperatures T1andT2 in an isothermal process, then-
View Solution


