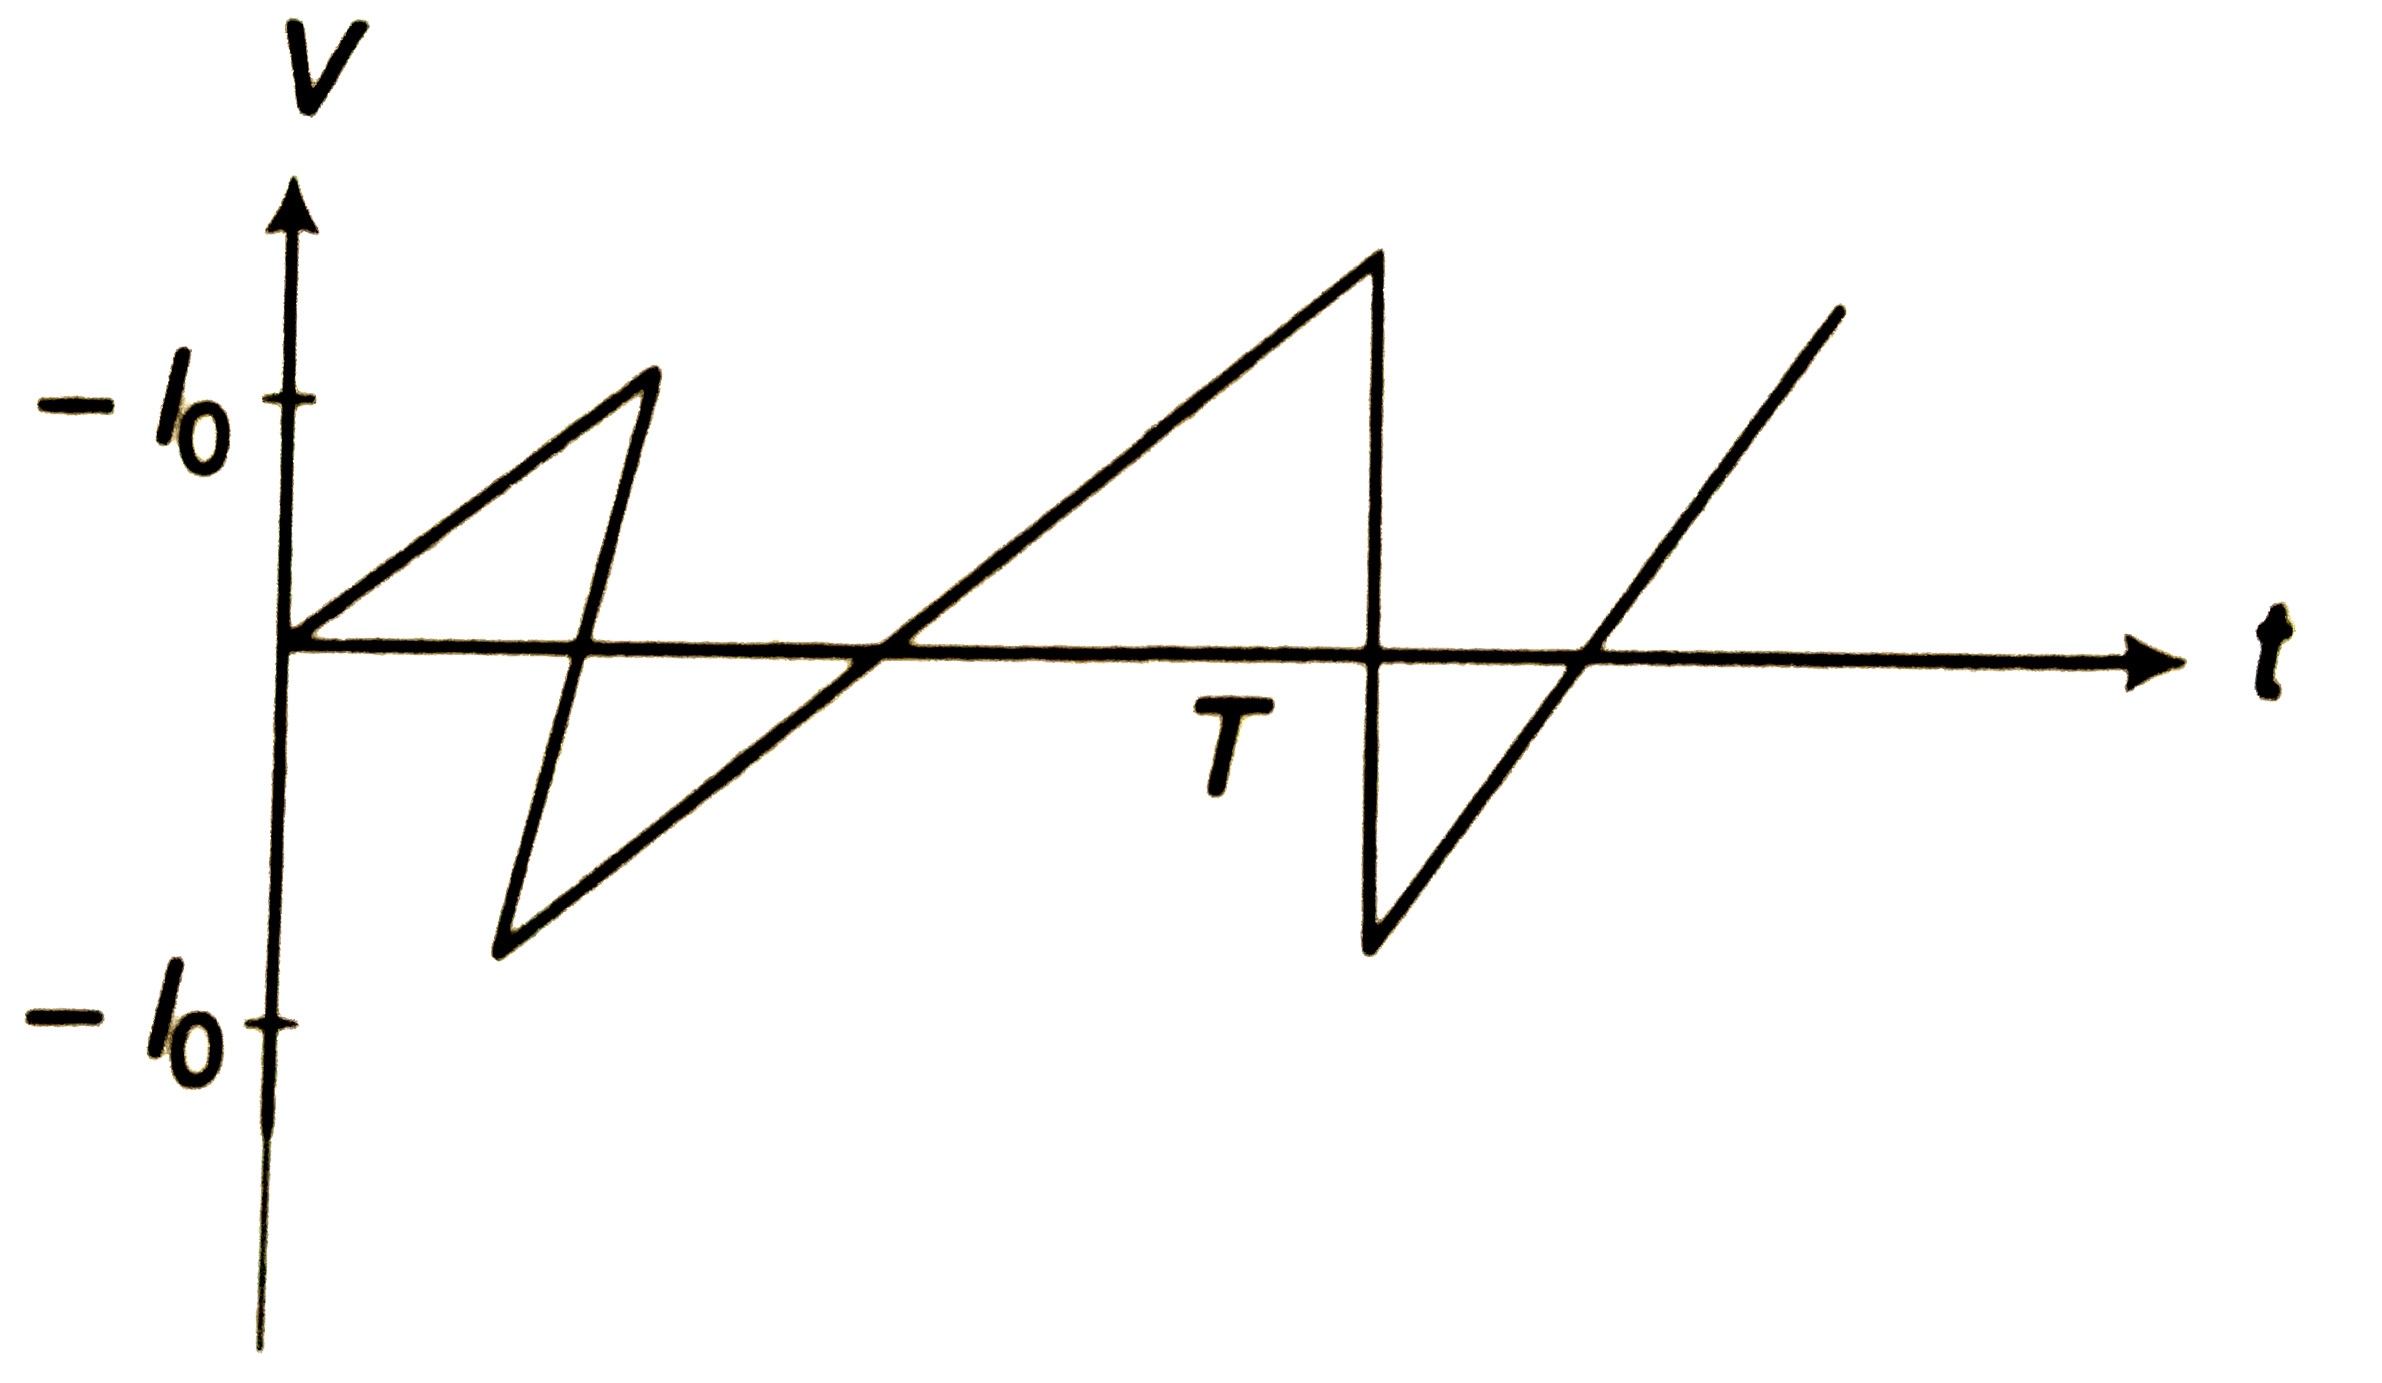
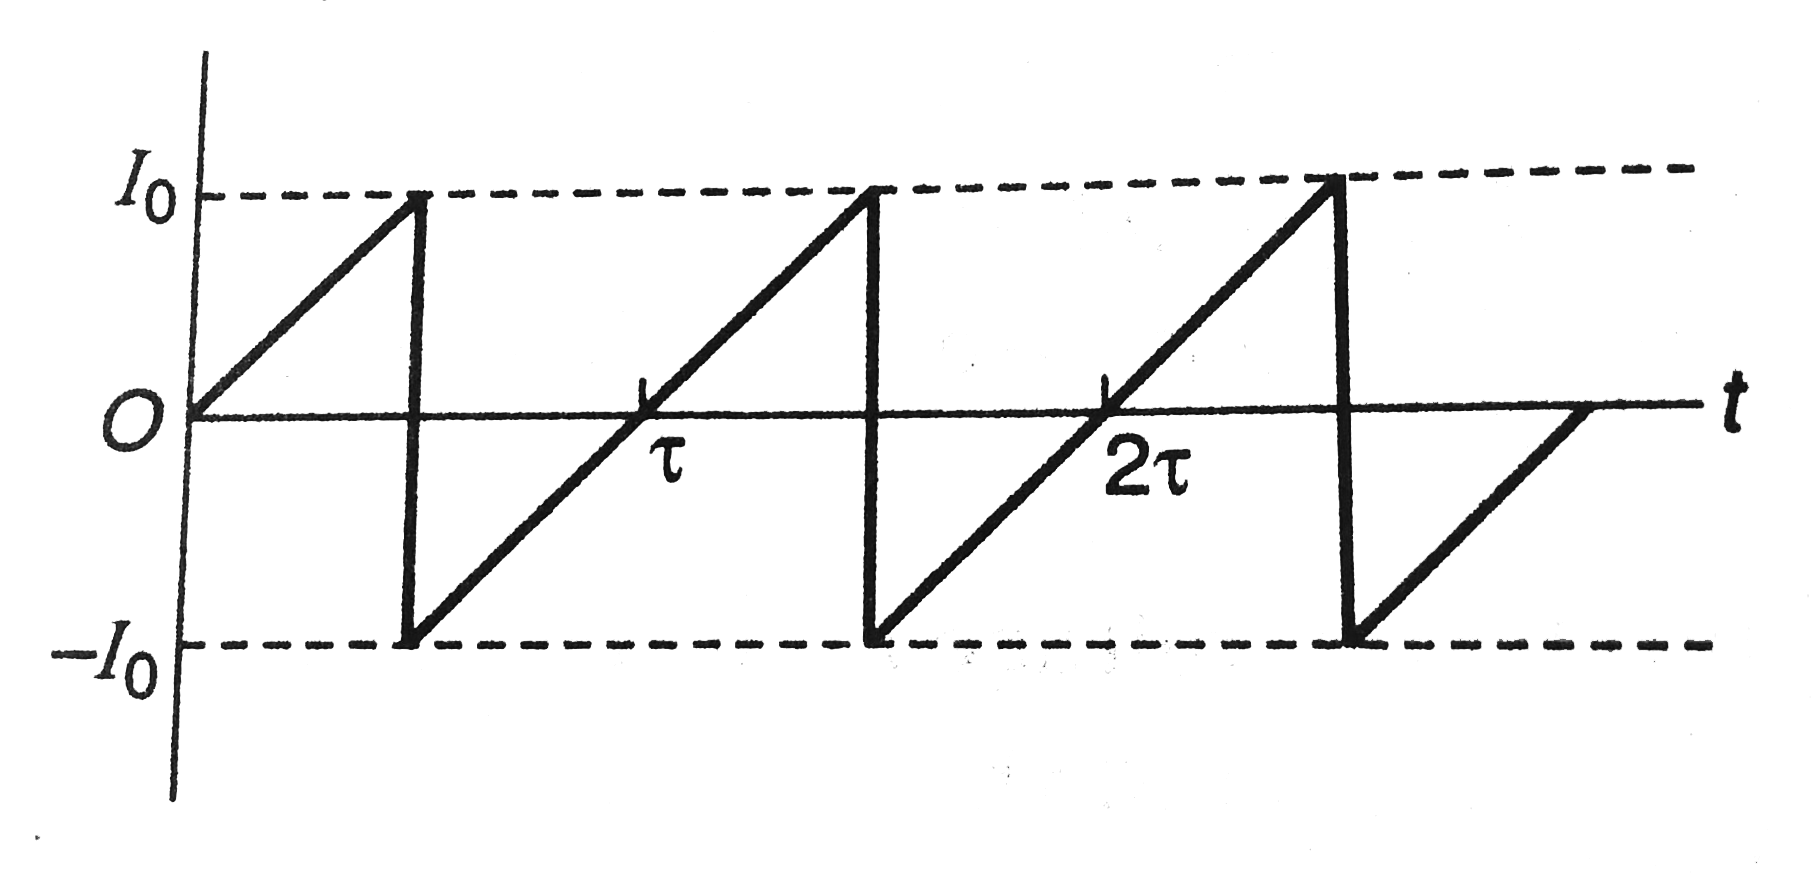
The average current in terms of l0 for the waveform shown is
l0
l03
l02
l04
The correct Answer is:C
As, I=2I0tT0 where, 0<t<T02
and I=2I0(tt0−1) where, T02<t<T0
∴Iav=2T∫T00I dt=2T0[∫T022I0tT0dt]
=2T20[2I0T202×4]=I22
Topper's Solved these Questions
- ELECTROMAGNETIC INDUCTIONBOOK - MHTCET PREVIOUS YEAR PAPERS AND PRACTICE PAPERSCHAPTER - ELECTROMAGNETIC INDUCTIONEXERCISE - Example 30
1 Videos
- ELECTROMAGNETIC INDUCTIONBOOK - MHTCET PREVIOUS YEAR PAPERS AND PRACTICE PAPERSCHAPTER - ELECTROMAGNETIC INDUCTIONEXERCISE - MHT CET CONER
34 Videos
- ELECTROMAGNETIC INDUCTIONBOOK - MHTCET PREVIOUS YEAR PAPERS AND PRACTICE PAPERSCHAPTER - ELECTROMAGNETIC INDUCTIONEXERCISE - Example 1
127 Videos
- ELASTICITY BOOK - MHTCET PREVIOUS YEAR PAPERS AND PRACTICE PAPERSCHAPTER - ELASTICITY EXERCISE - MHT CET CORNER
16 Videos
- ELECTRONS AND PROTONSBOOK - MHTCET PREVIOUS YEAR PAPERS AND PRACTICE PAPERSCHAPTER - ELECTRONS AND PROTONSEXERCISE - MHT CET CORNER
19 Videos
Similar Questions
Knowledge Check
The average value of current for the current shown for time period 0 to T2 s
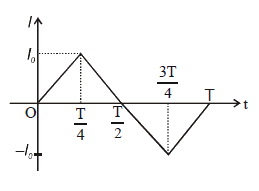 Al0√2Bl02Cl0√3Dl02√3
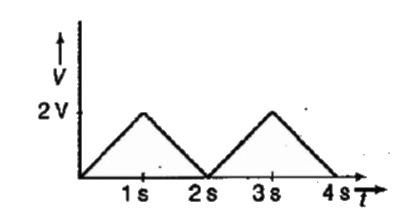
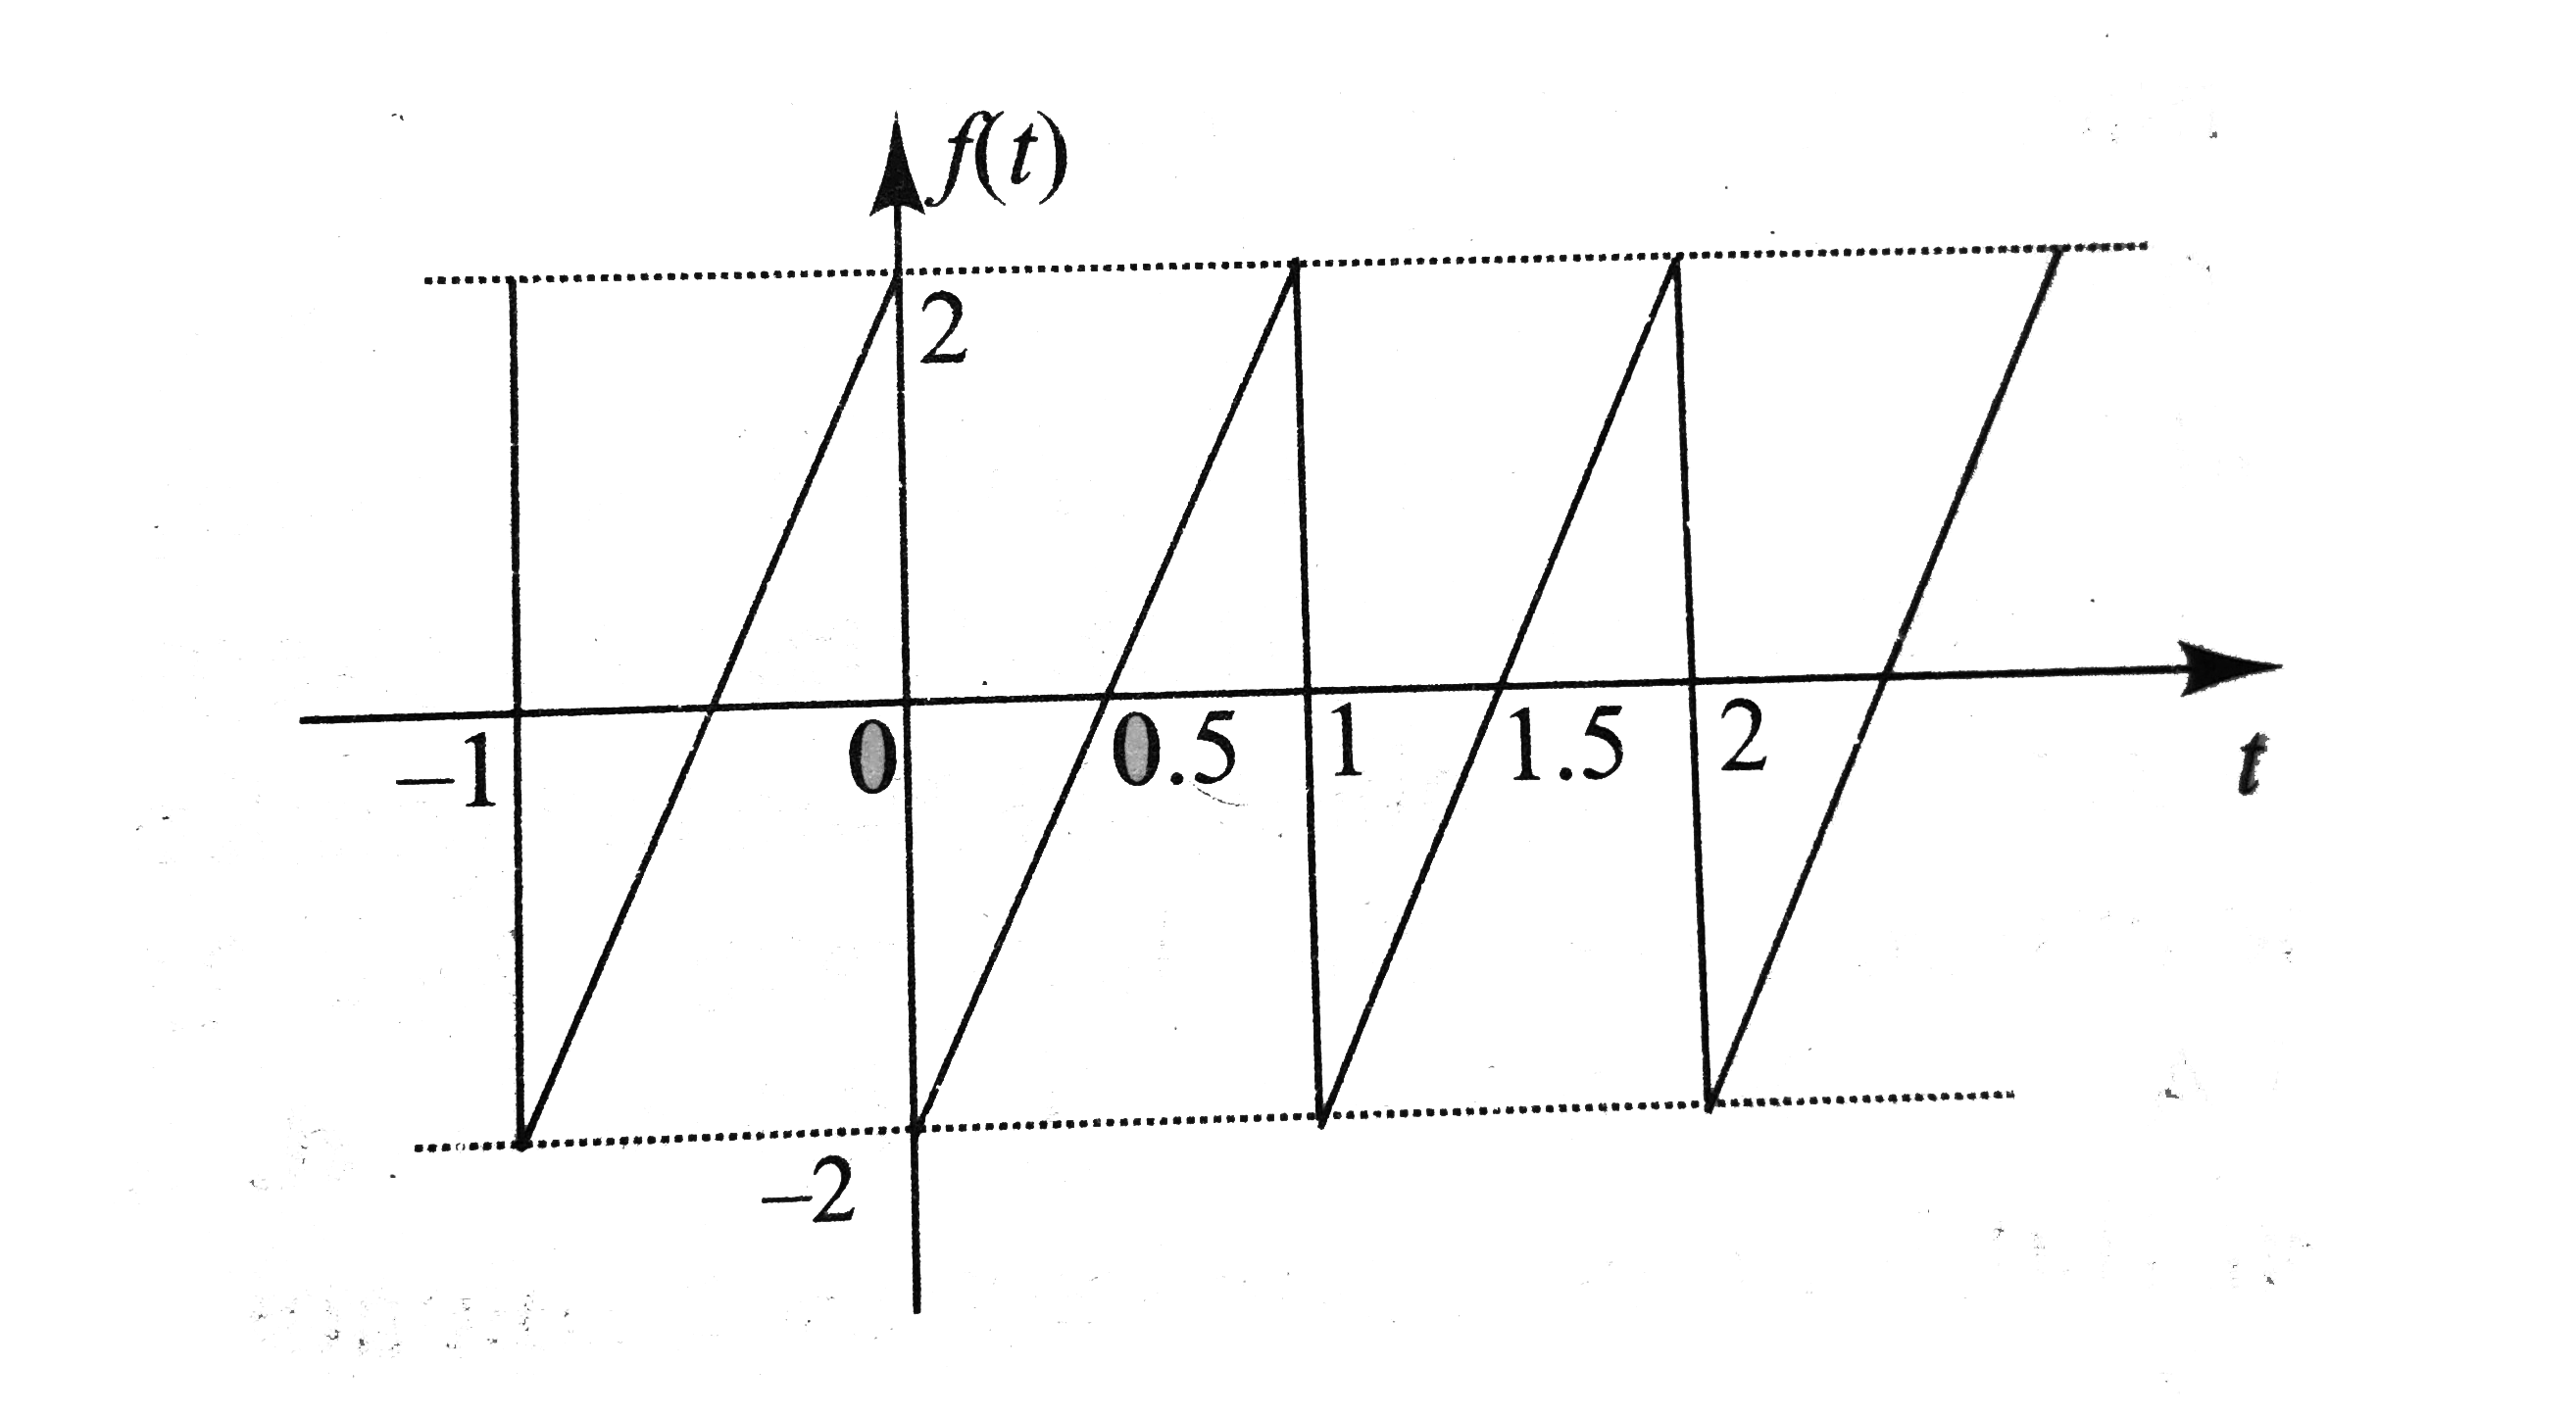
The rms value of voltage of the waveform shown below is ...... V.
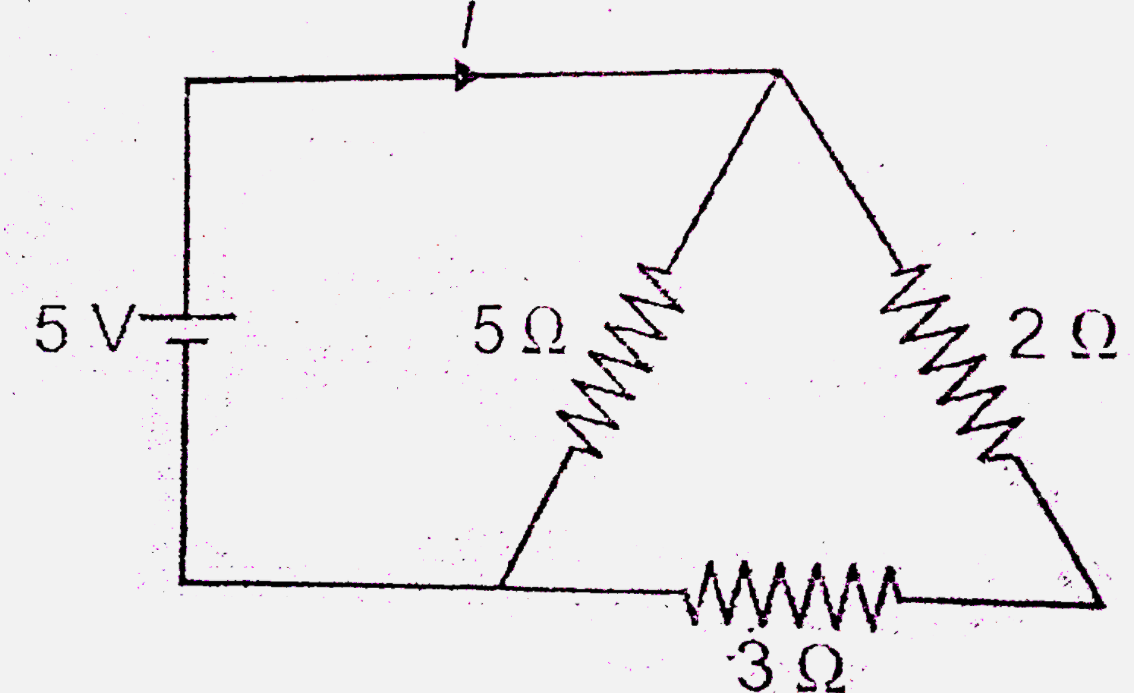
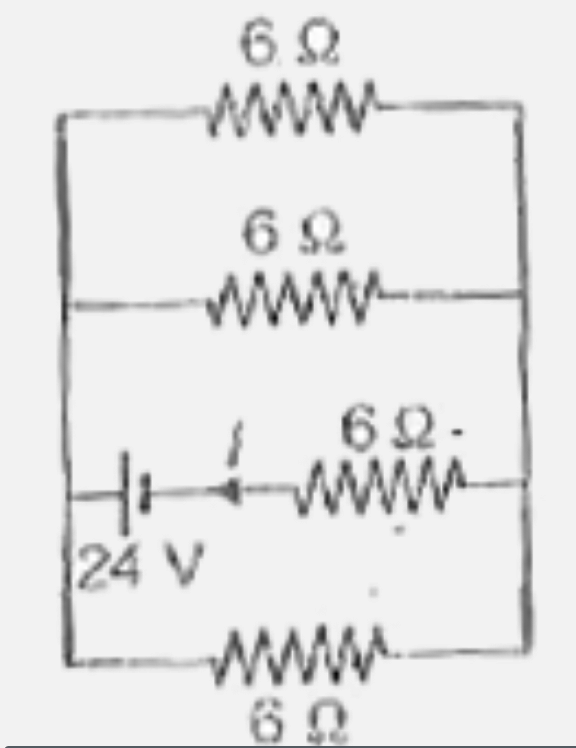
View SolutionThe current l through the cell in the network shown is
View SolutionCurrent l in the network shown is figure is
View SolutionThe current in a certain circuit varies with time as shown in figure. Find the average current and the rms current in terms of I0
 .
.
View SolutionThe average current of full cycle of a.c is, if peak current is i_(0)
View SolutionInput waveforms A and B as shown in Fig-l are applied to the combination of gates as shown in Fig-ll. Which of the waveforms shown in Fig.(i) to (iv) correctly represents the output waveform?
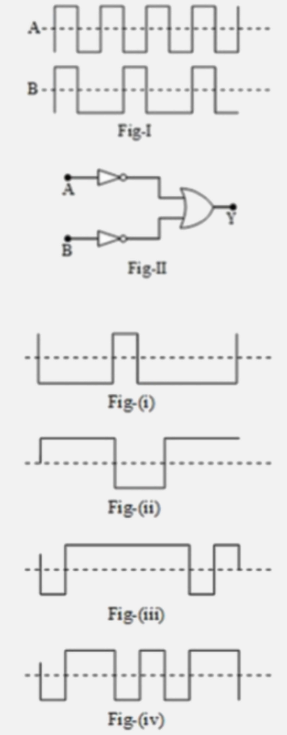
View SolutionInput waveforms A and B as shown in Fig-l are applied to the combination of gates as shown in Fig-ll. Which of the waveforms shown in Fig.(i) to (iv) correctly represents the output waveform?

View Solution

 .
.