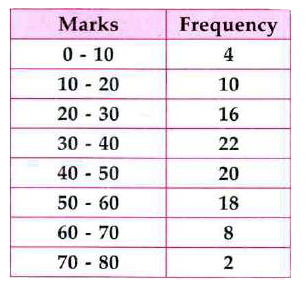
The following table gives the result of certain examination for 180 students .

i. Find the value of x.
Step by step video & image solution for The following table gives the result of certain examination for 180 students . i. Find the value of x. by Maths experts to help you in doubts & scoring excellent marks in Class 10 exams.
Updated on:21/07/2023Topper's Solved these Questions
- CHALLENGING QUESTIONS BOOK - TARGET PUBLICATIONCHAPTER - CHALLENGING QUESTIONS EXERCISE - Chapter 5 : Probability
8 Videos
- BOARD QUESTION PAPER: MARCH 2019BOOK - TARGET PUBLICATIONCHAPTER - BOARD QUESTION PAPER: MARCH 2019EXERCISE - (Solve the following questions (Any one):
4 Videos
- CIRCLEBOOK - TARGET PUBLICATIONCHAPTER - CIRCLEEXERCISE - Chapter Assessment
9 Videos
Similar Questions
The following tale gives the result of certain examination for 180 students. Find the value of x and draw histogram.

View SolutionThe following table is based on the marks of the first term examination of 10th class students . Show the information by a histogram. Also, draw a frequency polygon with the help of the histogram :

View Solution
Knowledge Check
Which of the following can affect the results of student in the examination?
A(a) Number of Class works & Home works givenB(b) Working hours and days of the schoolC(c) Number of teacher-parent meetsD(d) All of the above
The following table is based on the marks of the first term examination of 10 th class student. Show the information by a histogram. Also, draw a frequency polygon with the help of the histogram:

View SolutionFind the value of :30%of 180
View SolutionFollowing data gives the marks obtained by 100 students in a test. Find the median

View SolutionThe following table gives the marks scored by 100 students in an entrance examination

Represent this data in the form of a histogram.
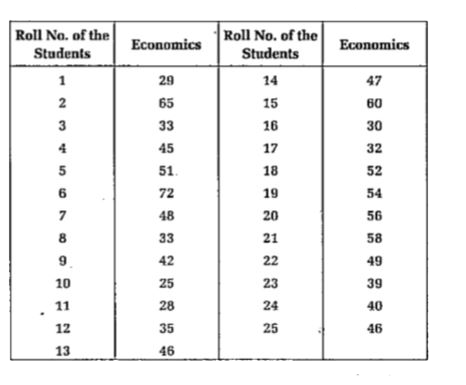
View SolutionThe following table given the marks obtained by abatch of 25 students in a certain class test in Economics. Compute the median from the following table :

View SolutionThe following table shows the classification of percentages of marks of students and the number of students. Draw a frequency polygon from the table.

View SolutionThe following table represent marks obtained by 100 students in a test.

Find mean marks of the students.
View Solution
