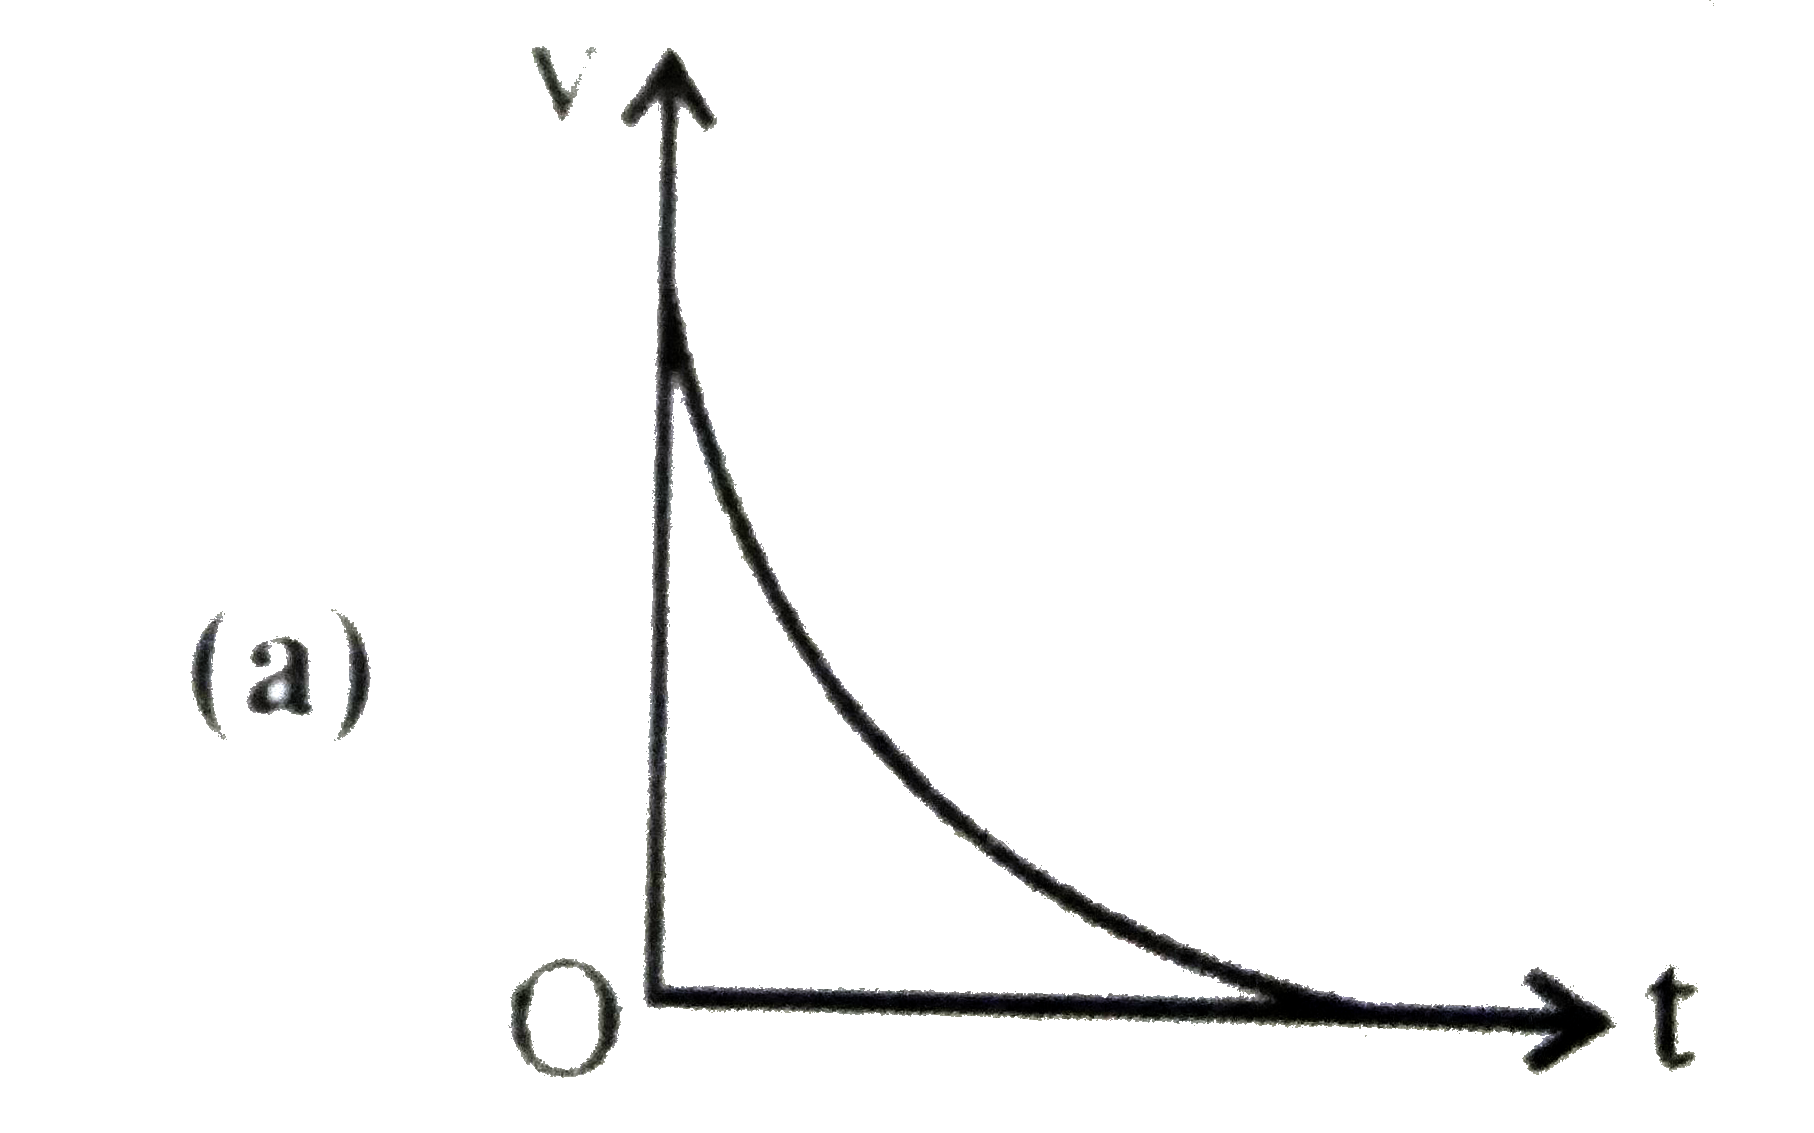
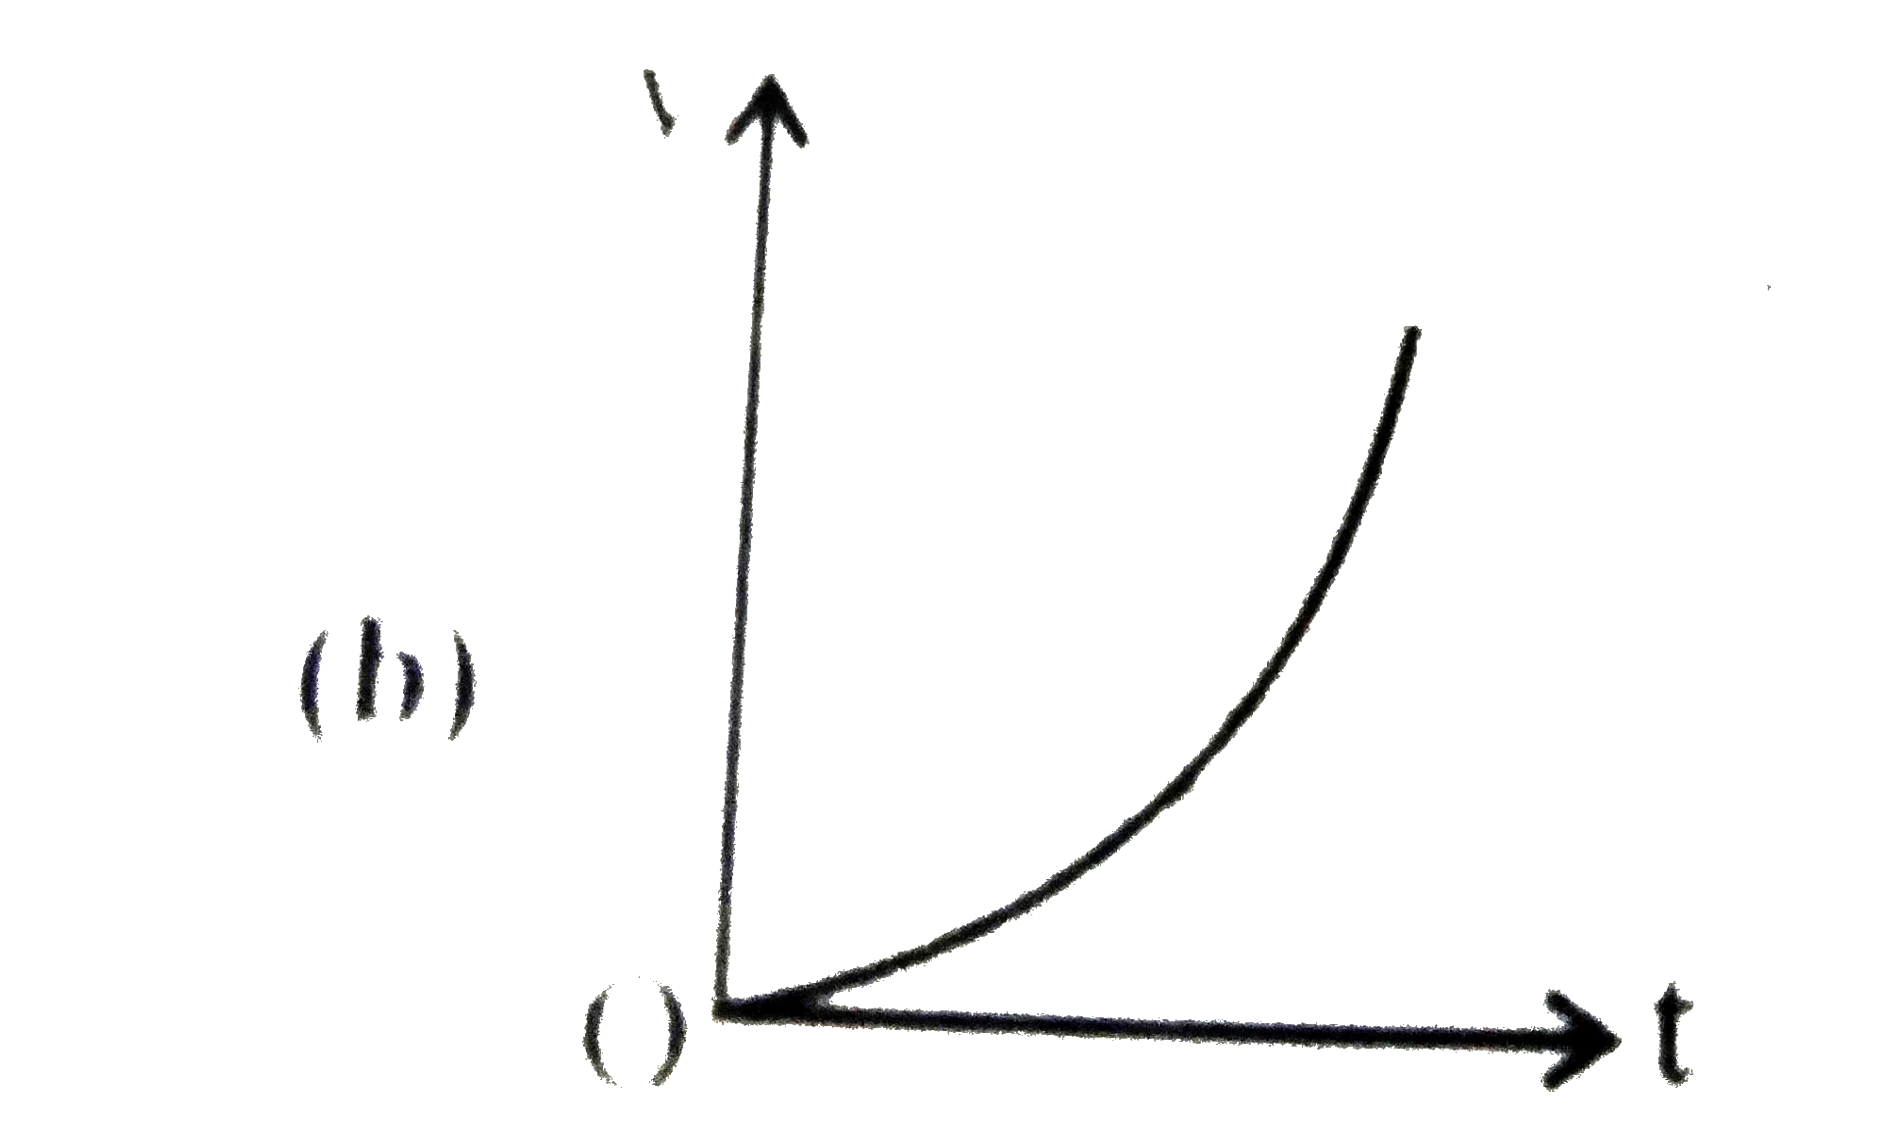
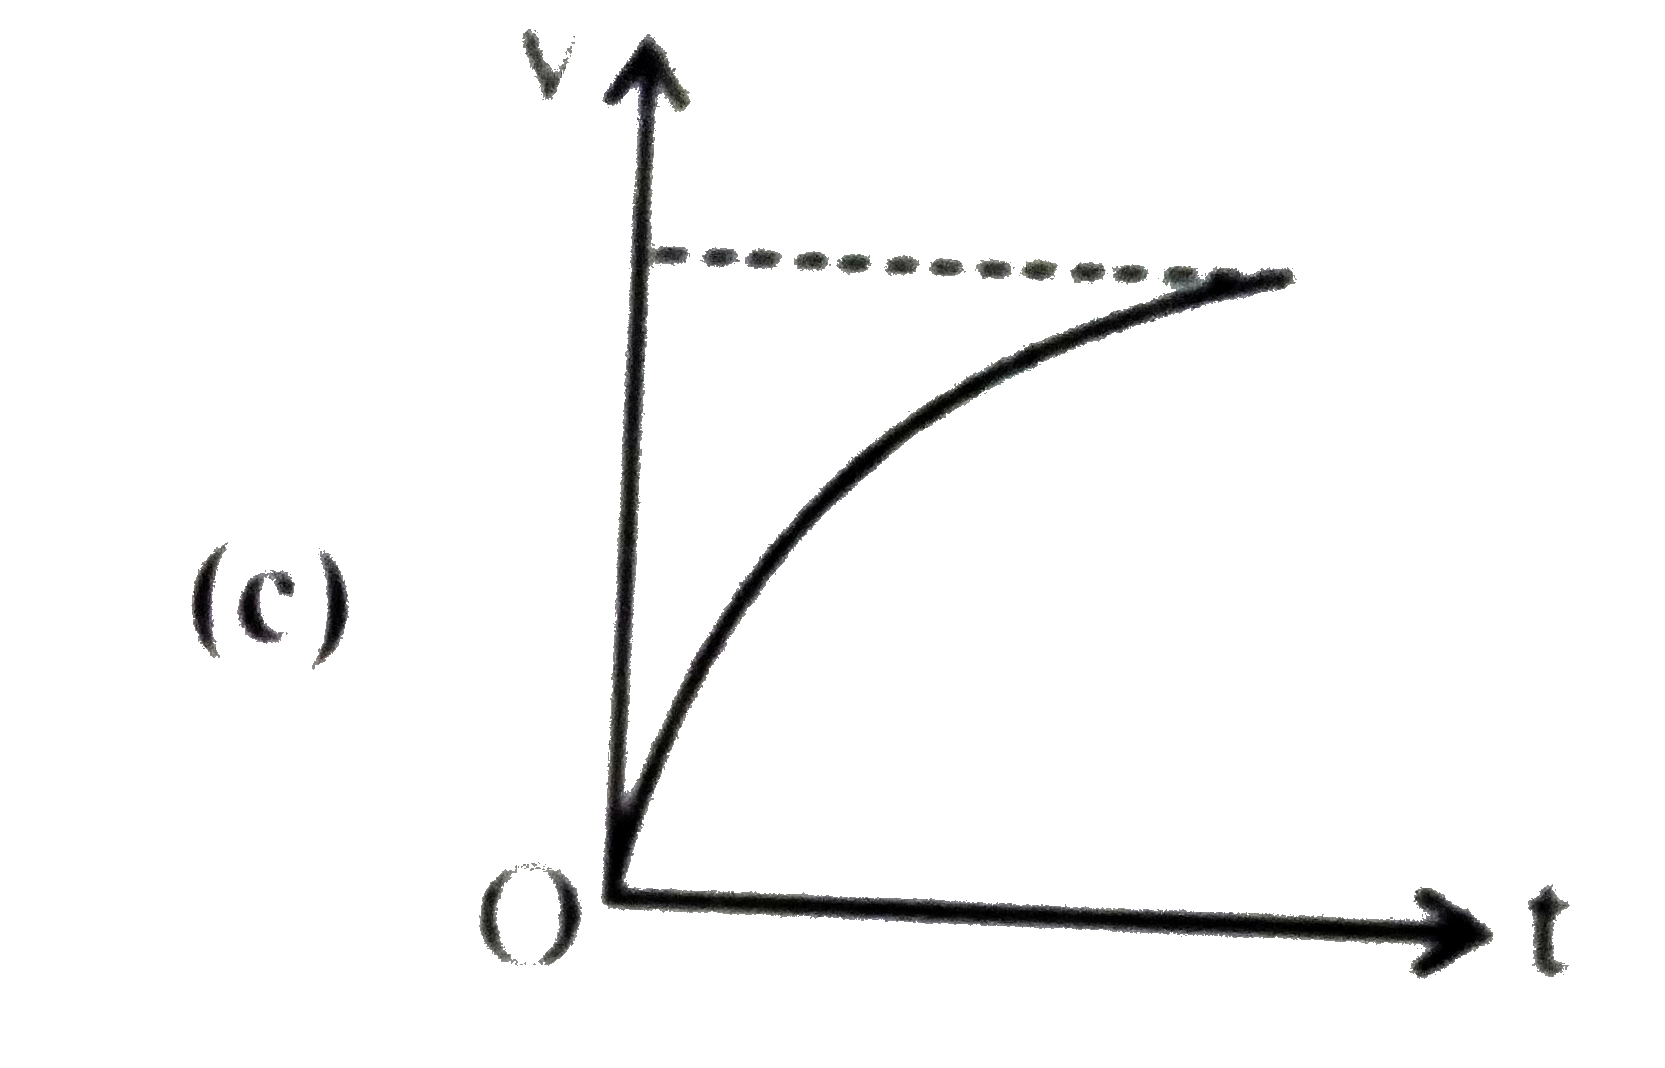
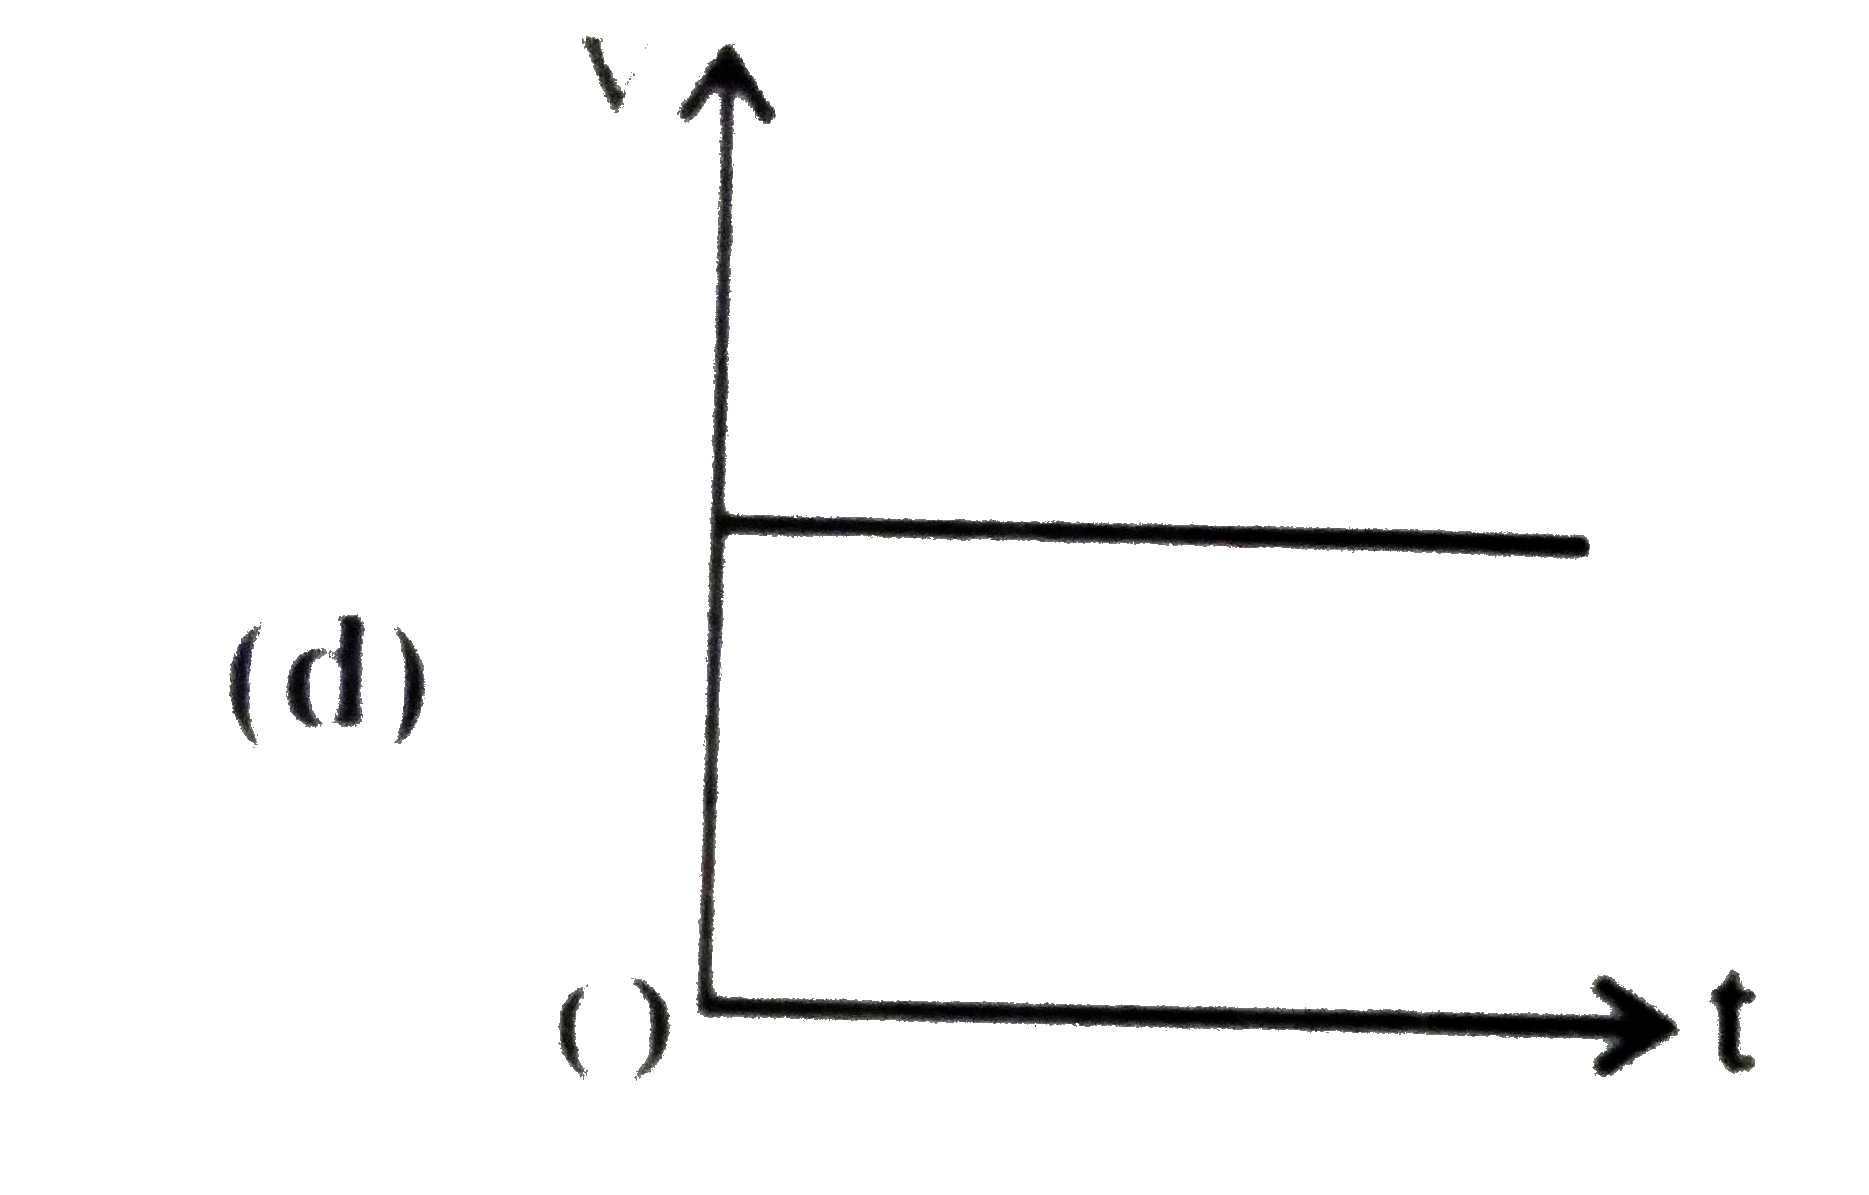
In viscosity experiment which one is the graph between, velocity of time for ball falling in viscous fluid .
The correct Answer is:B
The correct answer is graph (C )
Initially the velocity of the body falling in a viscous fluid increase but after some time, the body moves with a constant velocity known as terminal velocity
Topper's Solved these Questions
- FRICTIONAL IN SOLIDS AND LIQUIDS BOOK - MARVEL PUBLICATIONCHAPTER - FRICTIONAL IN SOLIDS AND LIQUIDS EXERCISE - TEST YOUR GRASP
10 Videos
- FORCE, WORK AND TORQUEBOOK - MARVEL PUBLICATIONCHAPTER - FORCE, WORK AND TORQUEEXERCISE - TEST YOUR GRASP
10 Videos
- MAGNETIC EFFECT OF ELECTRIC CURRENT BOOK - MARVEL PUBLICATIONCHAPTER - MAGNETIC EFFECT OF ELECTRIC CURRENT EXERCISE - TEST YOUR GRASP
10 Videos
Similar Questions
Distinguish between the velocity profiles of non-viscous and viscous liquids.
View SolutionDefine coefficient of viscosity and give its SI unit. On what factors does the terminal velocity of a spherical ball falling through a viscous liquid depend ? Derive the formula υt=2r2g9η(ρ−ρ1) where the symbols have their usual meanings.
View Solution
Knowledge Check
Which of the graph between velocity and time is correct ?
AABBCCDDWhich of the following is the graph between the time and the velocity of a body moving in a viscous fluid?
A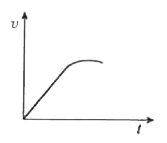 B
B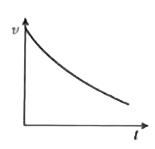 C
C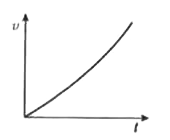 D
D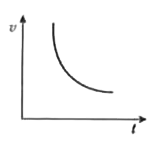
Which of the following is the incorrect graph for a sphere falling in a viscous liquid?
A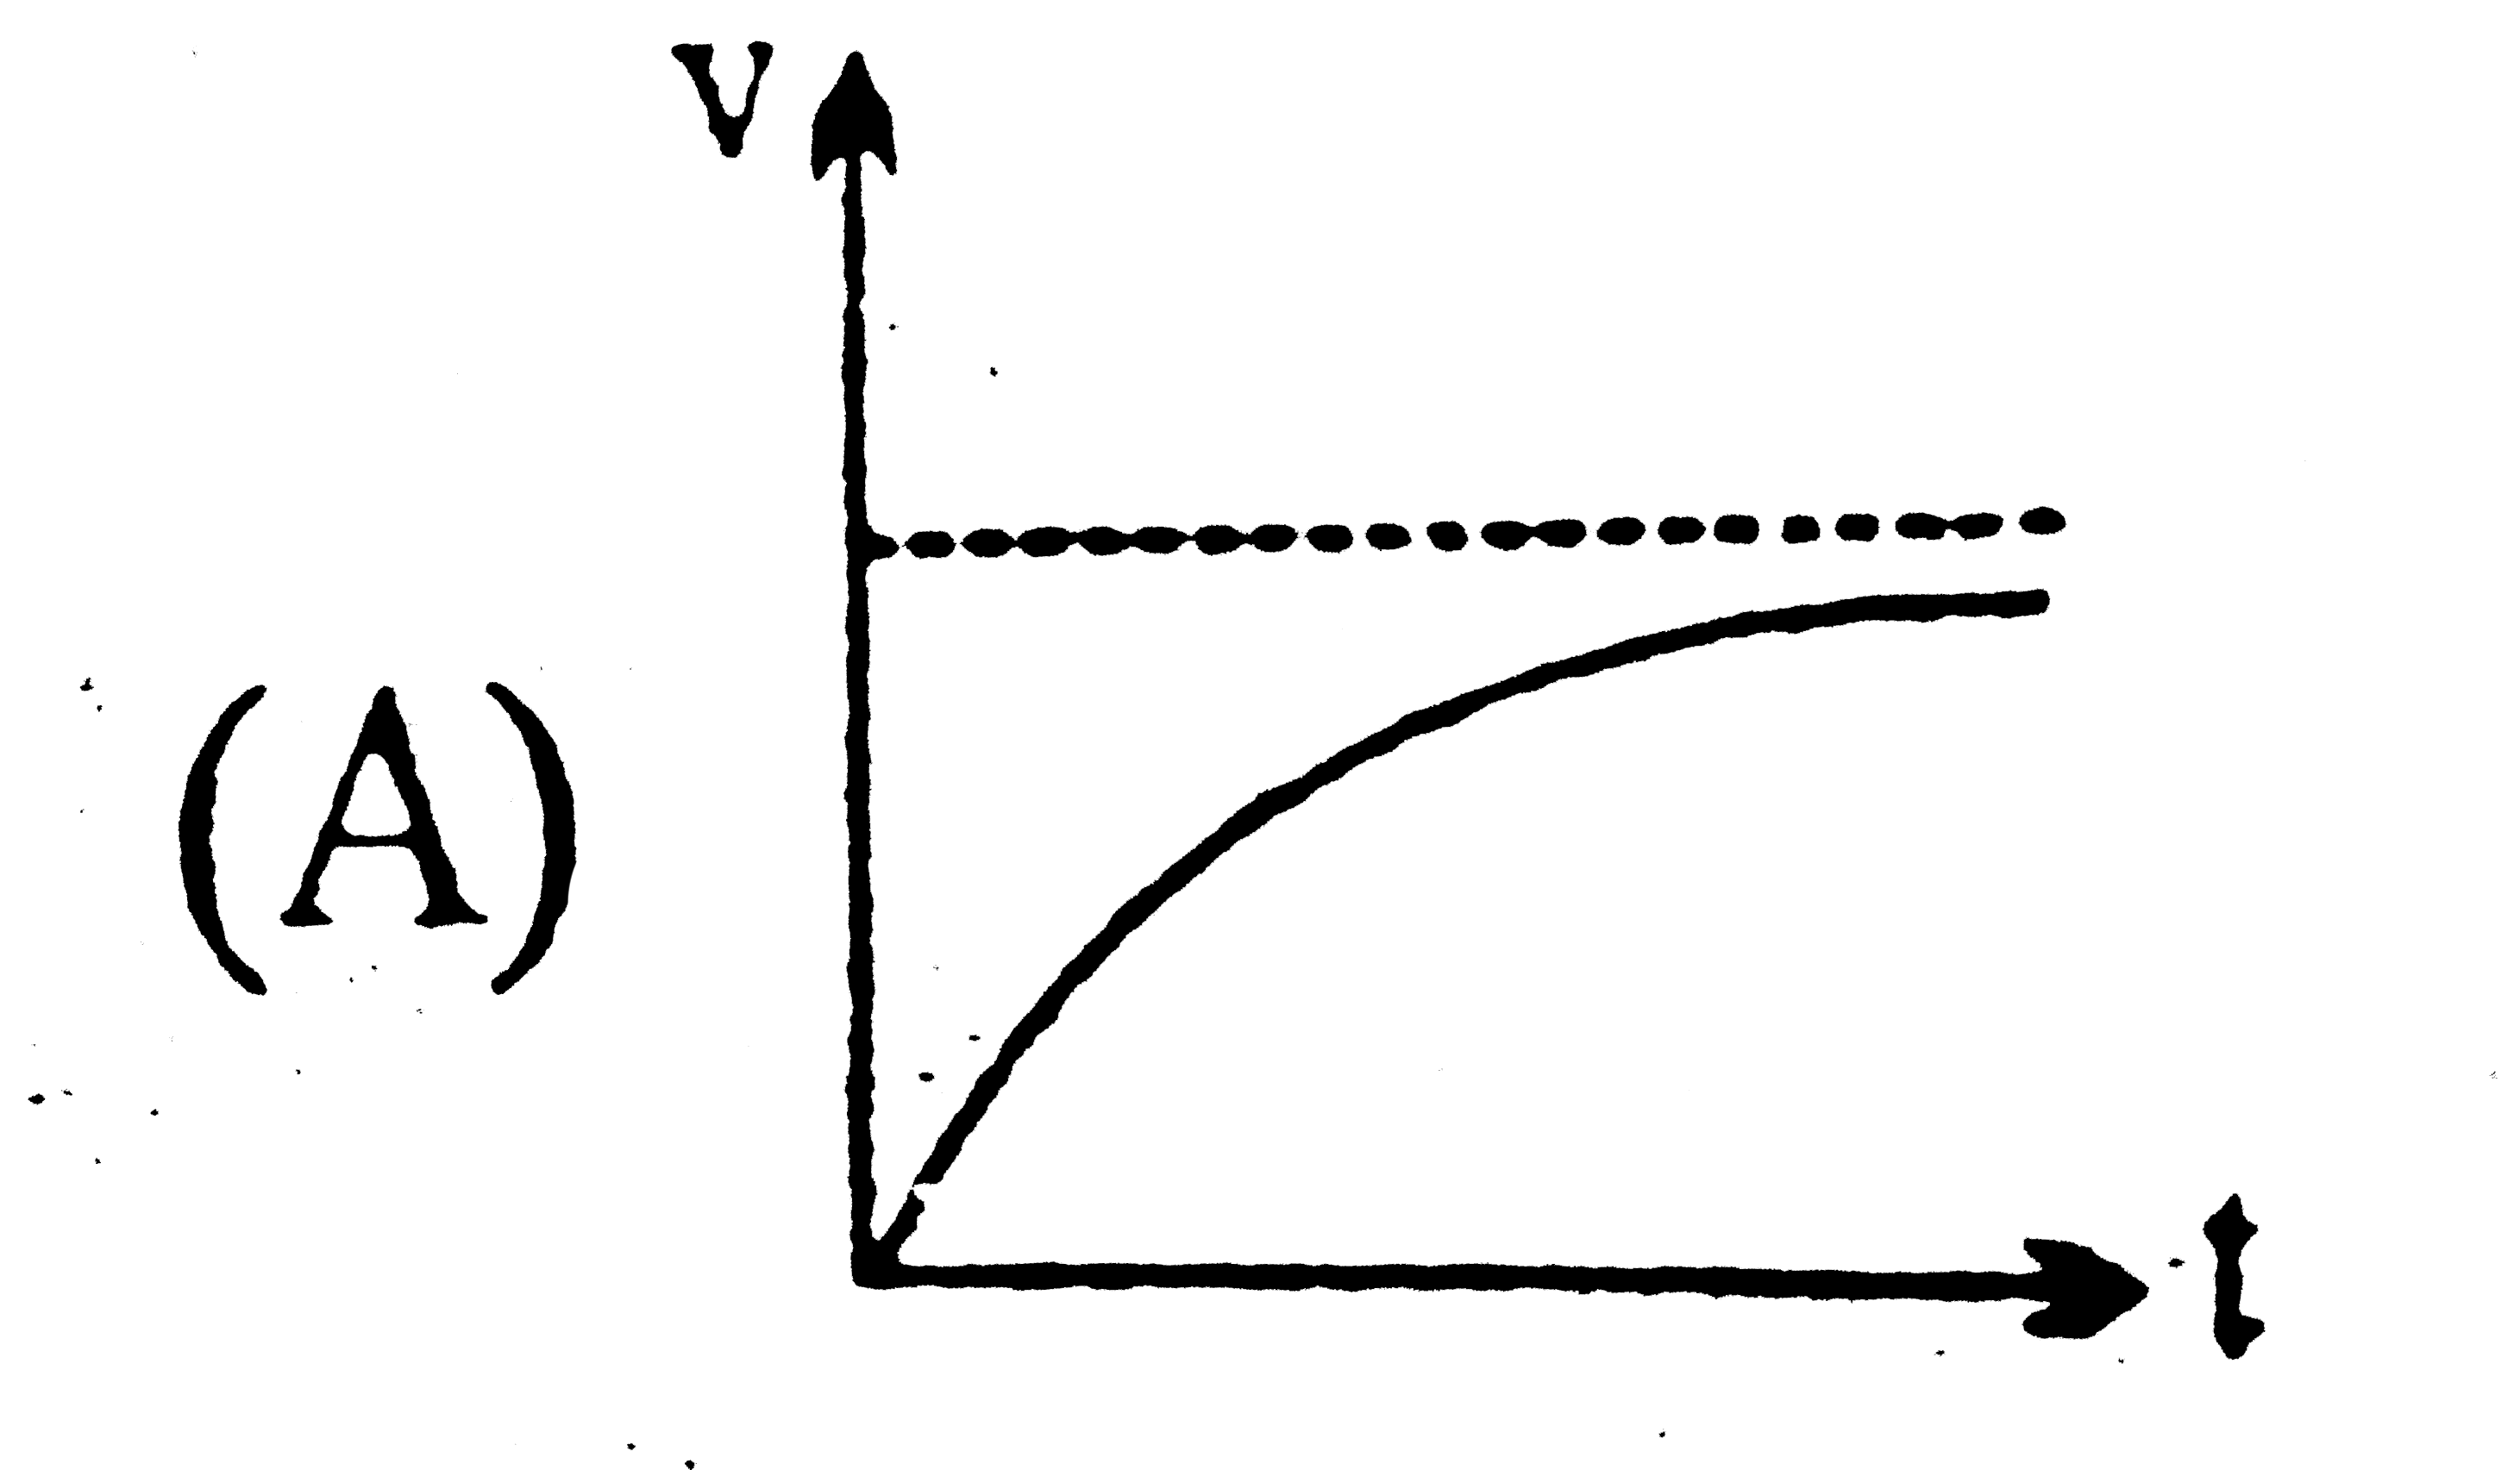 B
B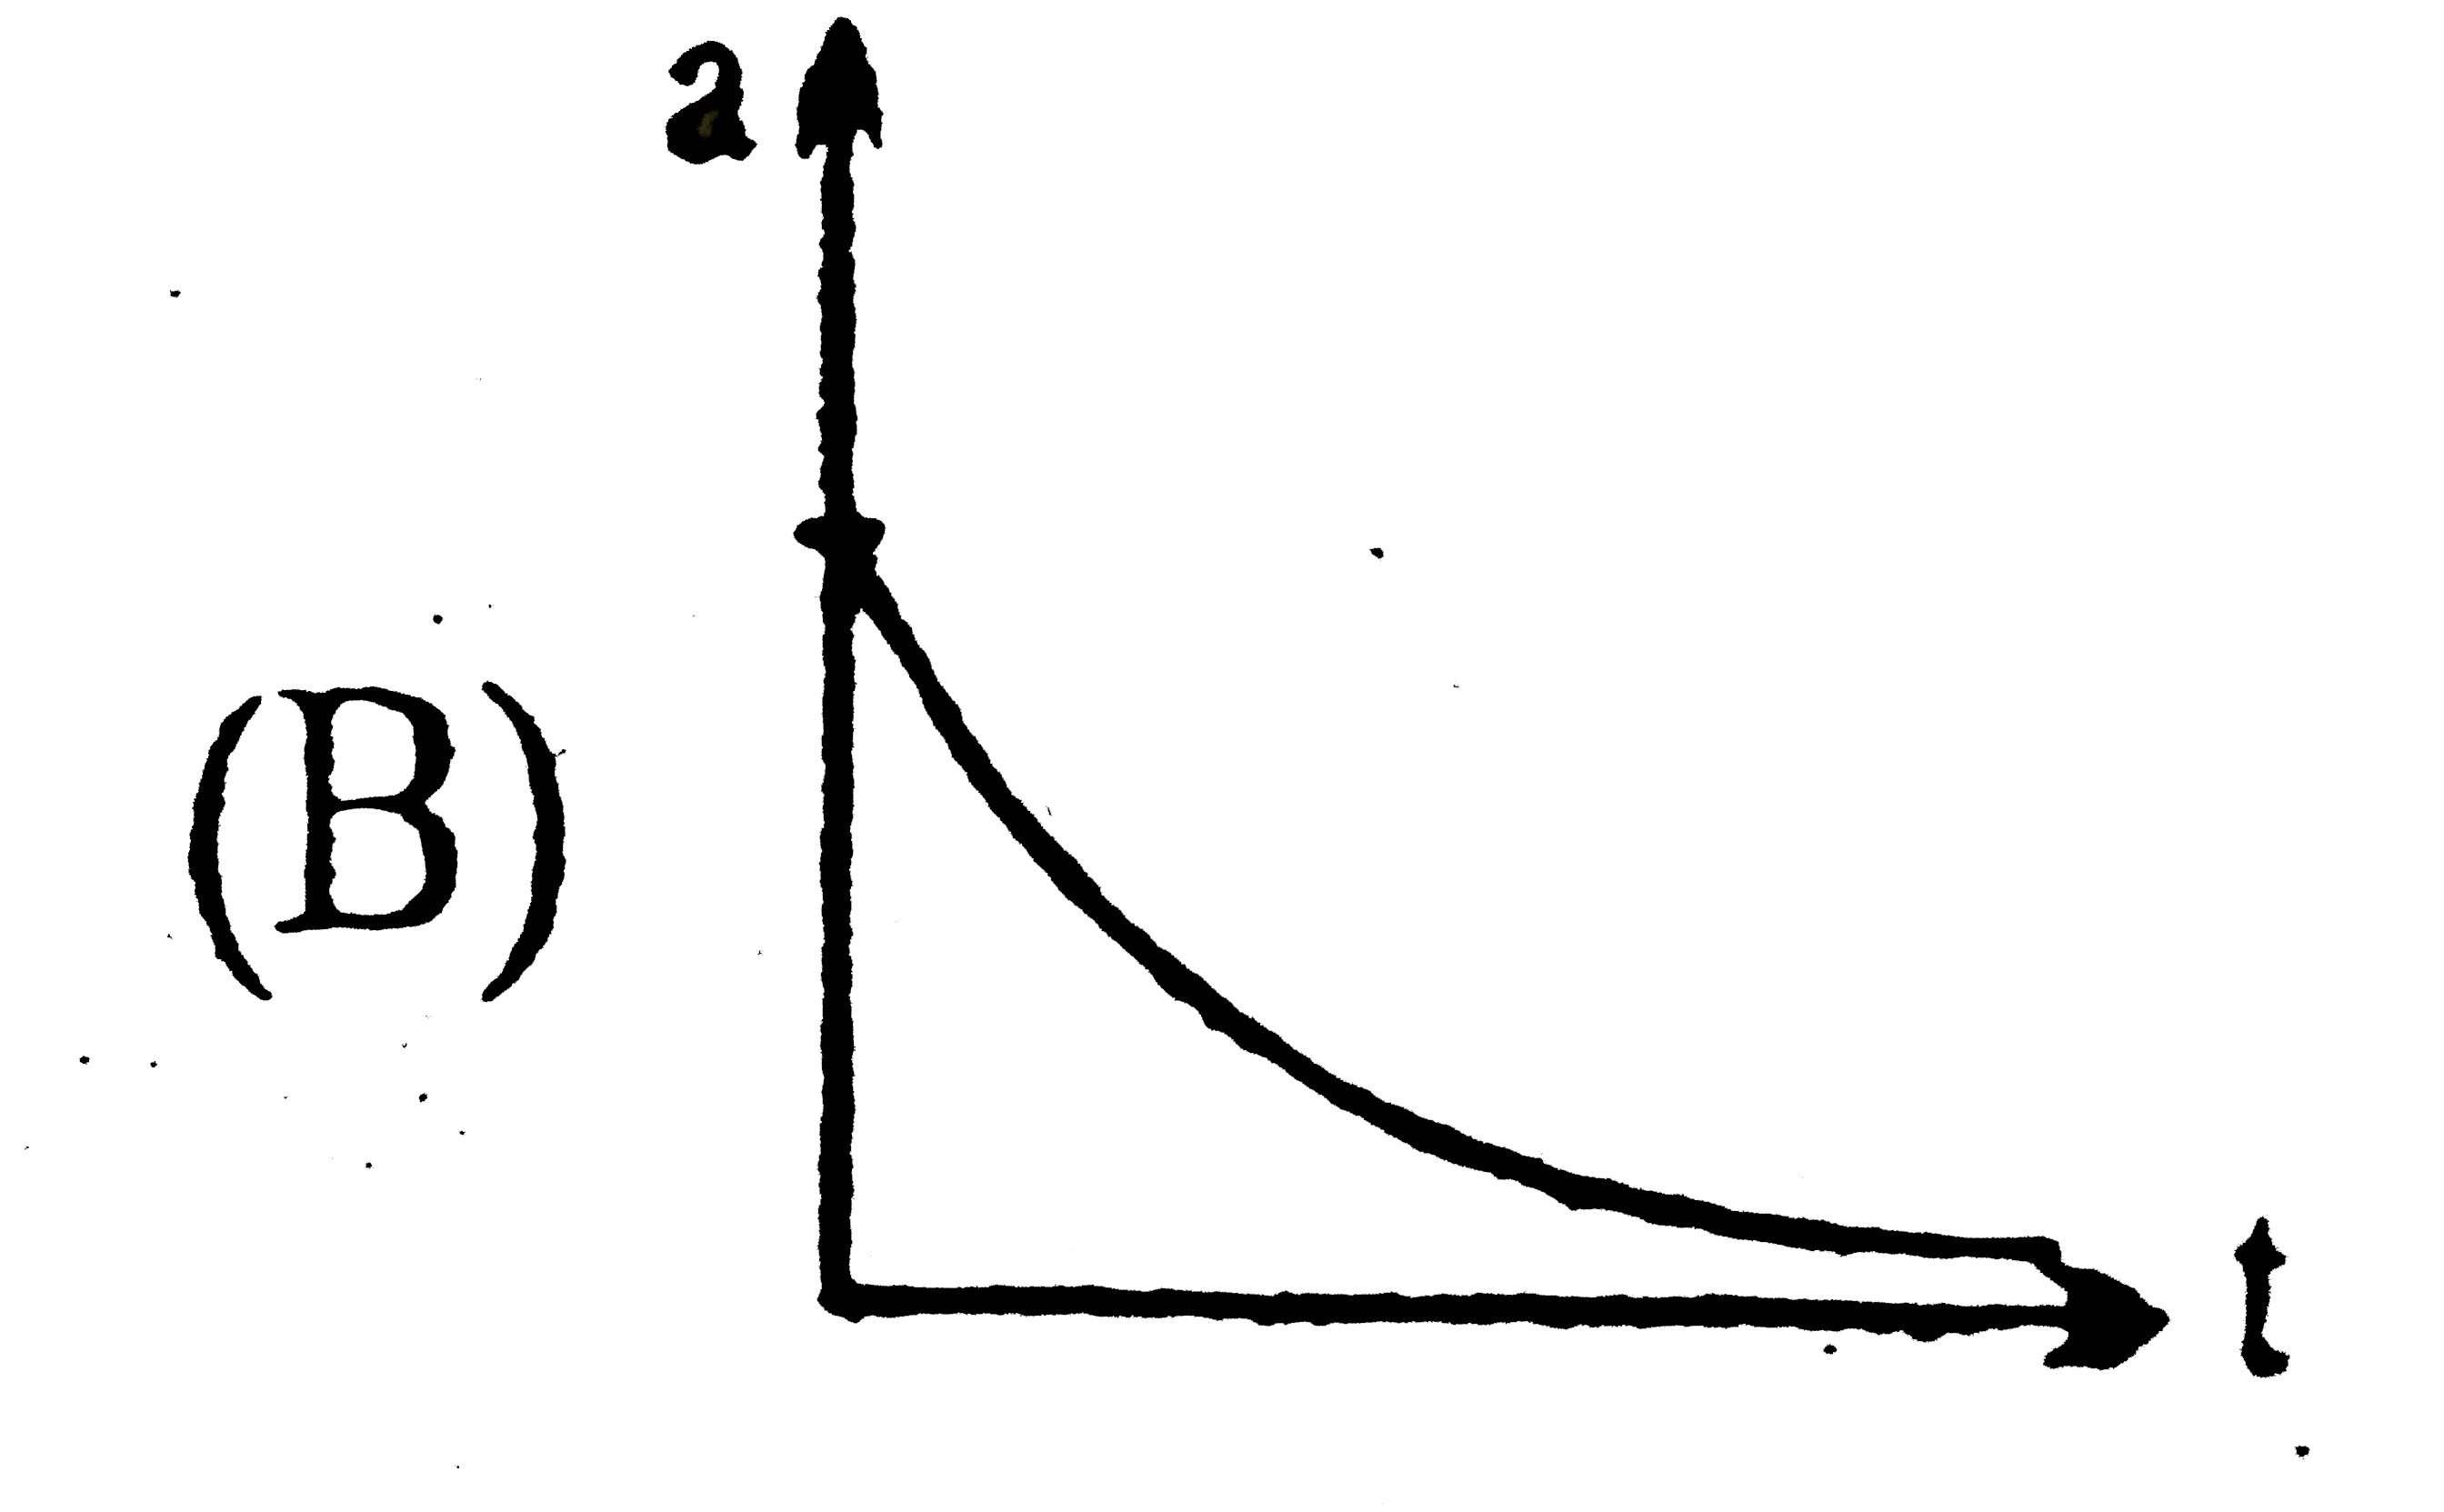 C
C D
D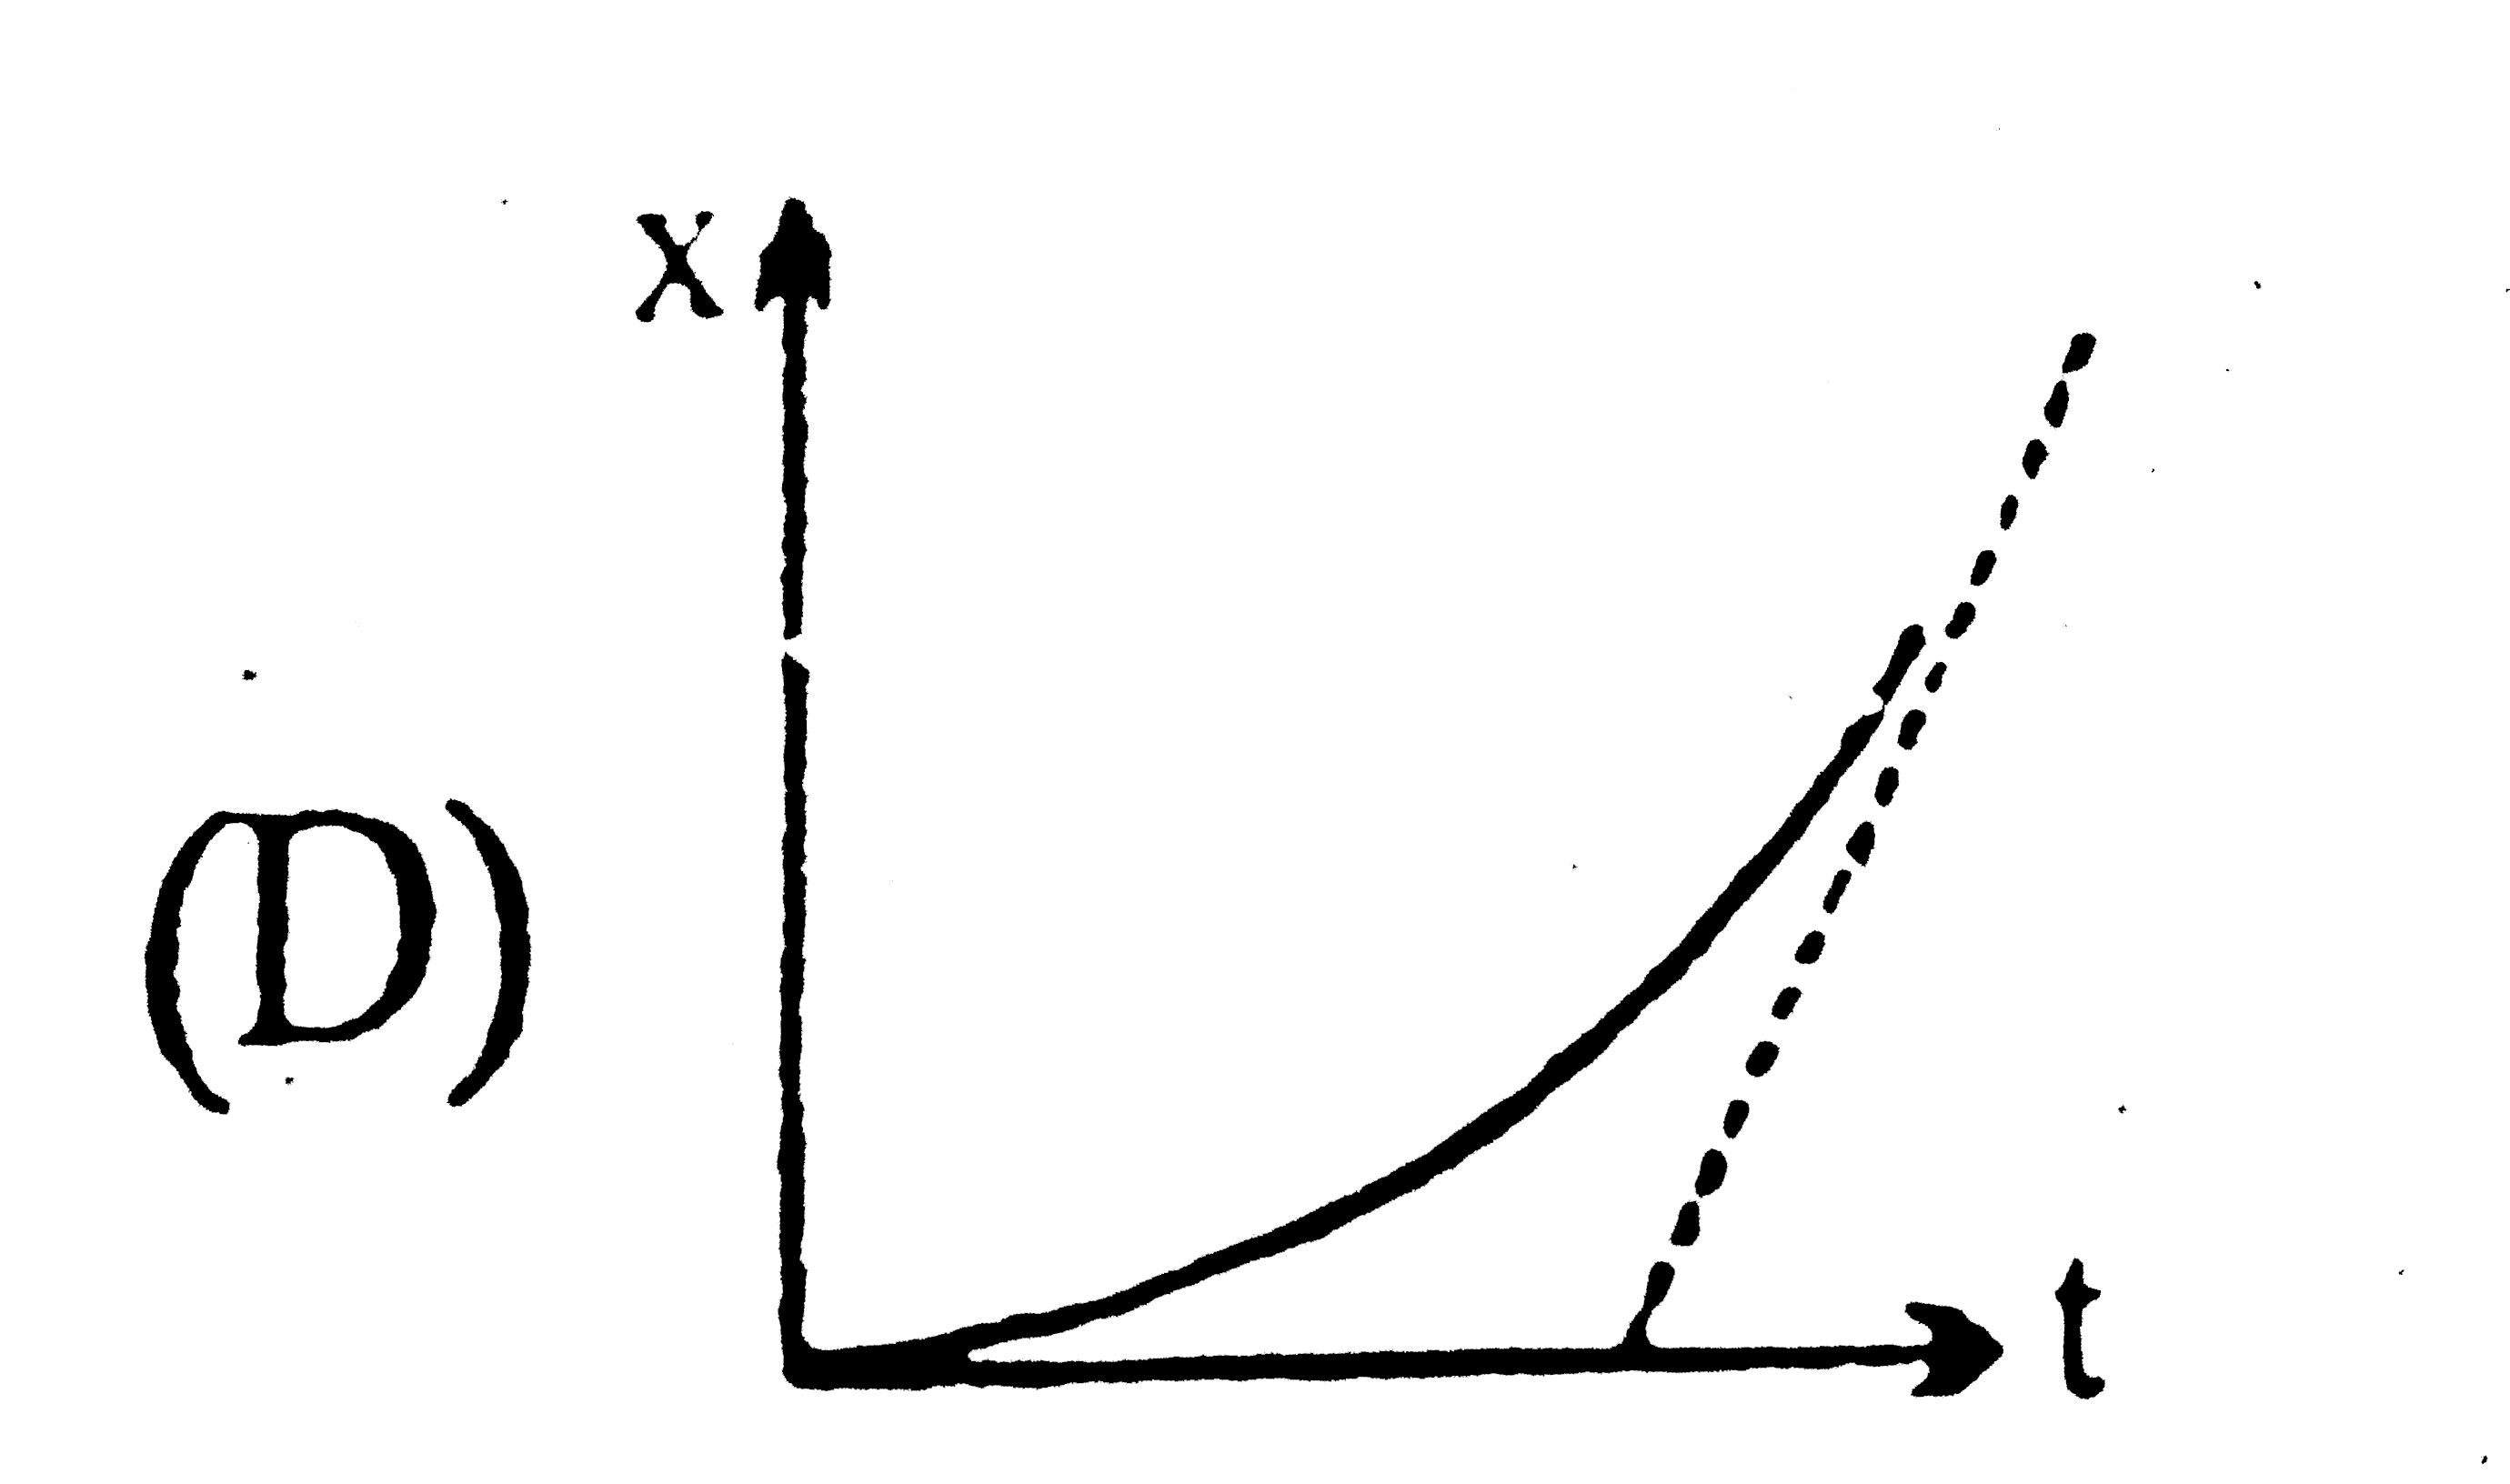
Define terminal velocity and obtain an expression for the terminal velocity in case of a sphere falling through a viscous liquid. Also show graphically the variation of velocity with time.
View SolutionWhich of the following shows the velocity (v) - time (t) graph for a falling apple?
View SolutionFrom amongst the following curves, which one shows the variation of the velocity v with time t for a small sized spherical body falling vertically in a long column of a viscous liquid
View SolutionThe terminal velocity of a sphere of radius R, falling in a viscous fluid, is proportional to
View SolutionWhich of the following shows velocity (v) - time (t) graph for falling apple?
View Solution
