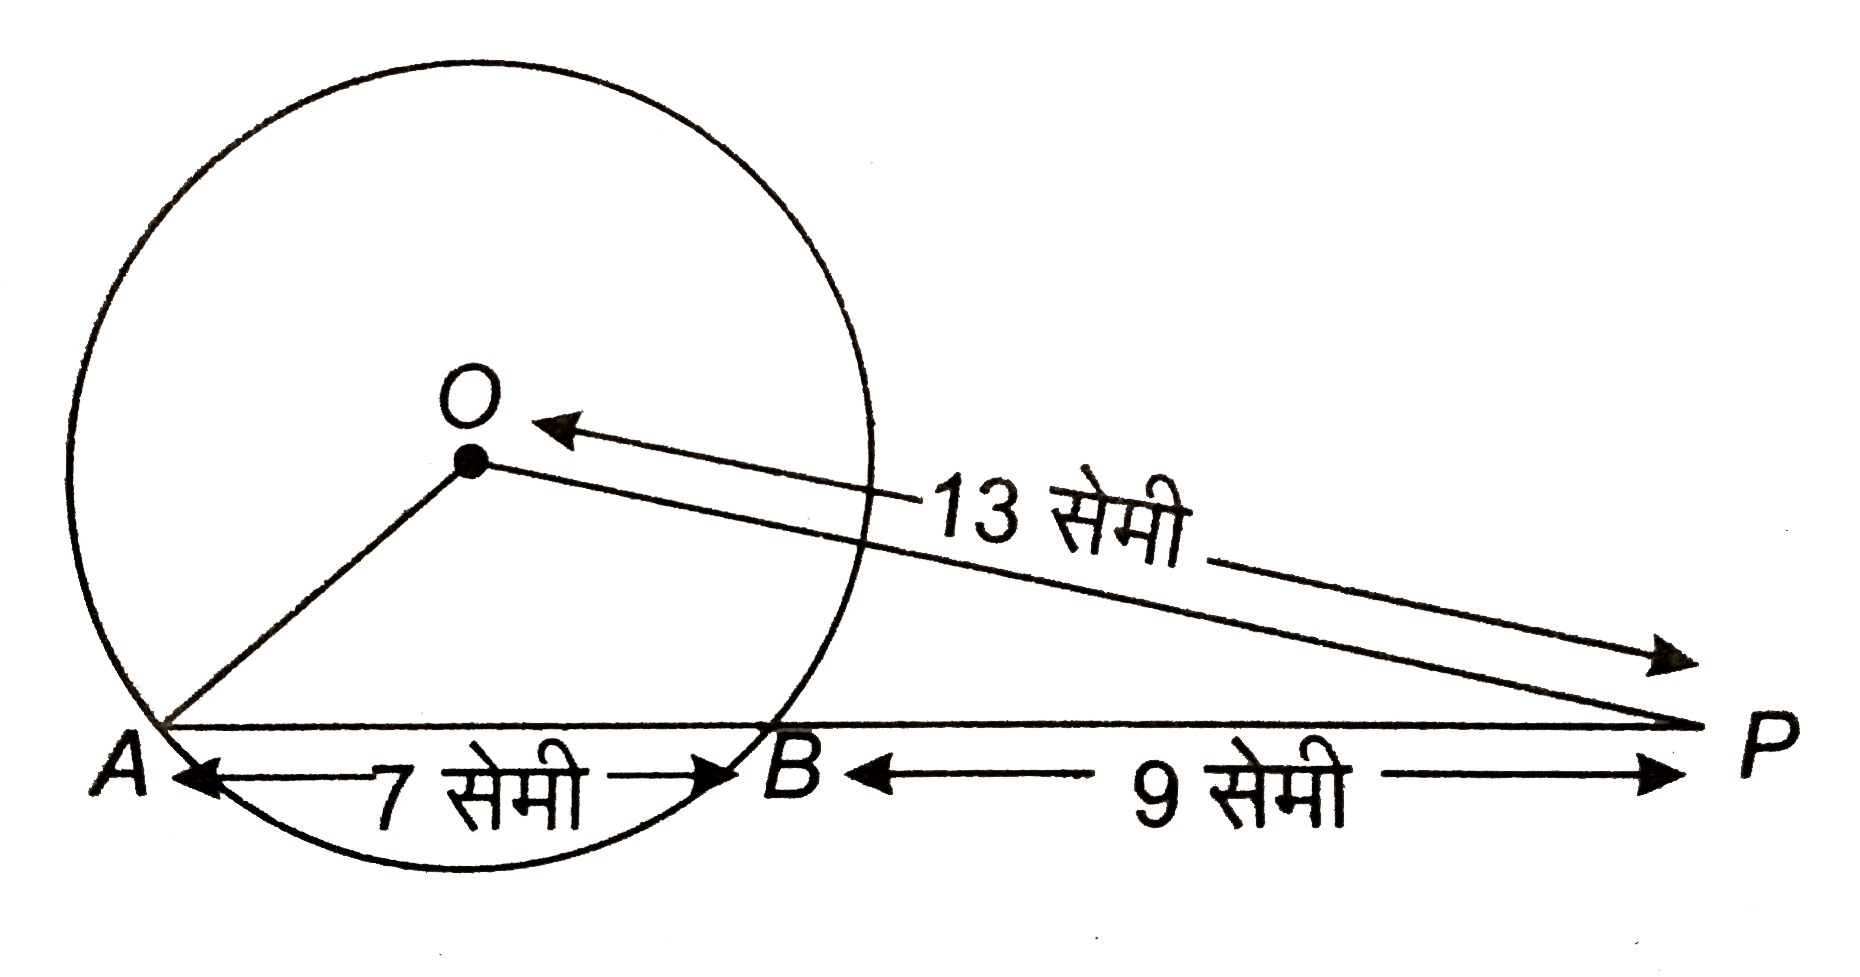
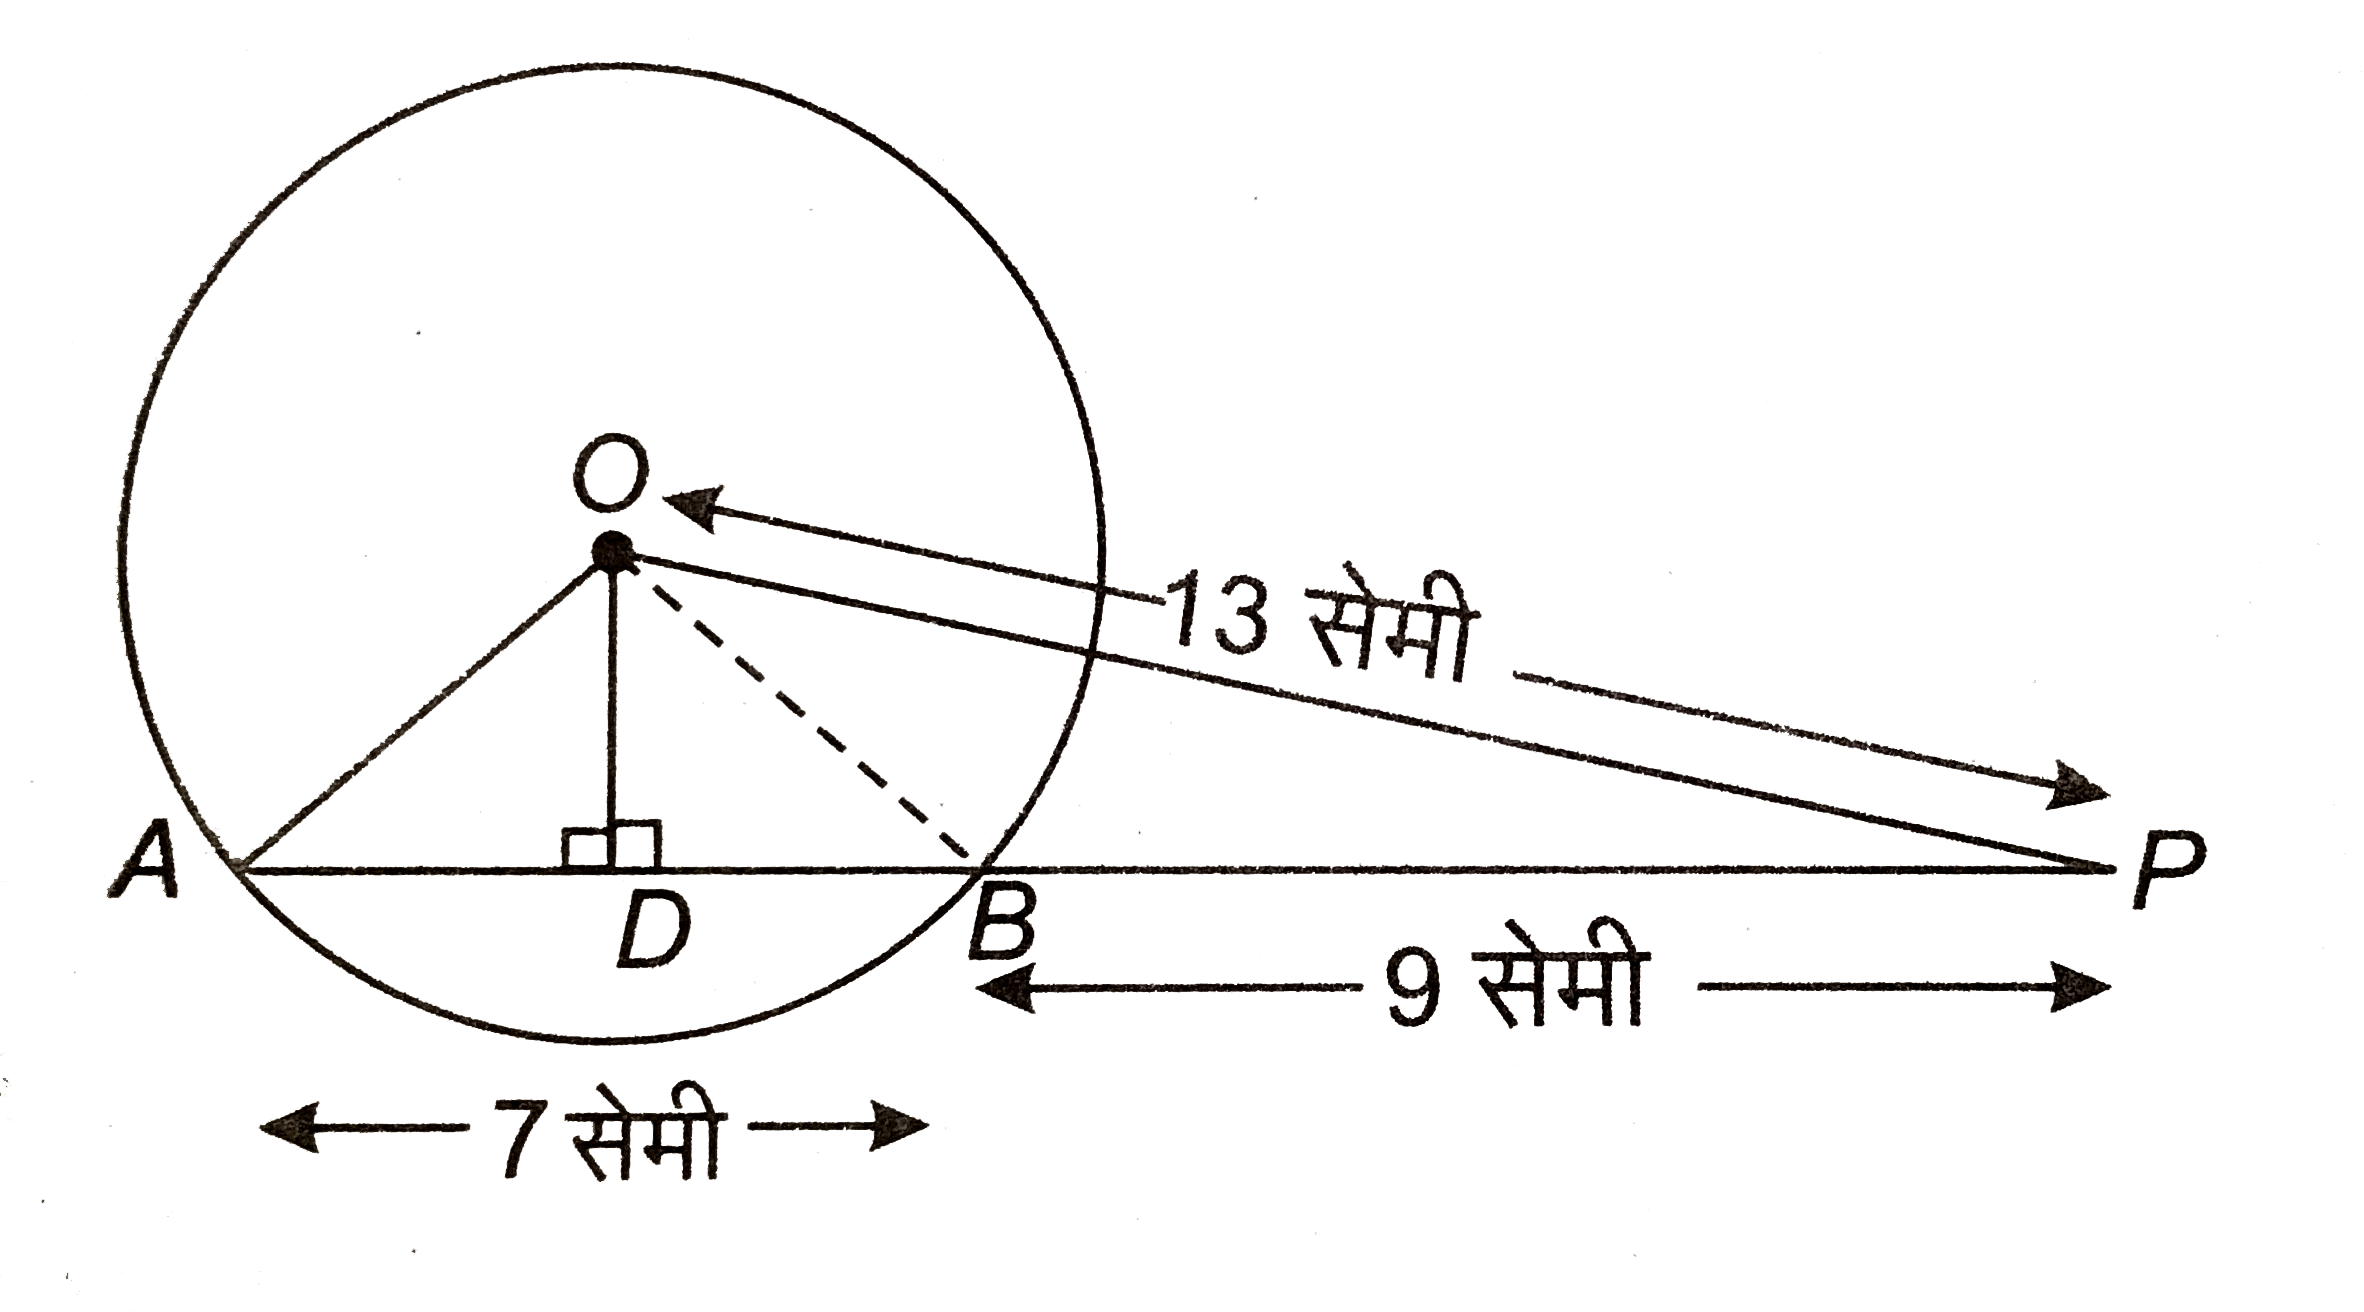
दी आकृति में, OP = 13 सेमी, AB =7 सेमी और BP = 9 सेमी है। वृत्त की त्रिज्या ज्ञात कीजिए।

OD⊥AB खींची।
∴AD=DB
(केन्द्र से जीवा पर डाला गया लम्ब जीवा से को समद्विभाजित करता है)
⇒AD=DB=3.5 सेमी
और PD=PB+BD=9+3.5=12.5 सेमी
समकोण ΔODP में, पायथागोरस प्रमेय से,

OP2=OD2+PD2
⇒(13)2=OD2+(12.5)2
⇒OD2=(13)2−(12.5)2
⇒OD2=−169−156.25=12.75
अब समकोण ΔODB में,
OB2=OD2+DB2
⇒OD2=12.75+(3.5)2=12.75+12.25=25
⇒OB=√25=5 सेमी अतः वृत्त की त्रिज्या = 5 सेमी
Topper's Solved these Questions
- BOOK - NOOTAN HINDICHAPTER - वृत्त EXERCISE - प्रश्नावली29videos
वृत्त
- BOOK - NOOTAN HINDICHAPTER - वृत्त EXERCISE - प्रश्नावली 10.14videos
वृत्त
- BOOK - NOOTAN HINDICHAPTER - वास्तविक संख्याएँEXERCISE - विविध प्रश्नावली30videos
वास्तविक संख्याएँ
- BOOK - NOOTAN HINDICHAPTER - वृत्तों से समबन्धित क्षेत्रफल EXERCISE - विविध प्रश्नावली ( बहुविकल्पीय प्रश्न )14videos
वृत्तों से समबन्धित क्षेत्रफल
Similar Questions
एक वृत्त की त्रिज्या 8 सेमी है। इसके केन्द्र से 10 सेमी की दुरी पर स्थित बिन्दु से वृत्त पर खींची स्पर्श रेखा की लम्बाई ज्ञात कीजिए।
03:47View Solutionएक वृत्त की कितनी स्पर्श रेखाएँ हो सकती है?
01:37View Solutionयूक्लिड विभाजन प्रमेयिका बताइए।
06:07View Solutionयदि R1 और R2 त्रिज्याओं वाले दो वृत्तों की परिधियों का योग R त्रिज्या के वृत्त की परिधि के बराबर है , तो :
02:11View SolutionIdentify the cell organelle 'A' :-
ltimg src="https://d10lpgp6xz60nq.cloudfront.net/physics_images/ALN_BIO_C10_E08_018_Q01.png" width="80%"gt01:31View SolutionHow many lines of symmetry does the above figure have ?
02:45View SolutionWhich of the following are correct chain isomers of butane ? (i)
02:17View SolutionDetermine the point of symmetry of a regular hexagon.
05:41View SolutionDtermine the images of the following figure about the given line :
02:10View SolutionMatch the following Column A to Column B
 02:17View Solution
Match the following Column A to Column B
 02:10View Solution
Match the following Column A to Column B
 04:23View Solution
The inequation represented by the graph given below is :
03:12View SolutionThe inequation that best describes the graph given below is _________
03:51View SolutionThe inequation that best describes the following graph is _________
02:01View SolutionWhich inequations represent the shaded region in the given figure
02:52View Solution

