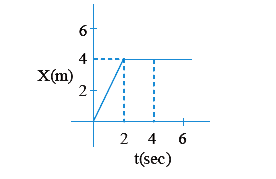
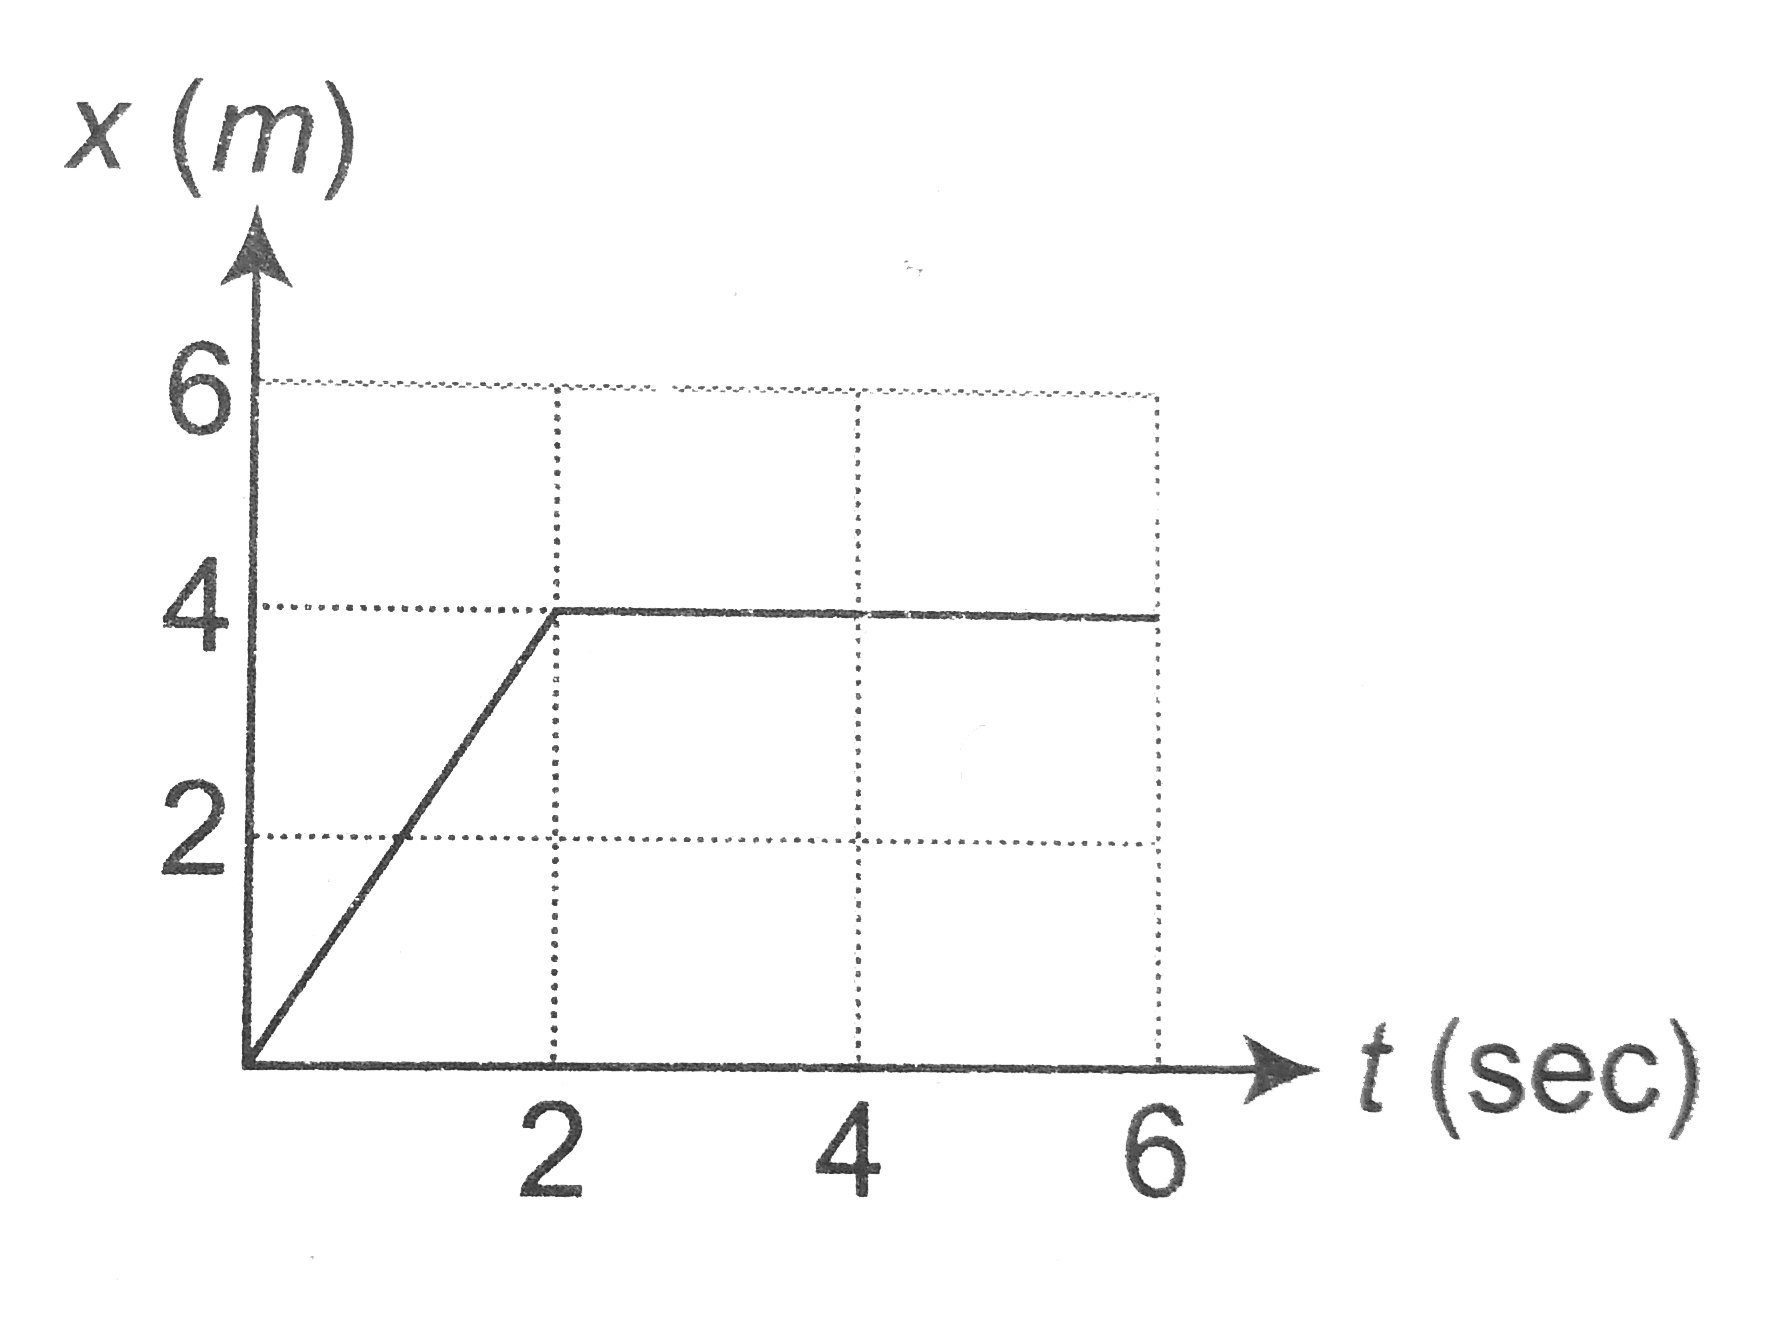
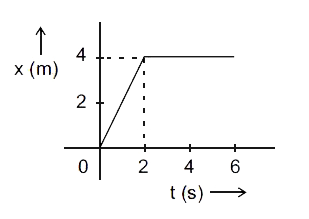
In the figure given below, the position-time graph of a particle of mass 0.1kg is shown. The impuslse at t=2 sec is
A
0.2kgms−1
B
−0.2kgms−1
C
0.1kgms−1
D
−0.4kgms−1
Video Solution
Text Solution
The correct Answer is:A
If a constant force F is applied on a body for a short interval of time Δt, then impulse of this force is F×Δt. From Newton's second law.
F=ma=mΔvΔt
⇒FΔt=mΔv=Δp
∴ Impulse, I=Δp=mΔxΔt
Given, m=0.1kg,ΔxΔt=42m/s
∴I=0.1×42=0.2kgms−1.
|
Topper's Solved these Questions
- MOCK TESTBOOK - A2ZCHAPTER - MOCK TESTEXERCISE - Motion With Constant Acceleration
15 Videos
- MOCK TESTBOOK - A2ZCHAPTER - MOCK TESTEXERCISE - Motion With Constant Acceleration
15 Videos
- KINETIC THEORY OF GASES AND THERMODYNAMICSBOOK - A2ZCHAPTER - KINETIC THEORY OF GASES AND THERMODYNAMICSEXERCISE - Chapter Test
29 Videos
- MOTION IN TWO DIMENSIONBOOK - A2ZCHAPTER - MOTION IN TWO DIMENSIONEXERCISE - Chapter Test
29 Videos
Similar Questions
Knowledge Check
In the figure given below, the position time graph of a particle of mass 0.1kg is shown. The impulse at t=2 sec is
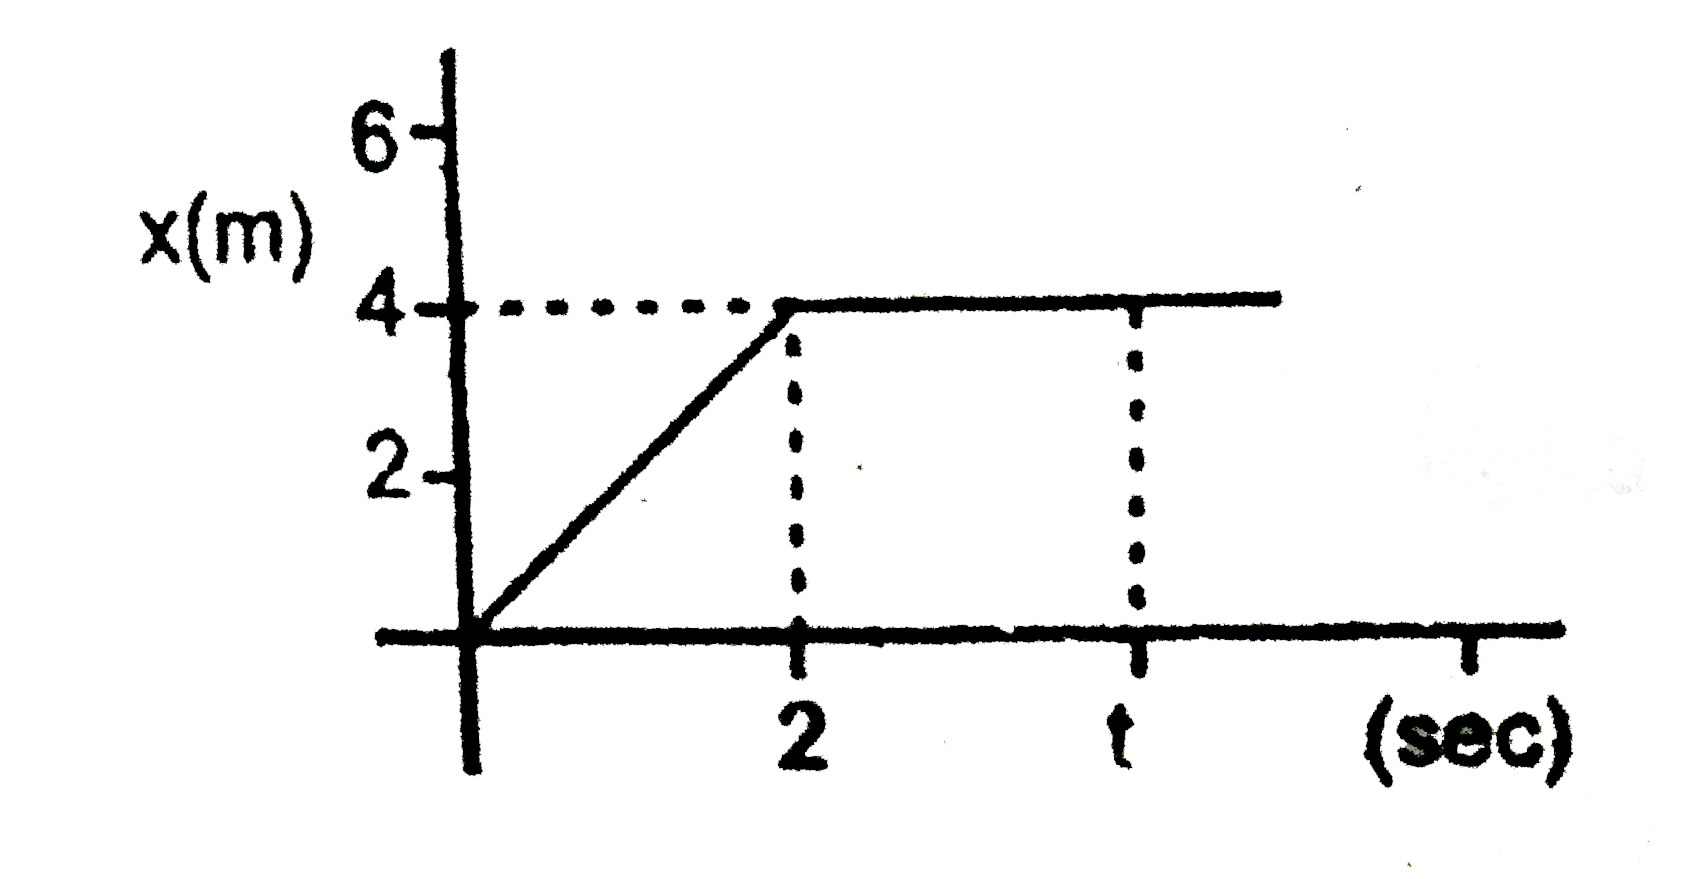 A0.2gkm/secB−0.2kgmsec−1C0.1kgmsec−1D−0.1kgm/sec
In the figure given below, the position–time graph of a particle of mass 0·1 kg is shown. The impulse at t=2sec is
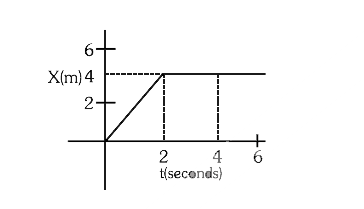 A0⋅2 kgmsec −1B−0⋅2 kgmsec −1C0⋅1 kgmsec −1D−0⋅4 kgmsec −1
In the figure given, the position-time graph of a particle of mass 0.1 kg is shown the impulse at t = 2s is
 A0.2 kg m/sB−0.2 kg m/sC0.1 kg m/sD−0.4 kg m/s
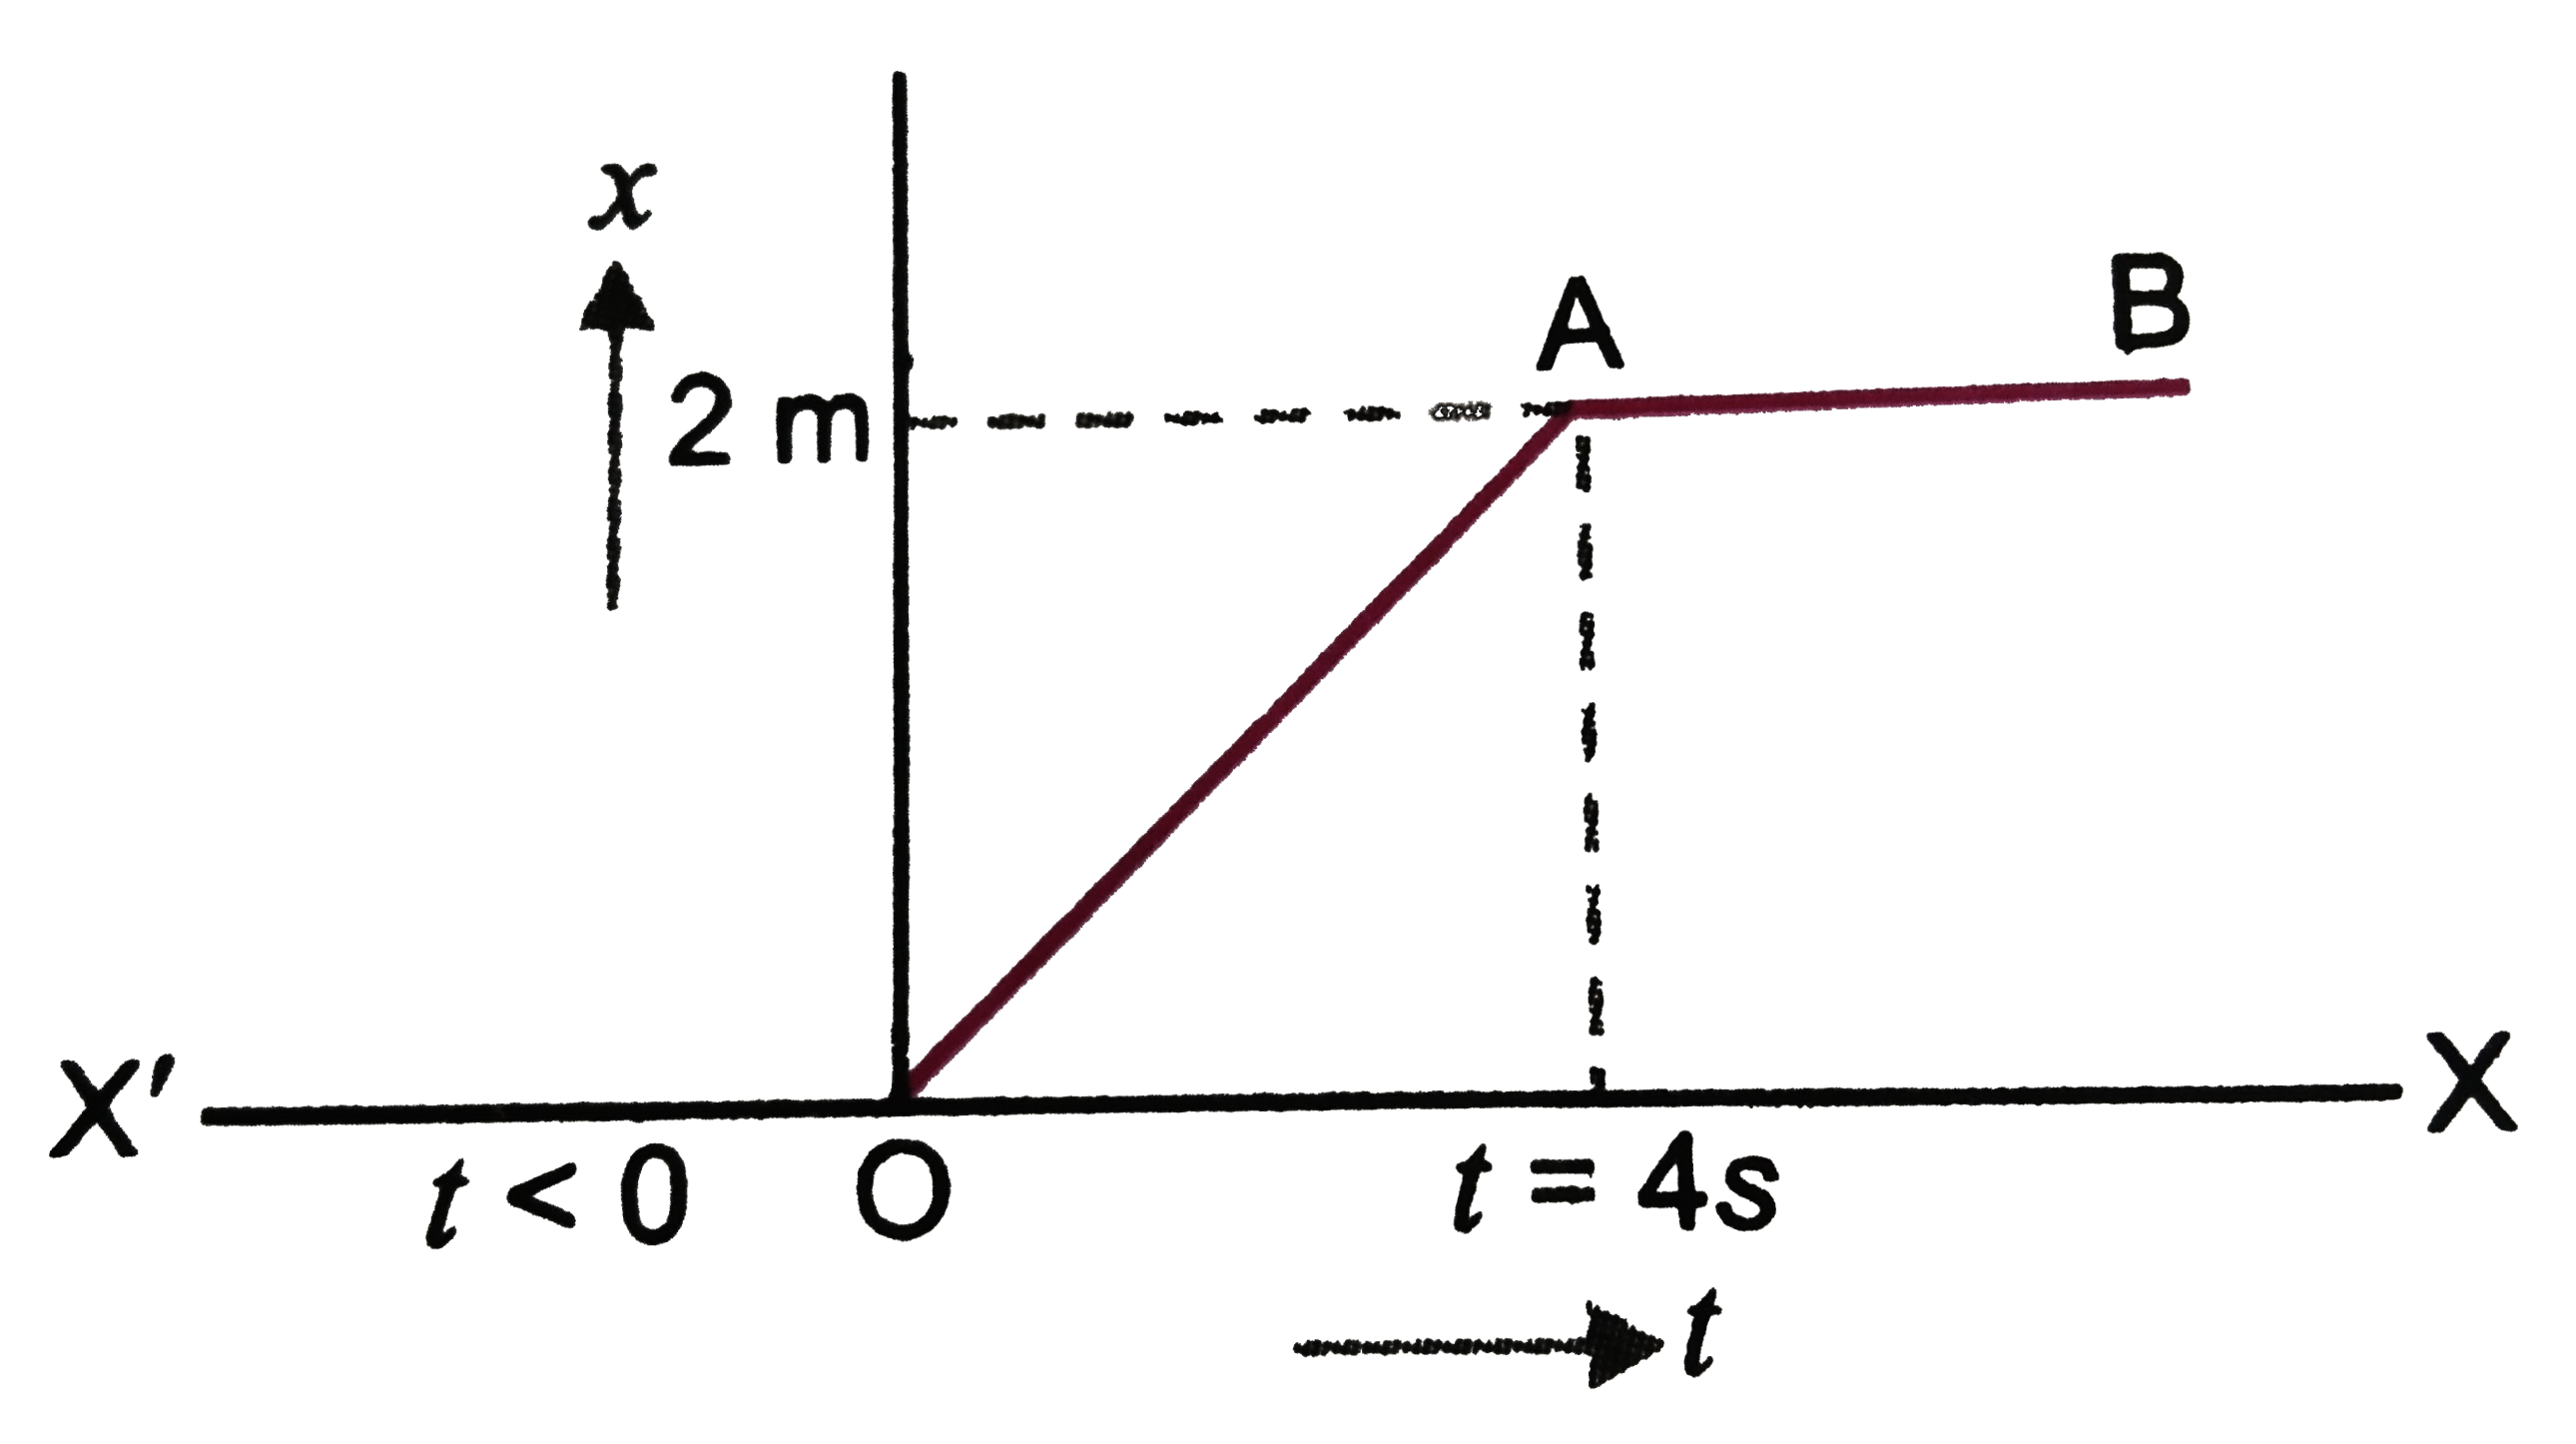
Shows position time graph of a particle of mass 100g Find the impulse at t=0 and at t=4s
 .
.
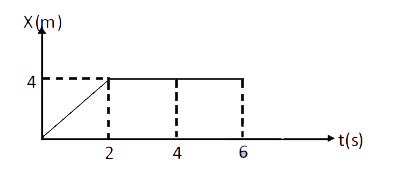
View SolutionThe position-time graph of a particle of mass 0.1 kg is shown. The impulse at t = 2s is :
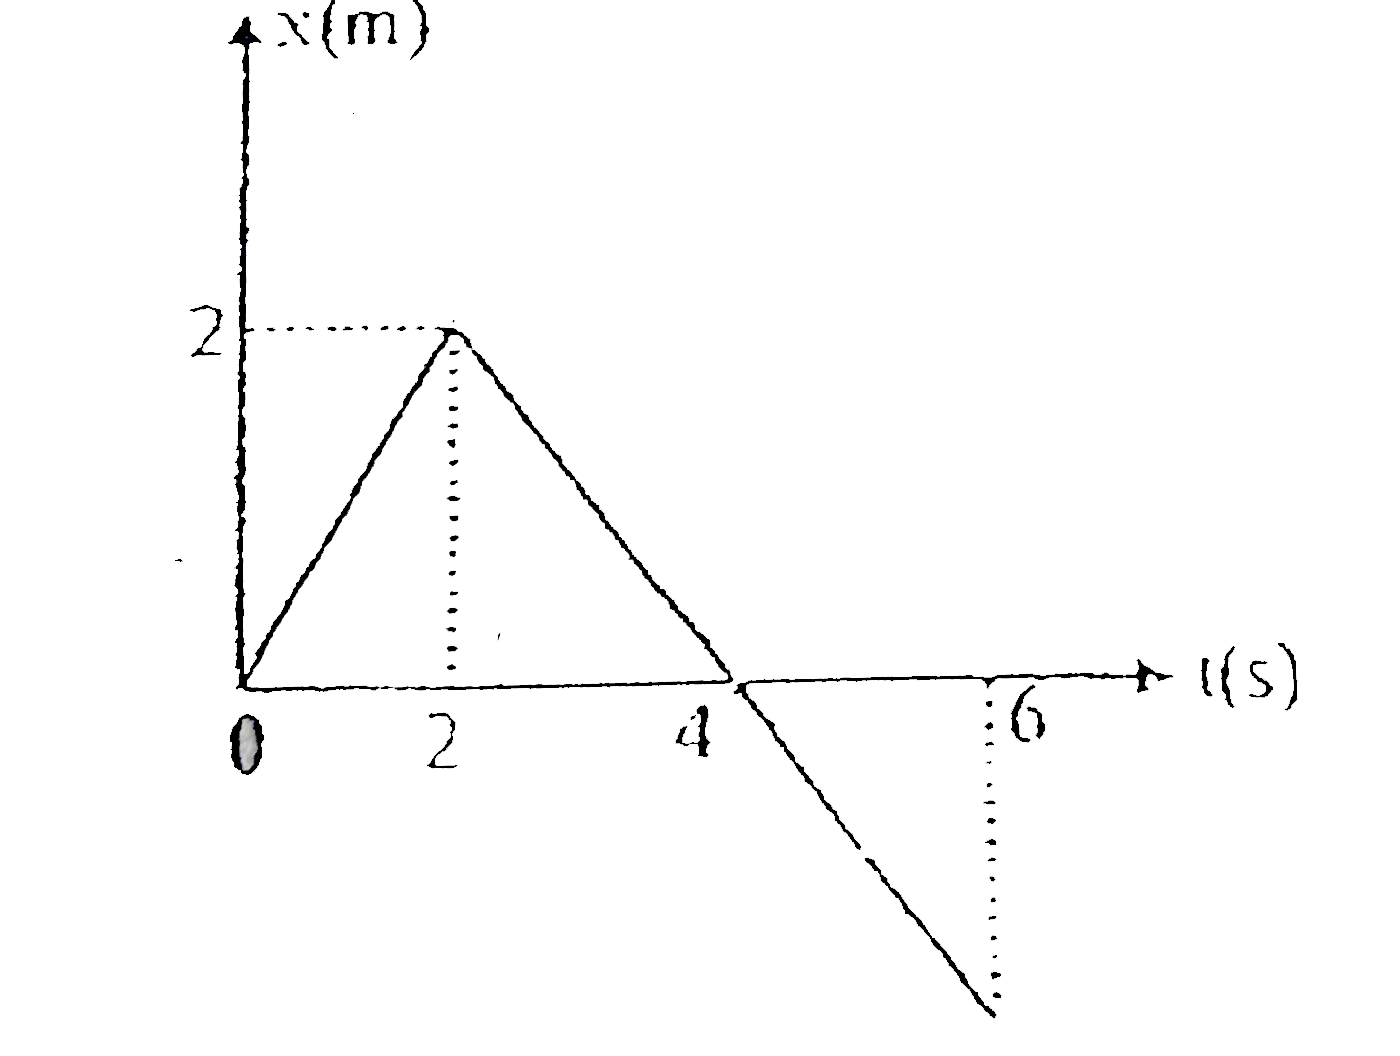
View SolutionPosition time graph of a particle of mass 2 kg is shown in figrure. Total work done on the particle from t=0 to t=4s is
View SolutionThe velocity − time graph of a particle is as shown in figure

View SolutionFigure shows the position time graph of a particle of mass 5kg. The force acting on the particle for 0<t<4s and 8s<t<12s respectively are,

View Solution

