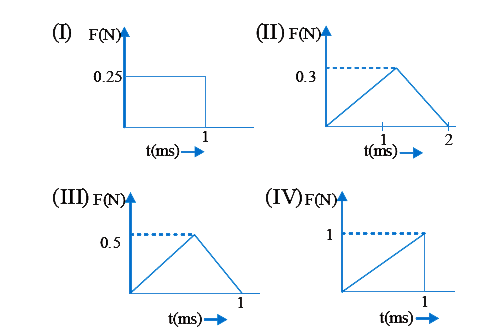
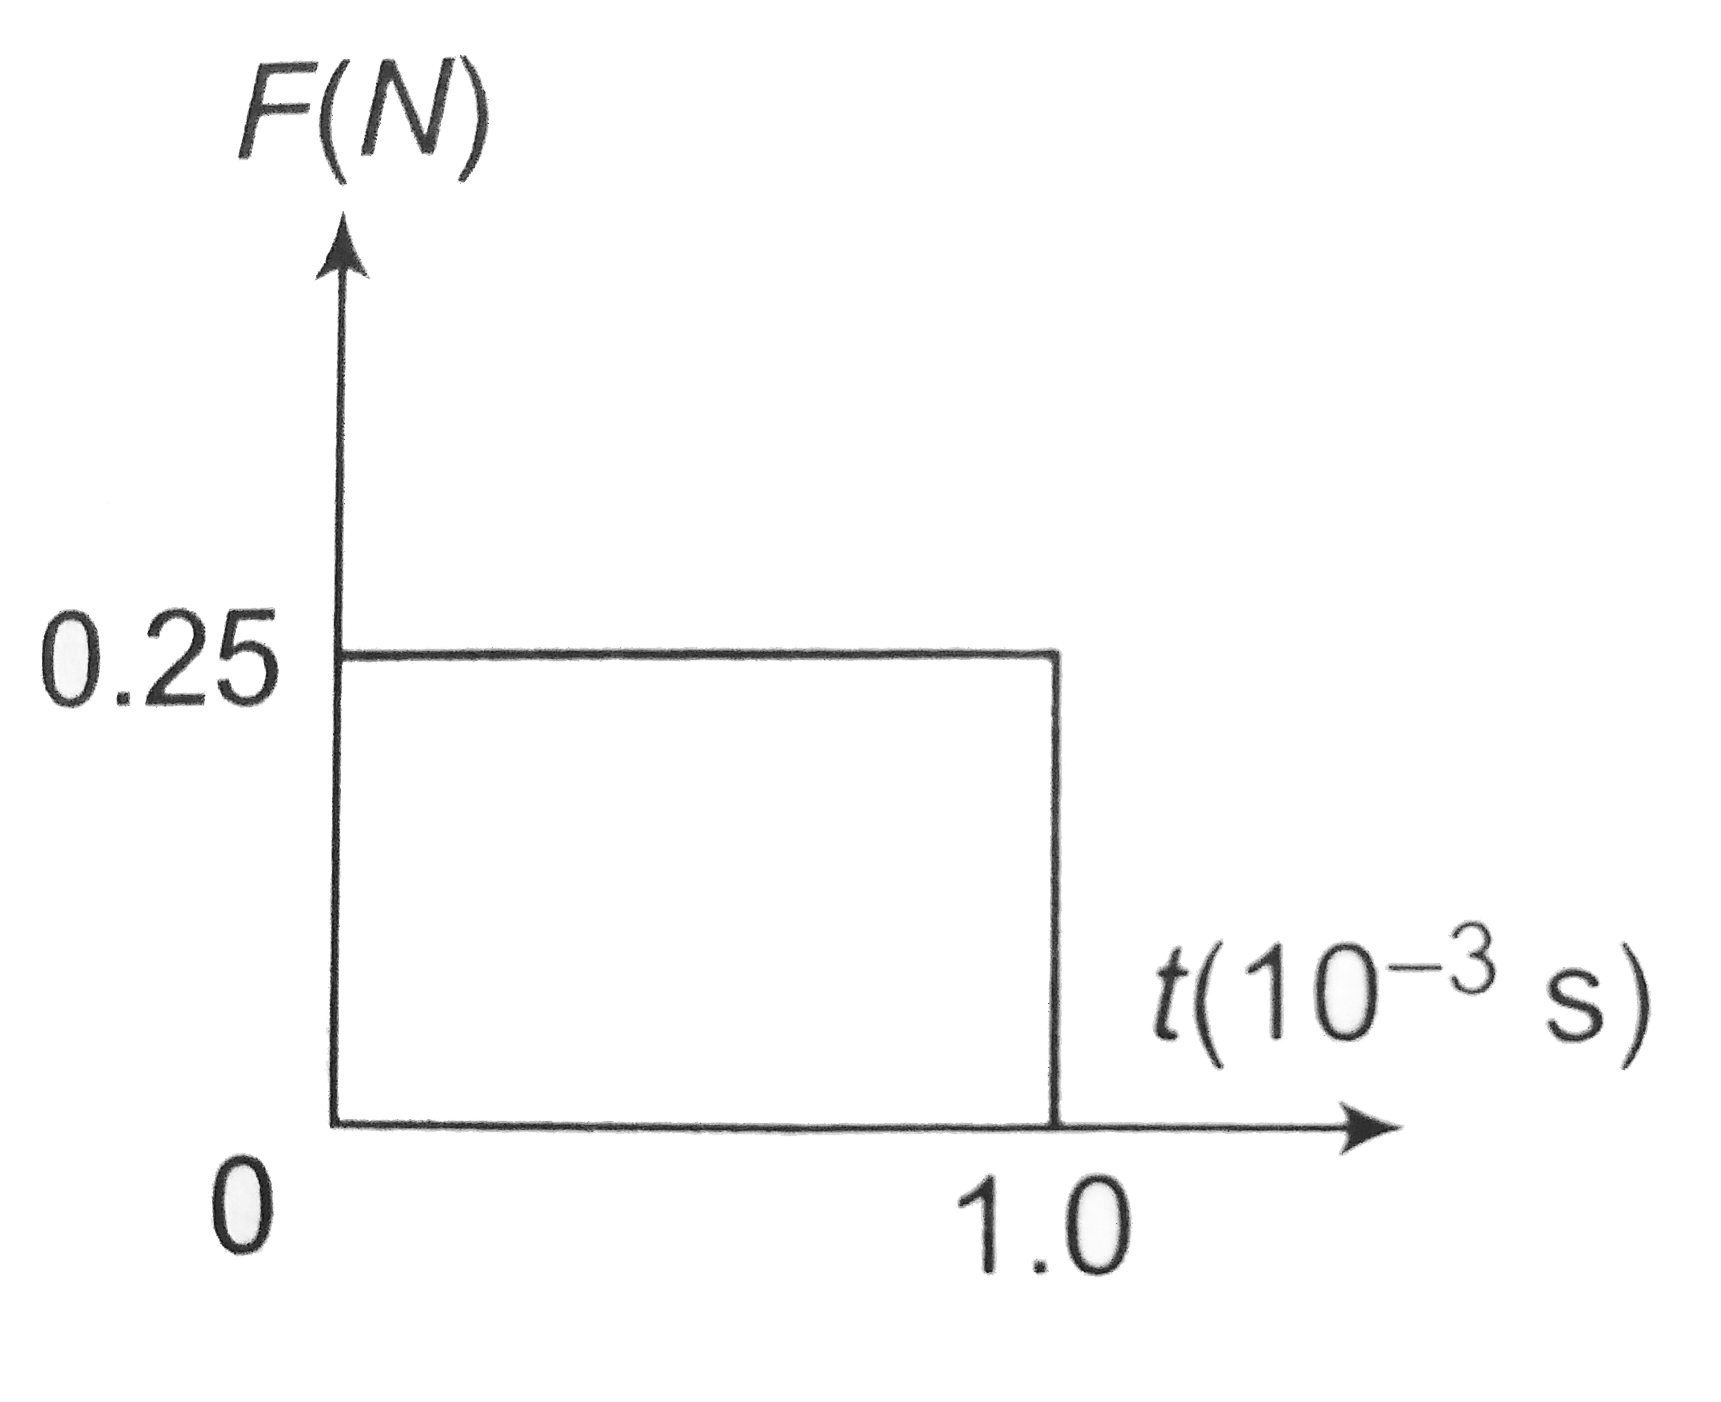
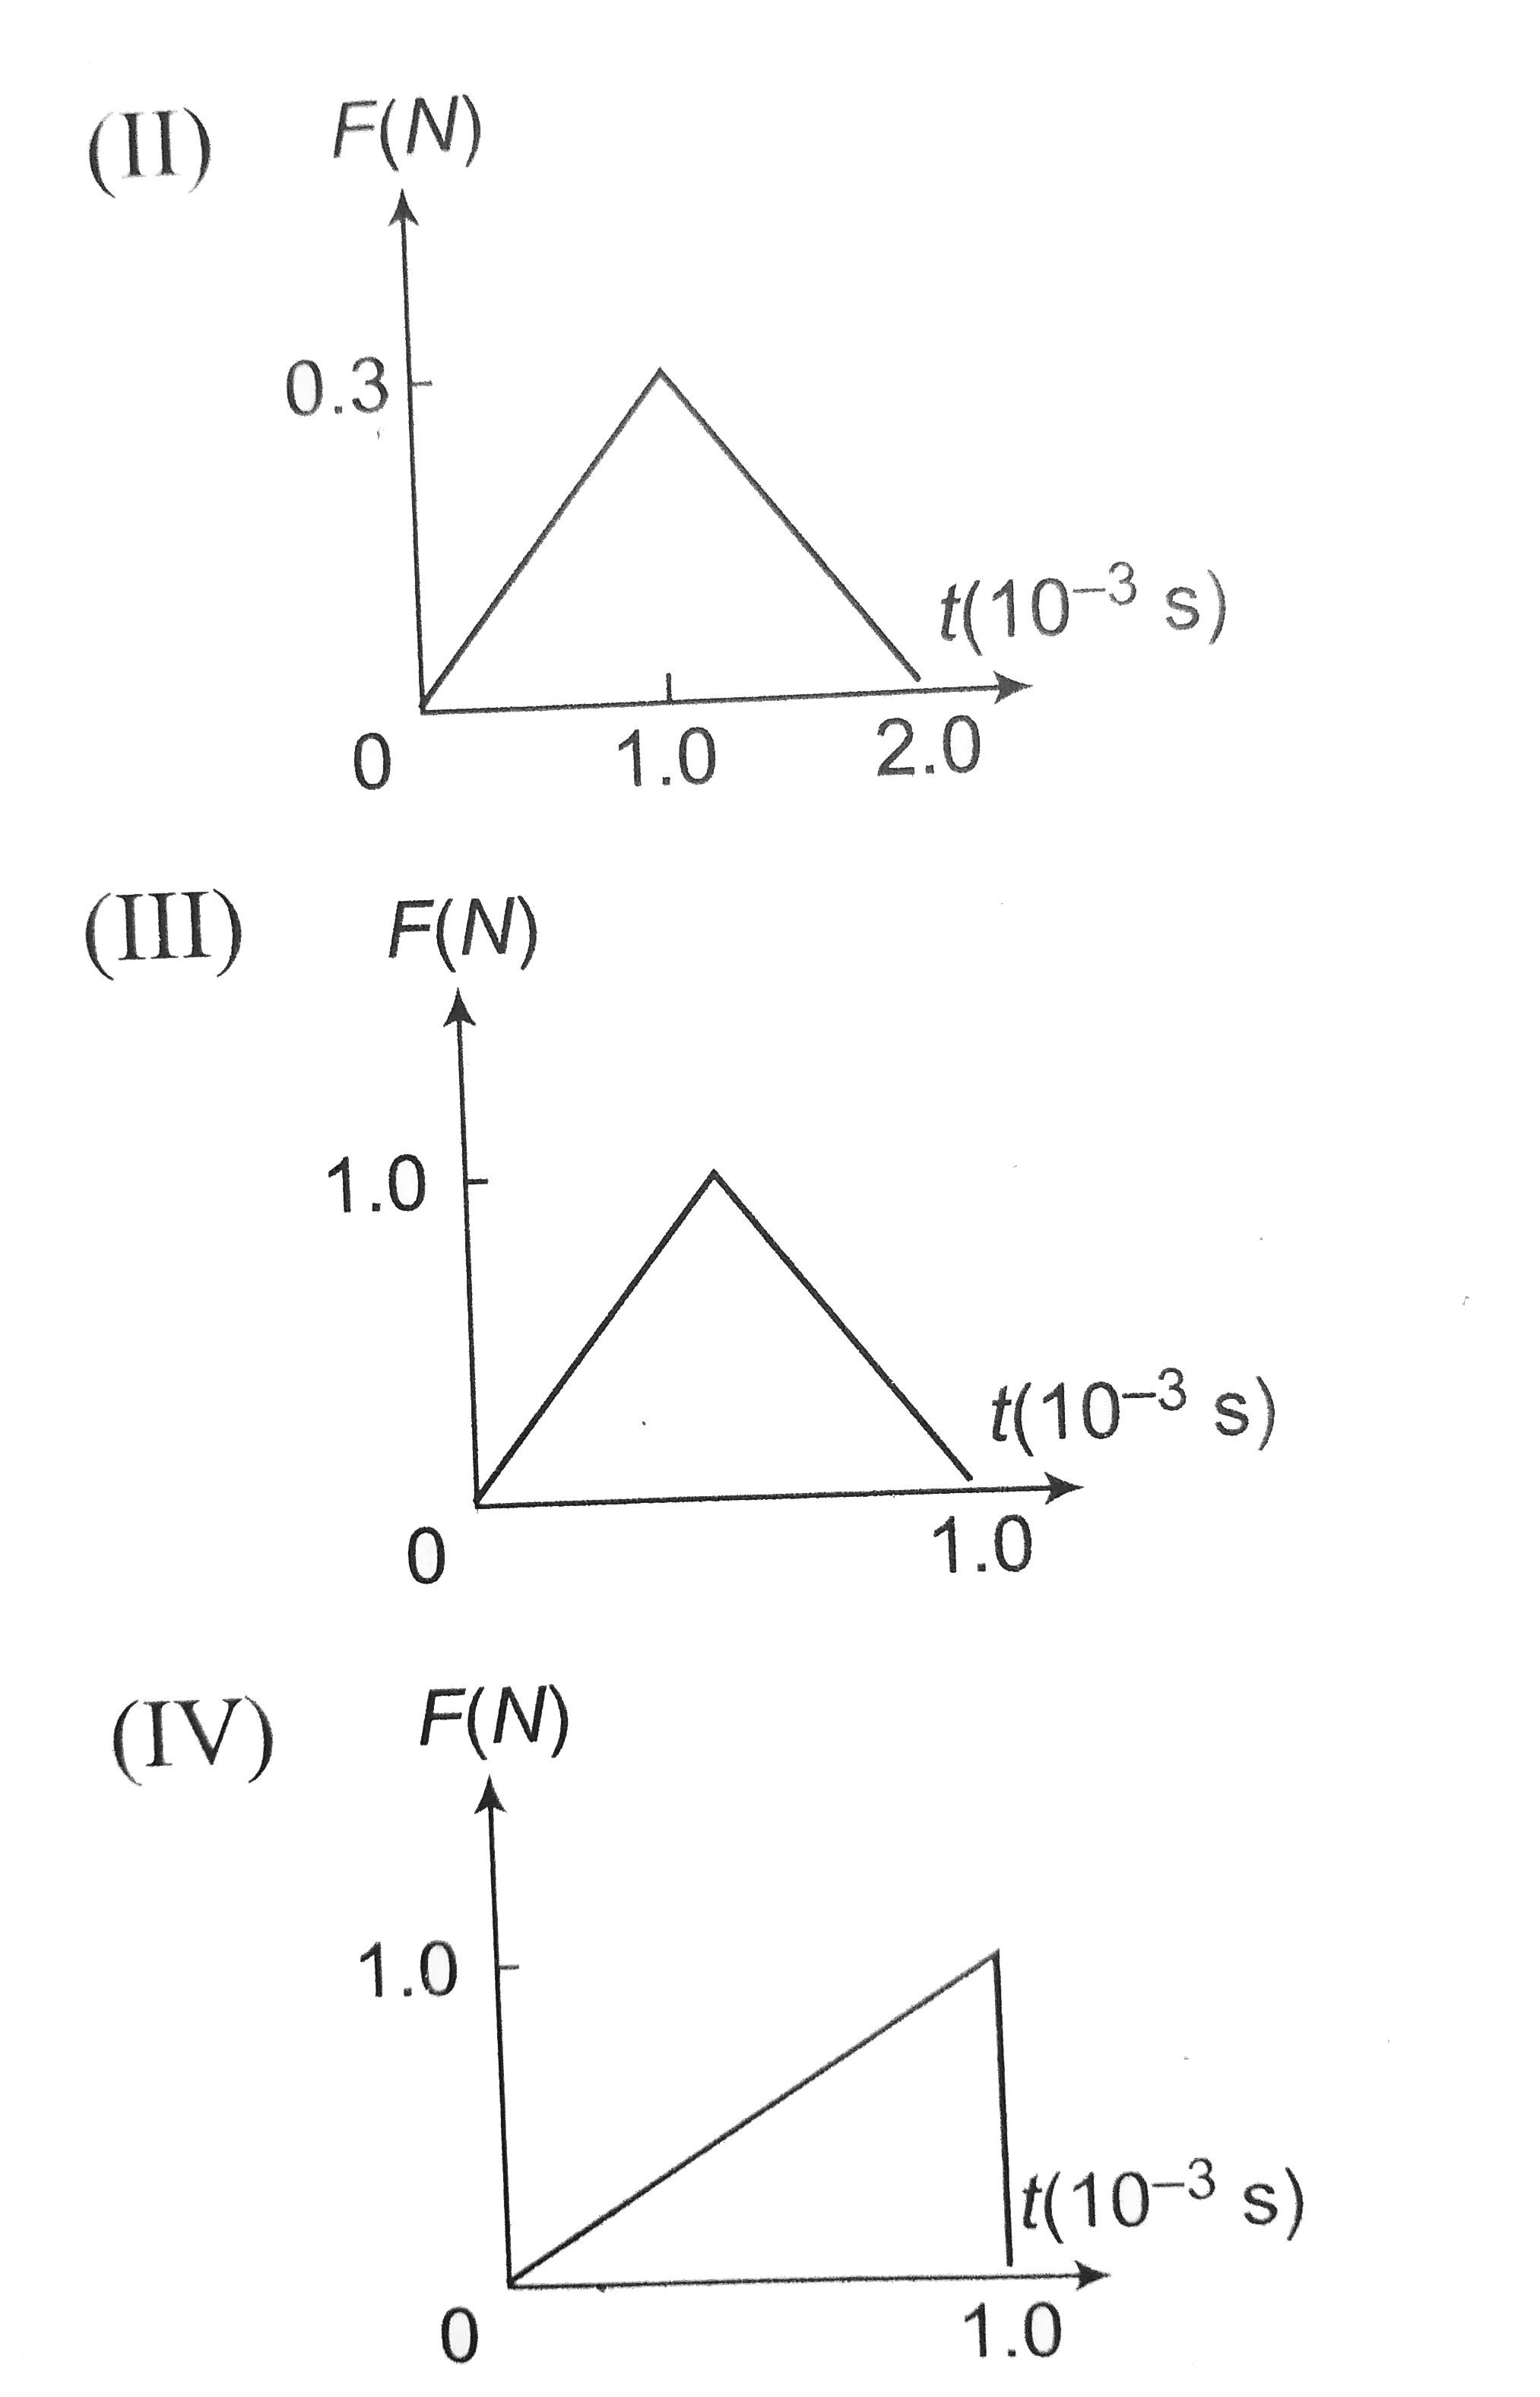
Figures I, II, III, and IV depict variation of force with time. The impulse is highest in the case of situations depicted. Figure(s).
 ,
, 
A
I and II
B
III and I
C
III and IV
D
IV only
Video Solution
Text Solution
The correct Answer is:C
Impulse = Area between force and time graph and it is maximum for graphs (III) and (IV)
|
Topper's Solved these Questions
- NEWTONS LAWS OF MOTIONBOOK - A2ZCHAPTER - NEWTONS LAWS OF MOTIONEXERCISE - Chapter Test
30 Videos
- NEWTONS LAWS OF MOTIONBOOK - A2ZCHAPTER - NEWTONS LAWS OF MOTIONEXERCISE - NEET Questions
38 Videos
- MOTION IN TWO DIMENSIONBOOK - A2ZCHAPTER - MOTION IN TWO DIMENSIONEXERCISE - Chapter Test
29 Videos
- OSCILLATION AND SIMPLE HARMONIC MOTIONBOOK - A2ZCHAPTER - OSCILLATION AND SIMPLE HARMONIC MOTIONEXERCISE - Chapter Test
29 Videos
Similar Questions
Knowledge Check
The variation of displacement with respect to time is depicted in the following figure. The figure shows that
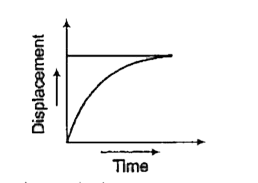 Aacceleration is canstantBvelocity is constantCthe motion is acceleratedDthe motion is retarded and finally the particle stops
The variation of displacement with respect to time is depicted in the following figure. The figure shows that
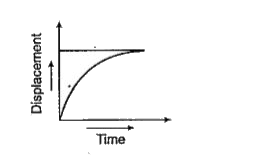 Aacceleration is constantBvelocity is constantCthe motion is acceleratedDthe motion is retarded and finally the particle stops
A force F is applied to the initially, stationary cart. The variation of force with time is shown in the figure. The speed of cart at t = 5 s is
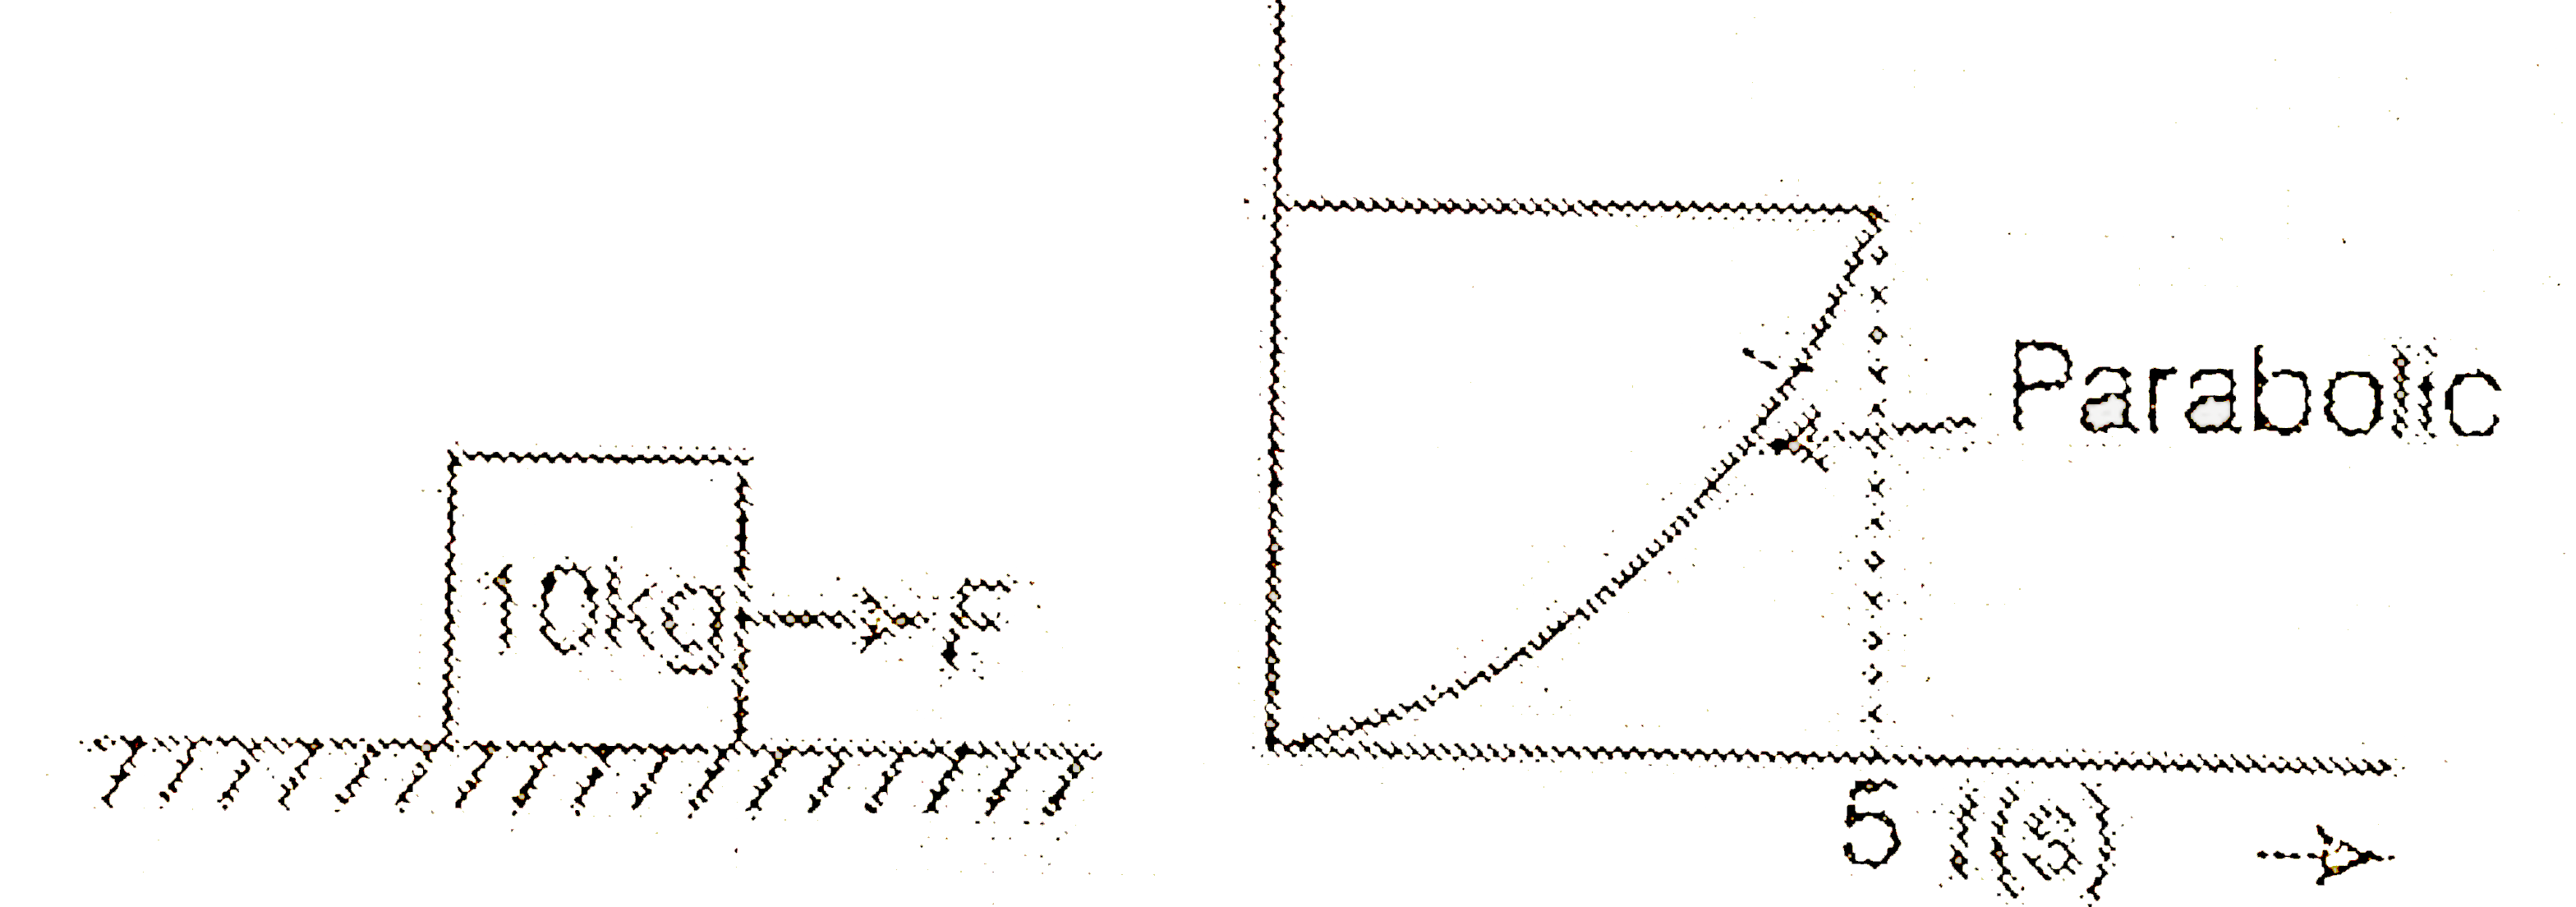 A10 m/sB8.33 m/sC2 m/sDzero
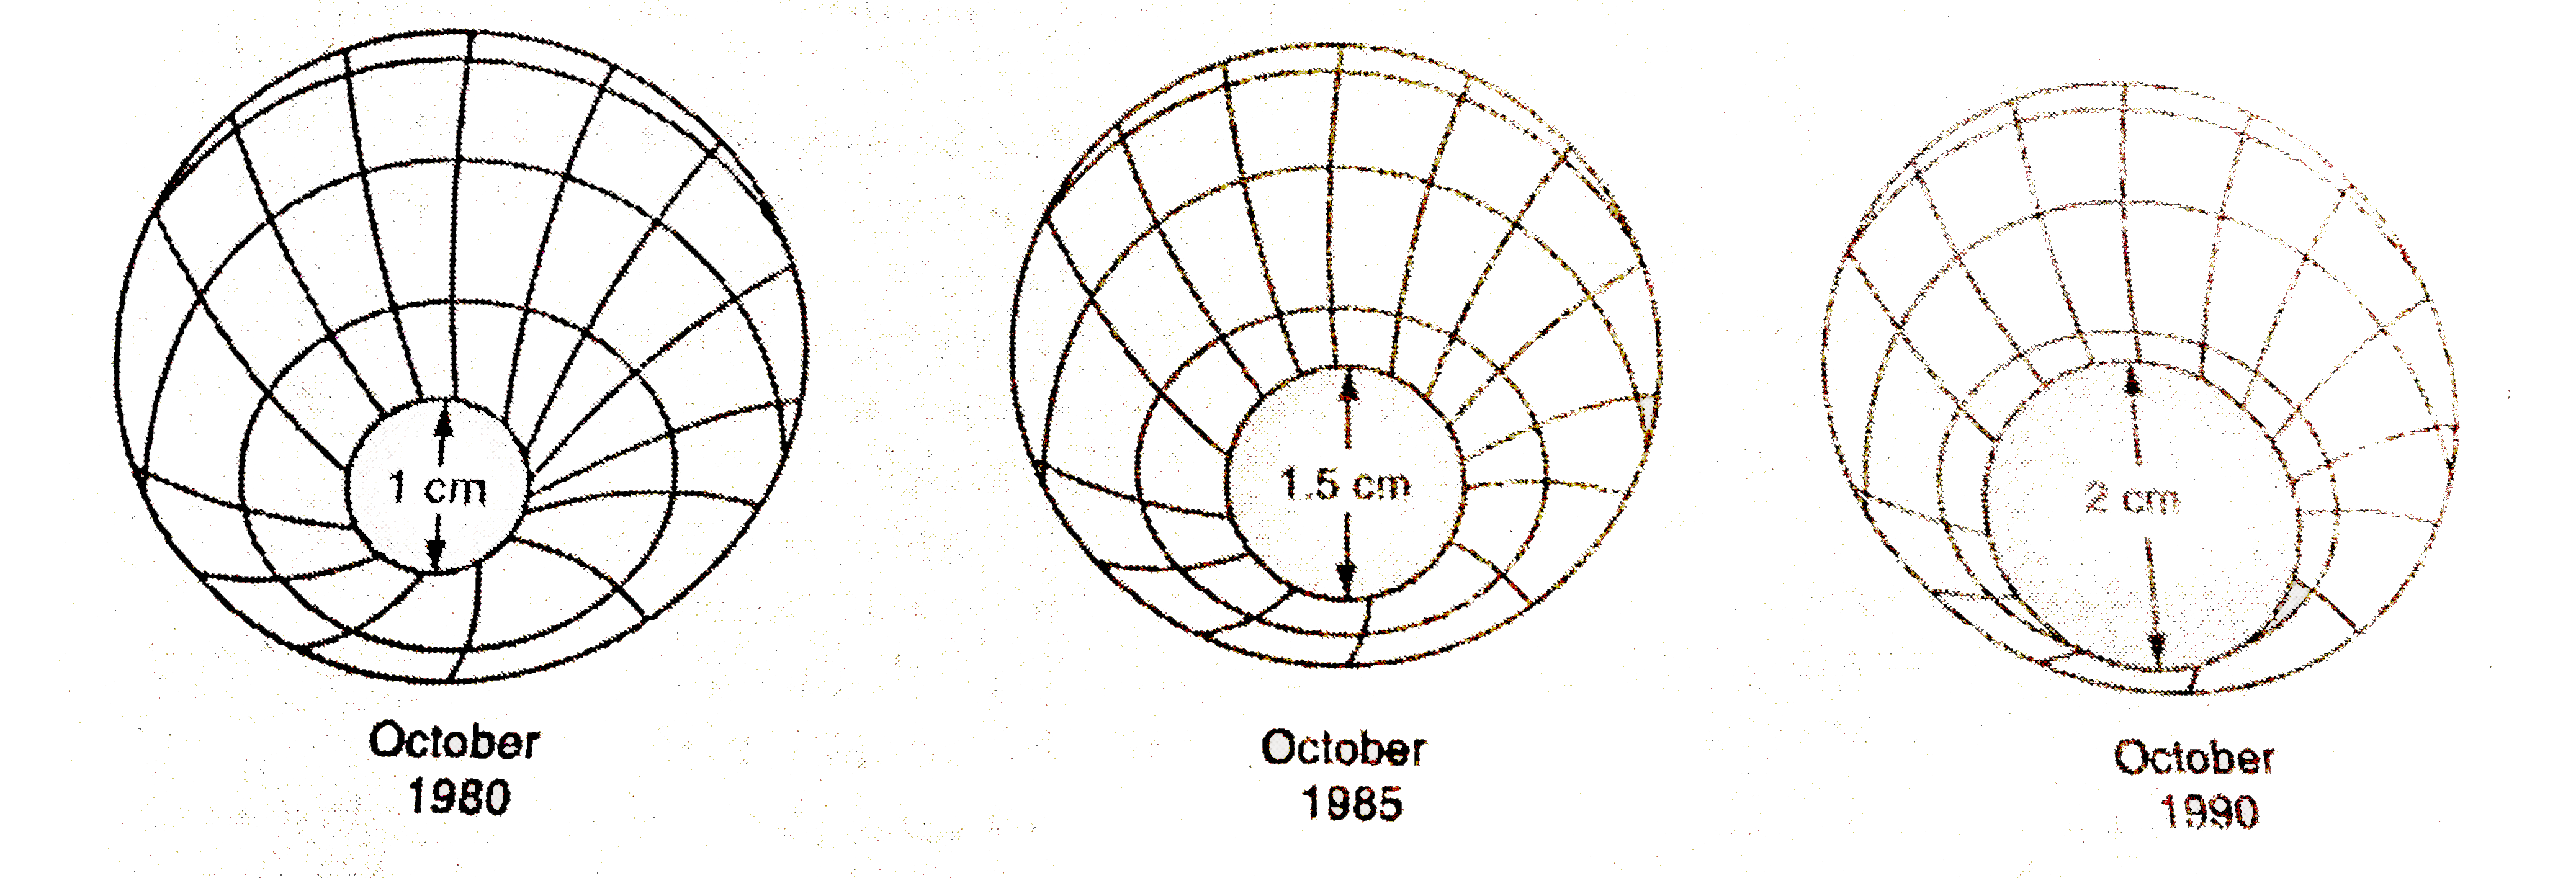
What does the following figure depict?
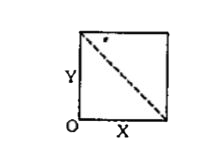
View SolutionWhat is the degree of correlation in the figure depicted below -
View SolutionWhich analysis depicts the relationship between two figures :
View SolutionIn case of a simple pendulum, time period versus length is depicted by
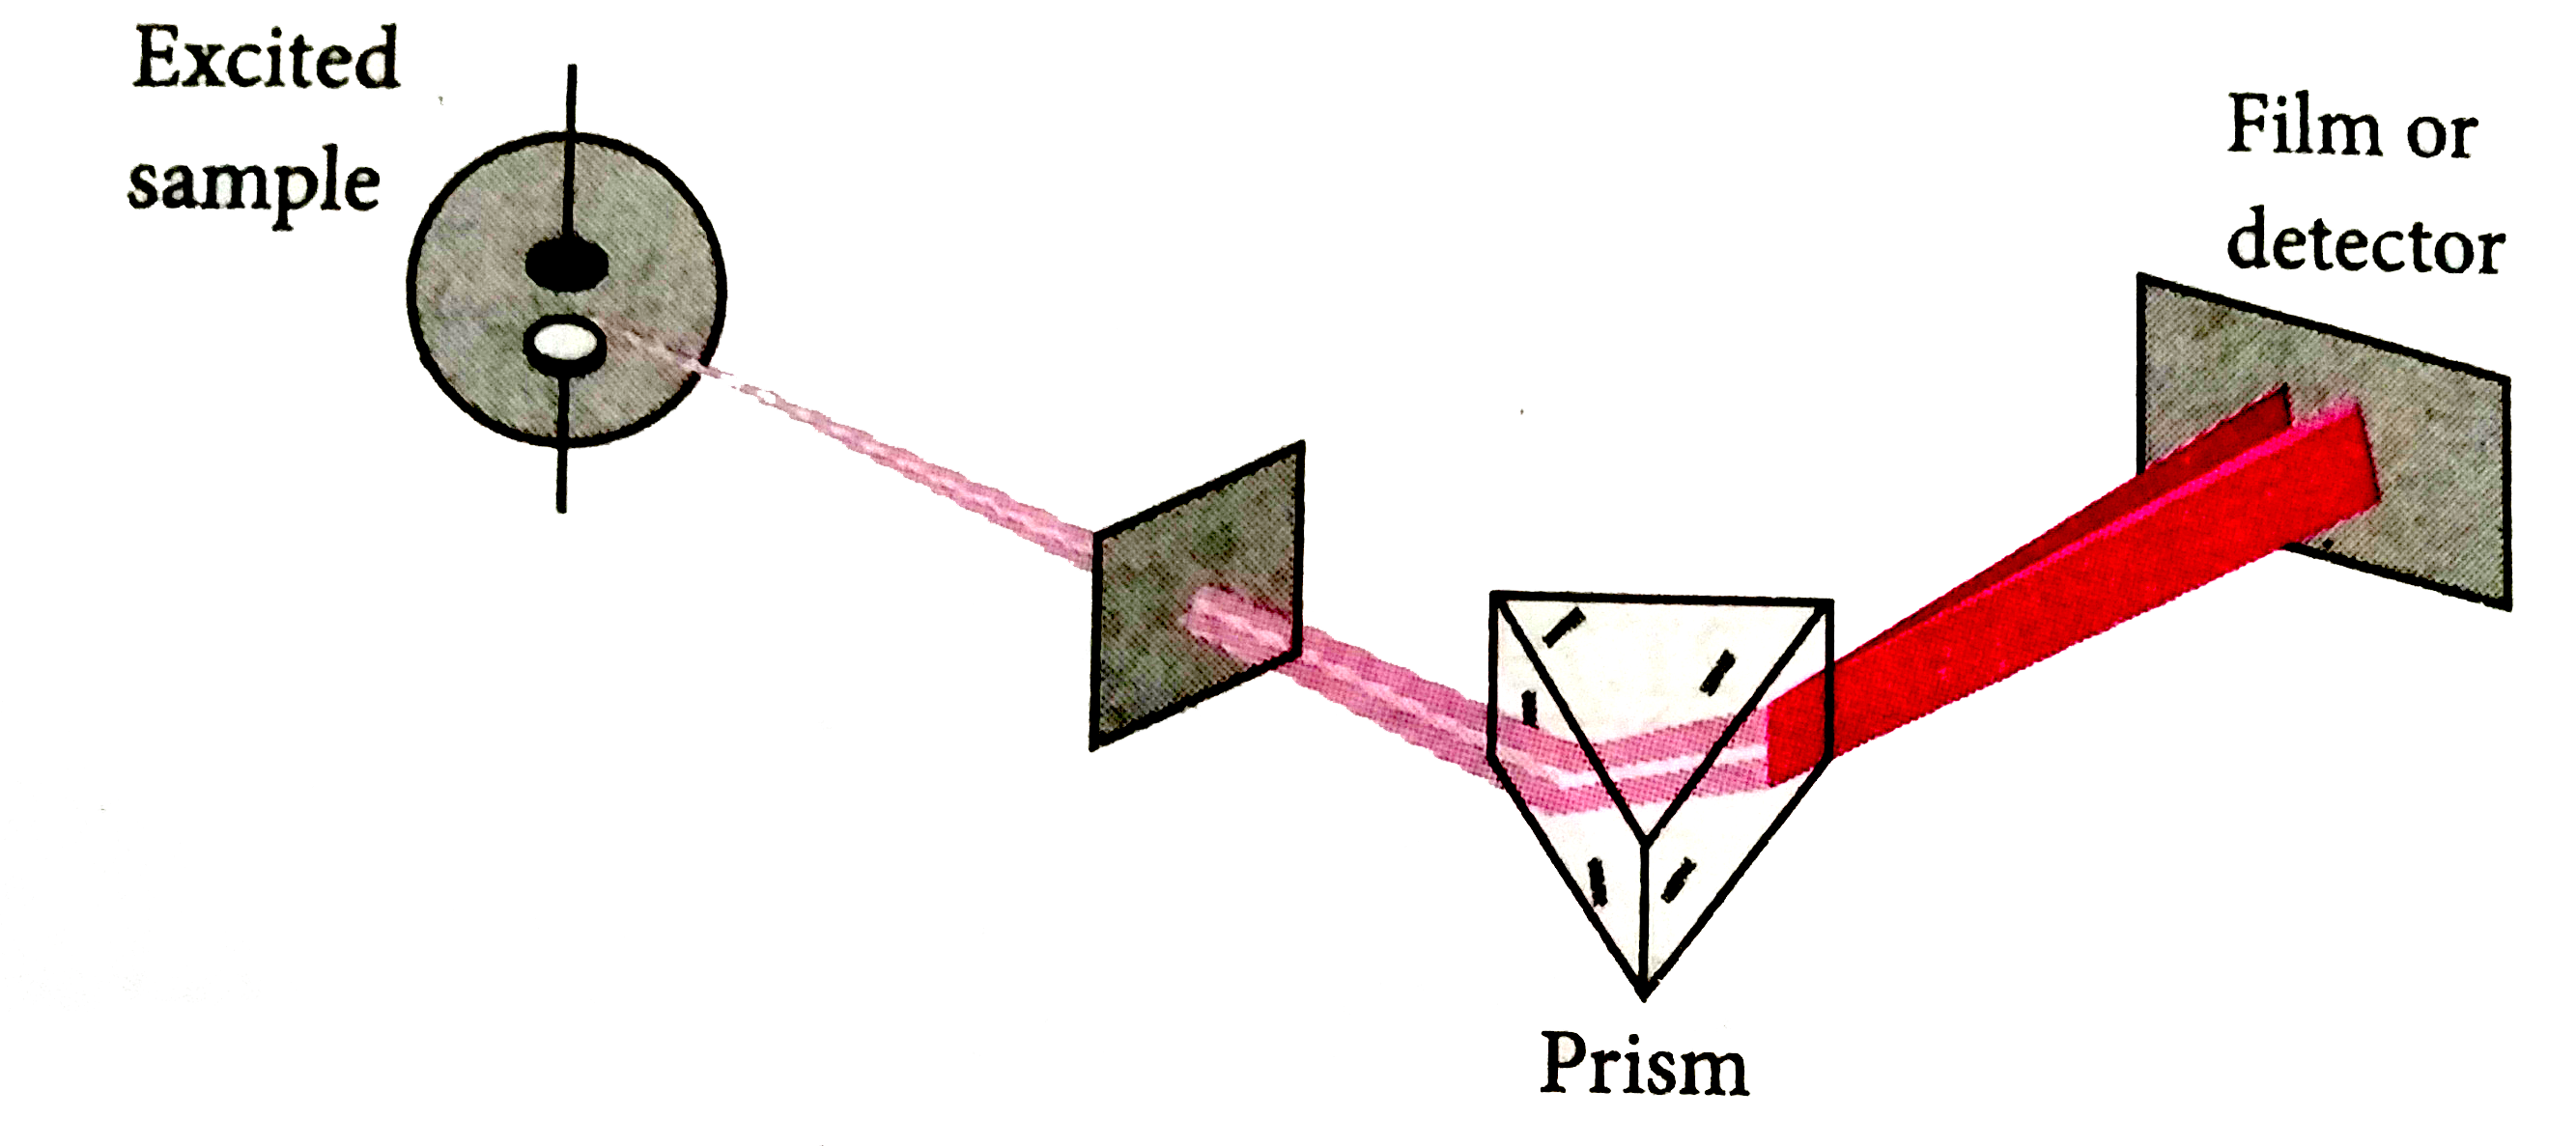
View SolutionWhich of the following types of spectrum is best depicted by the given figure?
View Solution

