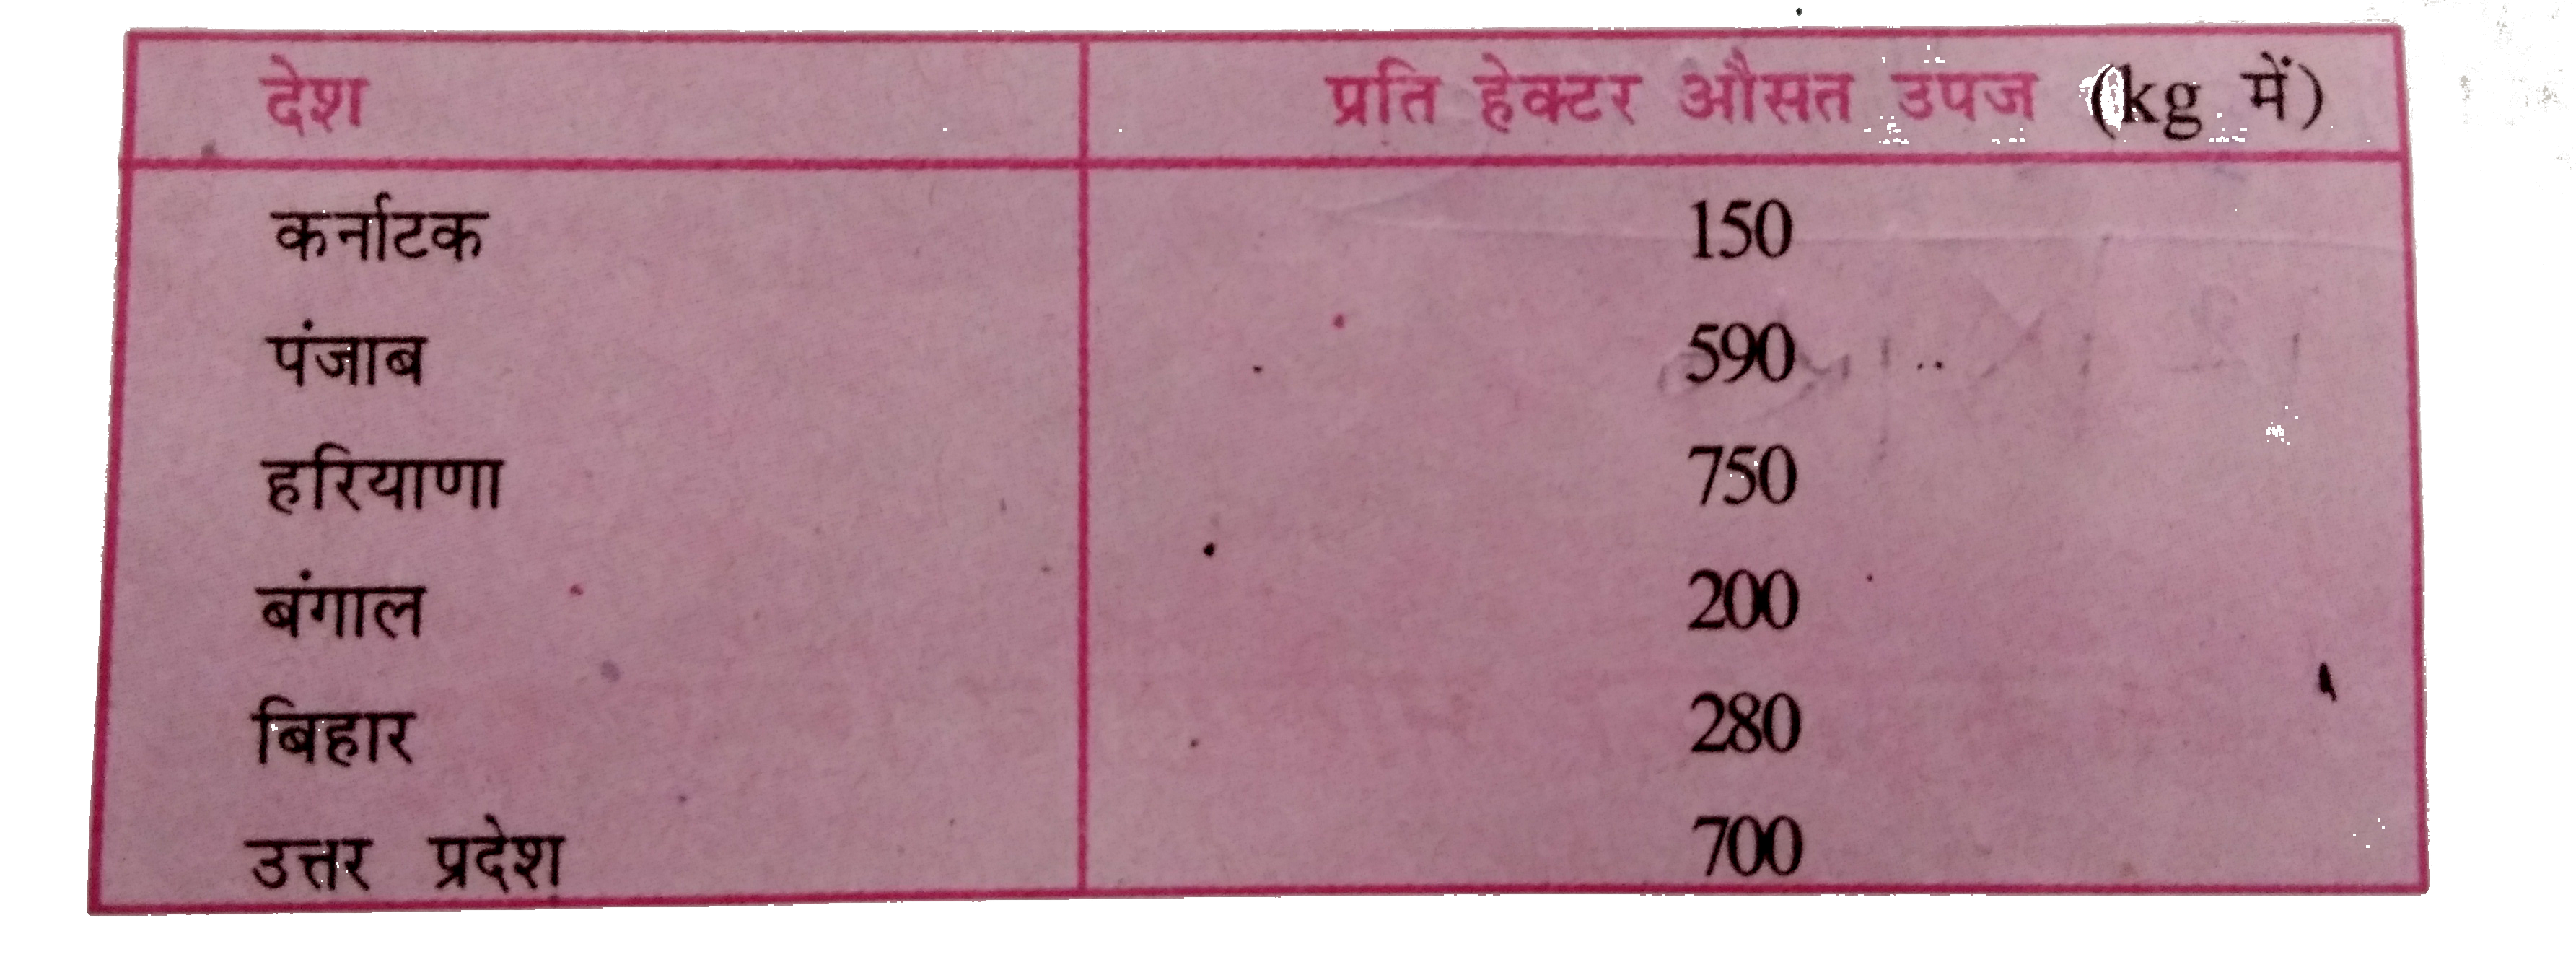
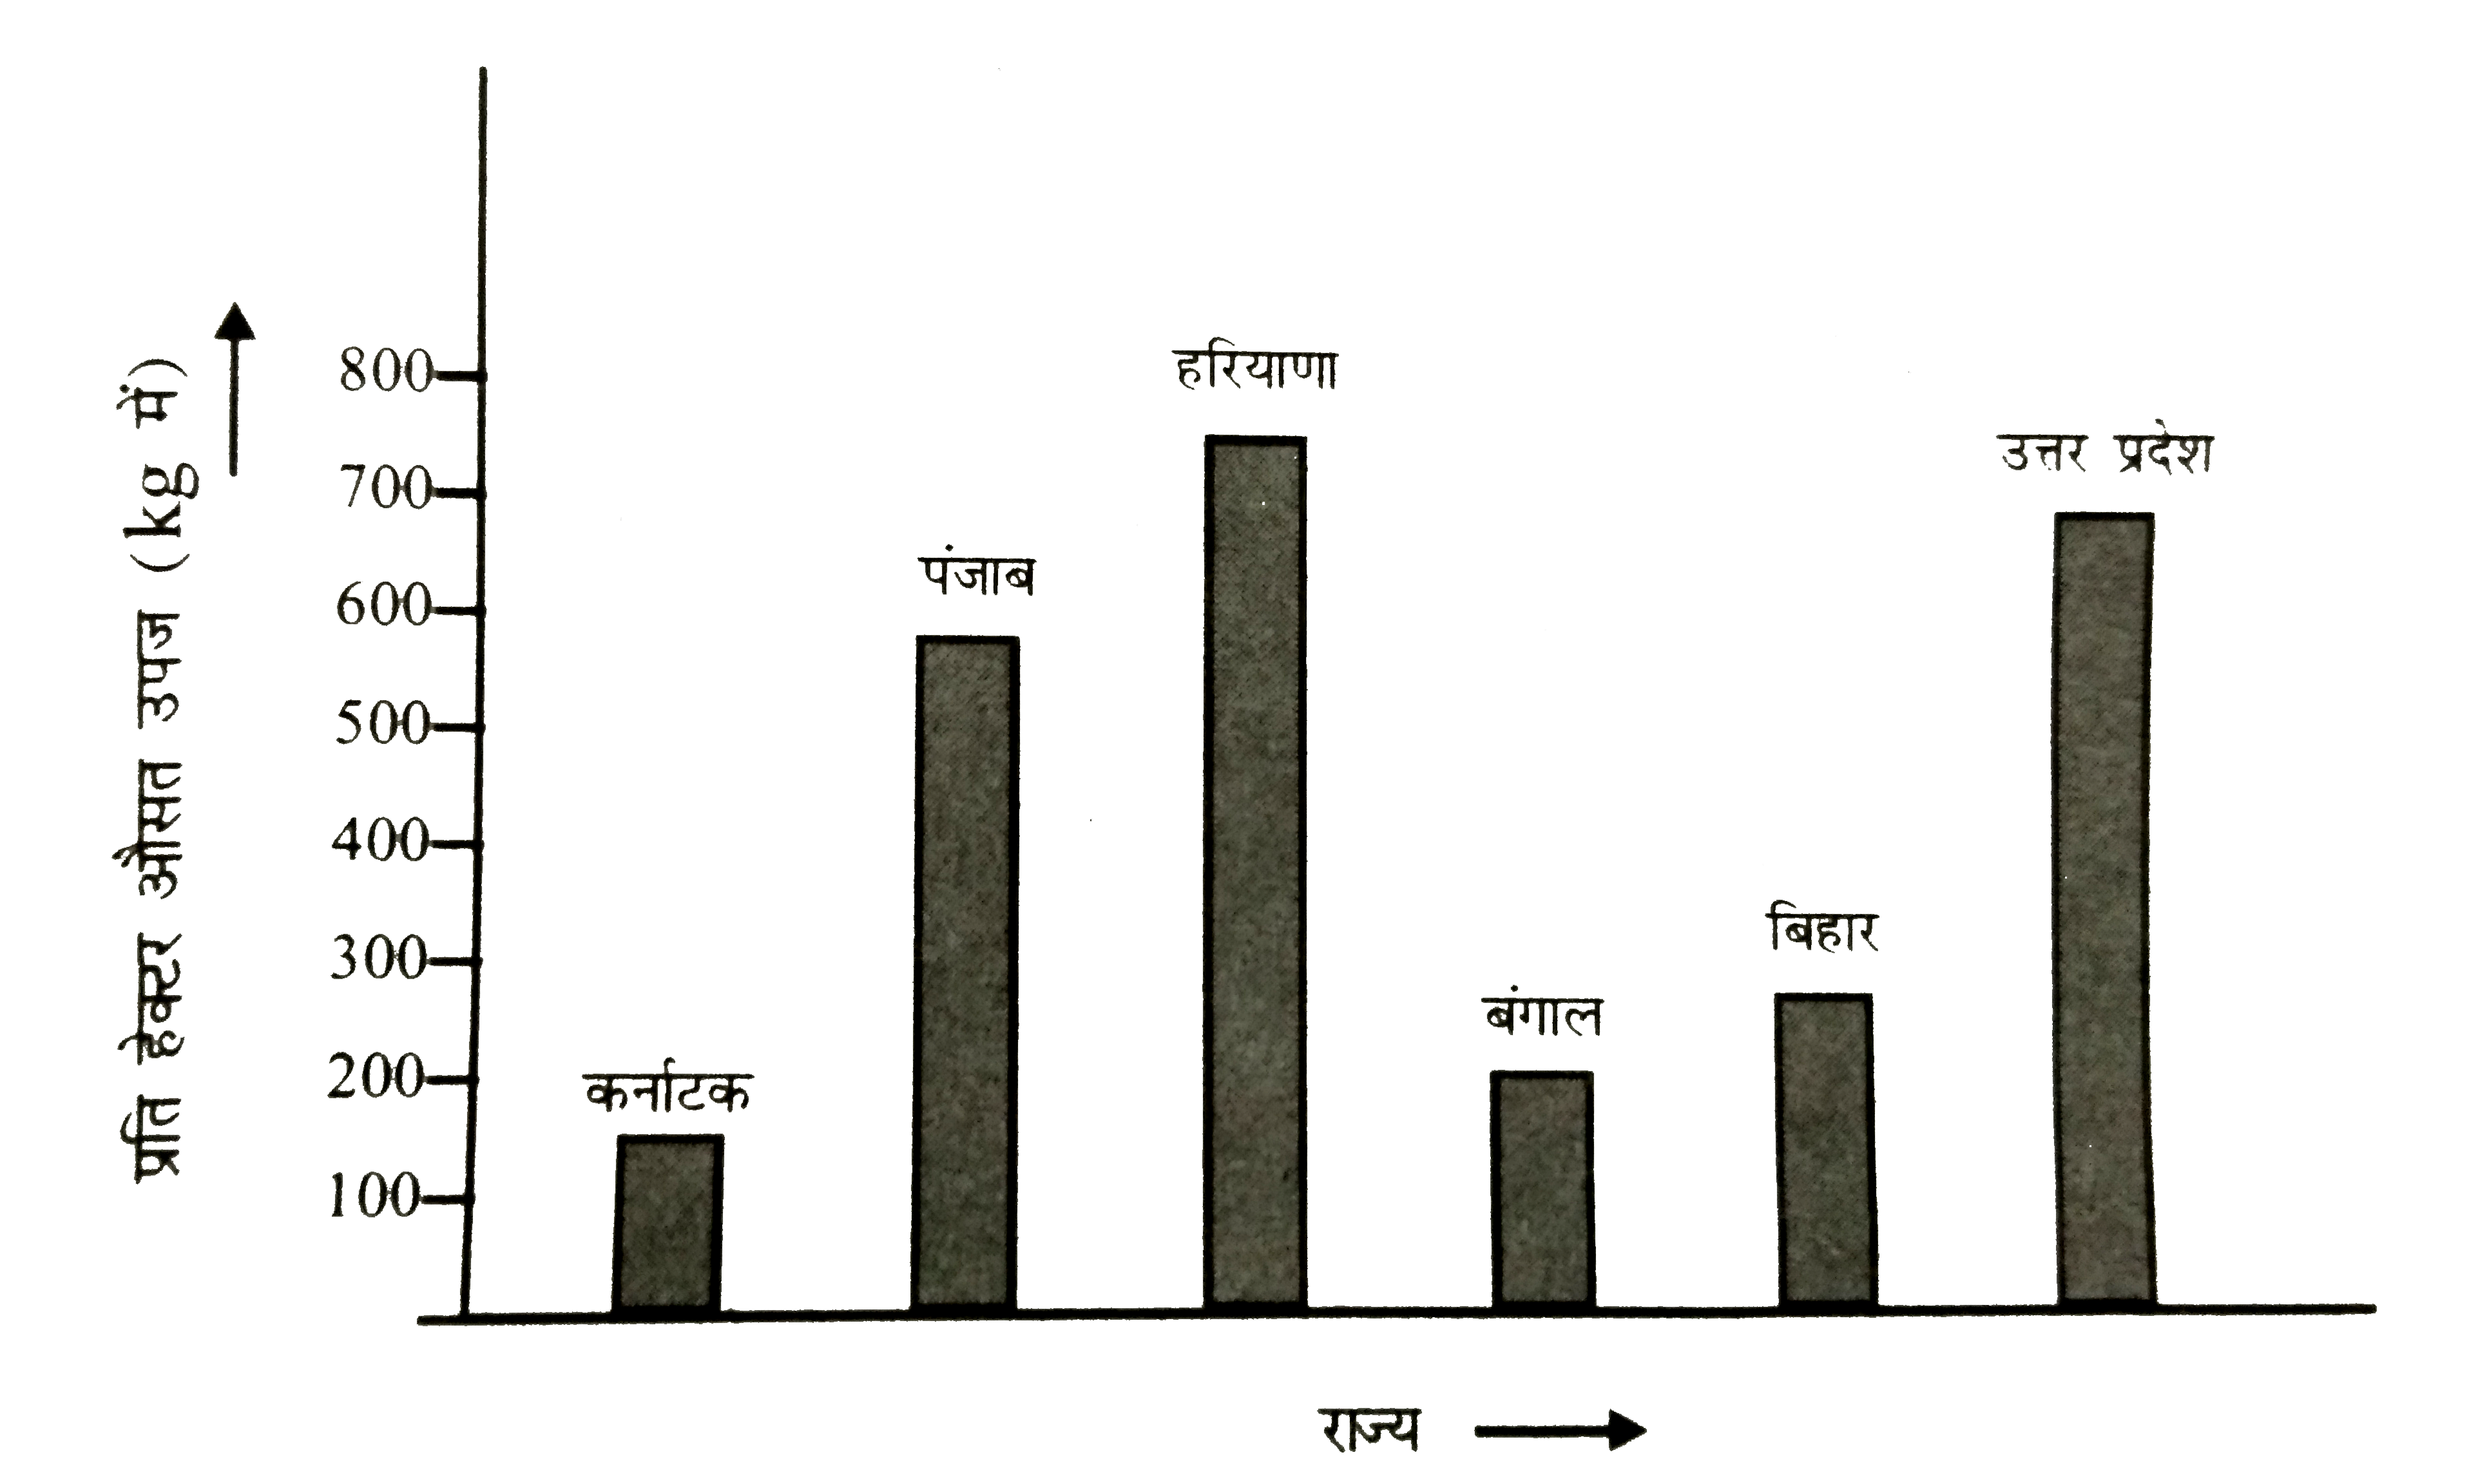
किसी वर्ष विभिन्न राज्यों में प्रति हेक्टर औसत कृषि-उपज (किलोग्राम में) के आंकड़े नीचे सरणी में दिया गया है। उन्हें एक दंड चार्ट में दिखाएँ।

Topper's Solved these Questions
- आँकड़ों का आलेखीय निरूपण BOOK - KC SINHACHAPTER - आँकड़ों का आलेखीय निरूपण EXERCISE - अभ्यास
8 Videos
- आँकड़ों का आलेखीय निरूपण BOOK - KC SINHACHAPTER - आँकड़ों का आलेखीय निरूपण EXERCISE - वस्तुनिष्ठ प्रश्न
10 Videos
- आँकड़ों का संग्रह, वर्गीकरण एवं बारम्बारता बंटनBOOK - KC SINHACHAPTER - आँकड़ों का संग्रह, वर्गीकरण एवं बारम्बारता बंटनEXERCISE - वस्तुनिष्ट प्रश्न
13 Videos
Similar Questions
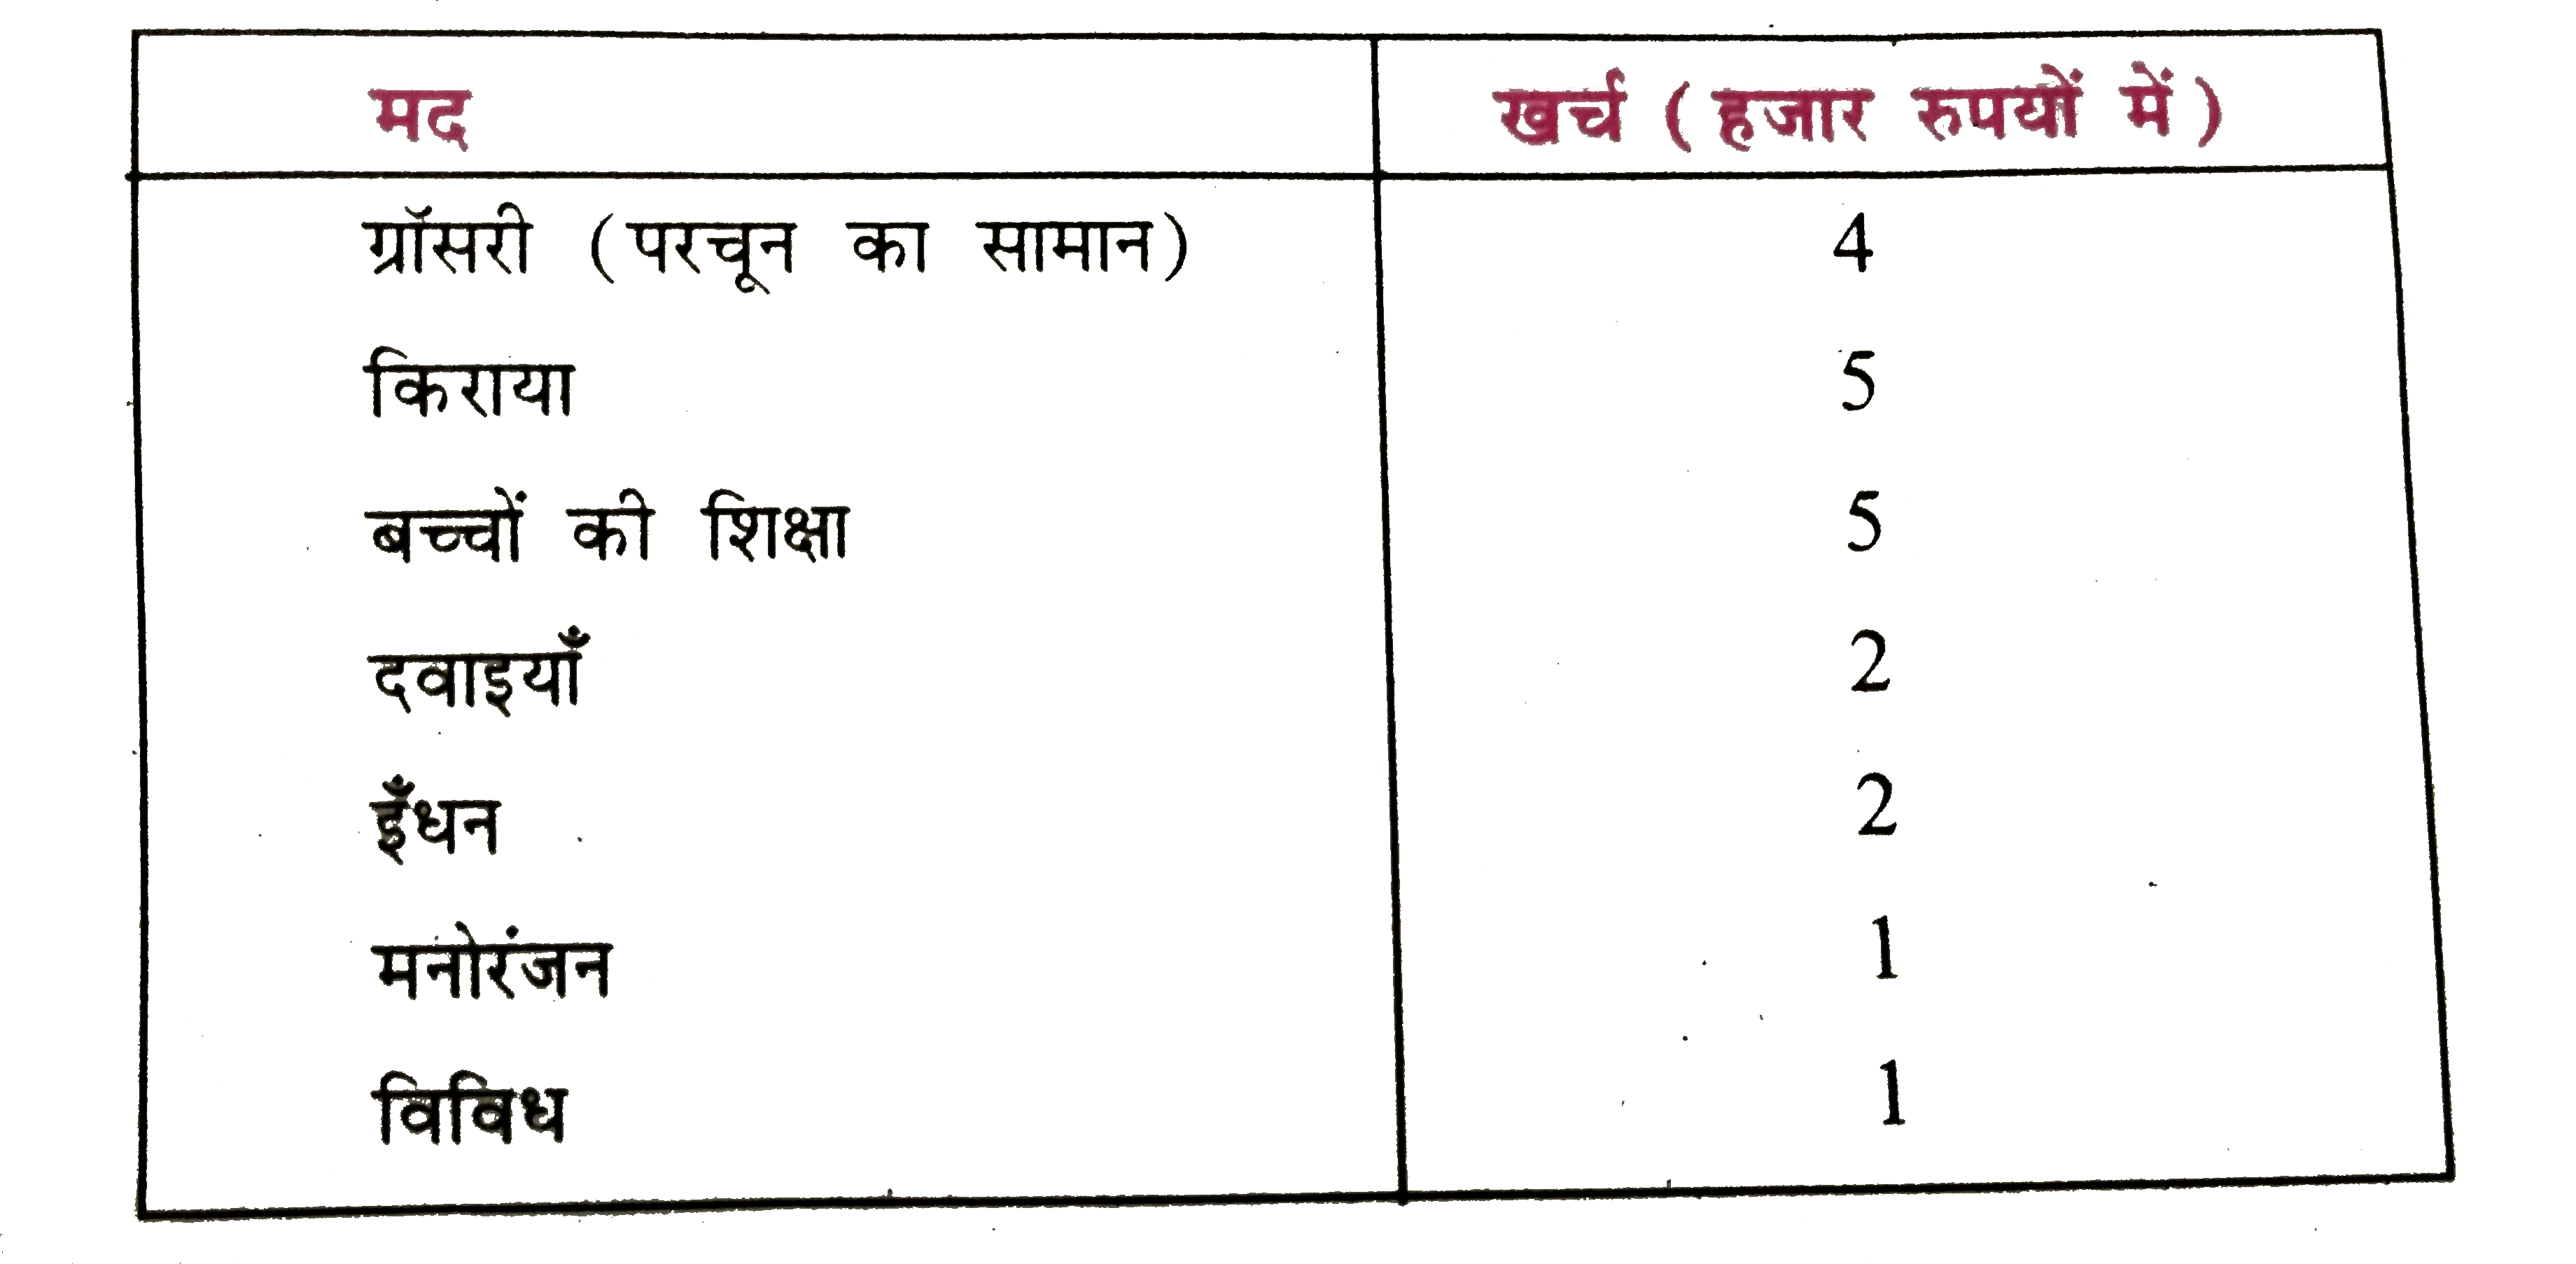
एक परिवार ने जिसकी मासिक आय 20000 रु है, विभिन्न पदो के अंतर्गत हर महीने होने वाले खर्च की योजना बनाई थी :

ऊपर दिए गए आँकड़ो का एक दंड आलेख बनाइए।
View Solutionआँकड़ो के दंड आलेख में दड़ो के निर्माण में किसका महत्व होता है ?
View Solutionसंग्रहीत आंकड़े में किसी पद की पुनरावृत्तियों की संख्या उस पद की क्या कहलाती है :-
View SolutionHow many lines of symmetry does the above figure have ?
View SolutionWhich of the following are correct chain isomers of butane ? (i)
View SolutionDetermine the point of symmetry of a regular hexagon.
View SolutionDtermine the images of the following figure about the given line :
View SolutionMatch the following Column A to Column B

View SolutionMatch the following Column A to Column B

View SolutionMatch the following Column A to Column B

View SolutionFind the area of the figure given below.

View SolutionThe area of the shaded part in the figure given below is ______.

View SolutionThe inequation represented by the graph given below is :
View SolutionThe inequation that best describes the graph given below is _________
View SolutionThe inequation that best describes the following graph is _________
View SolutionWhich inequations represent the shaded region in the given figure
View Solution

