30 दिन वाले महीने में एक नगर की सापेक्ष आर्द्रता ( % में ) यह रही है :

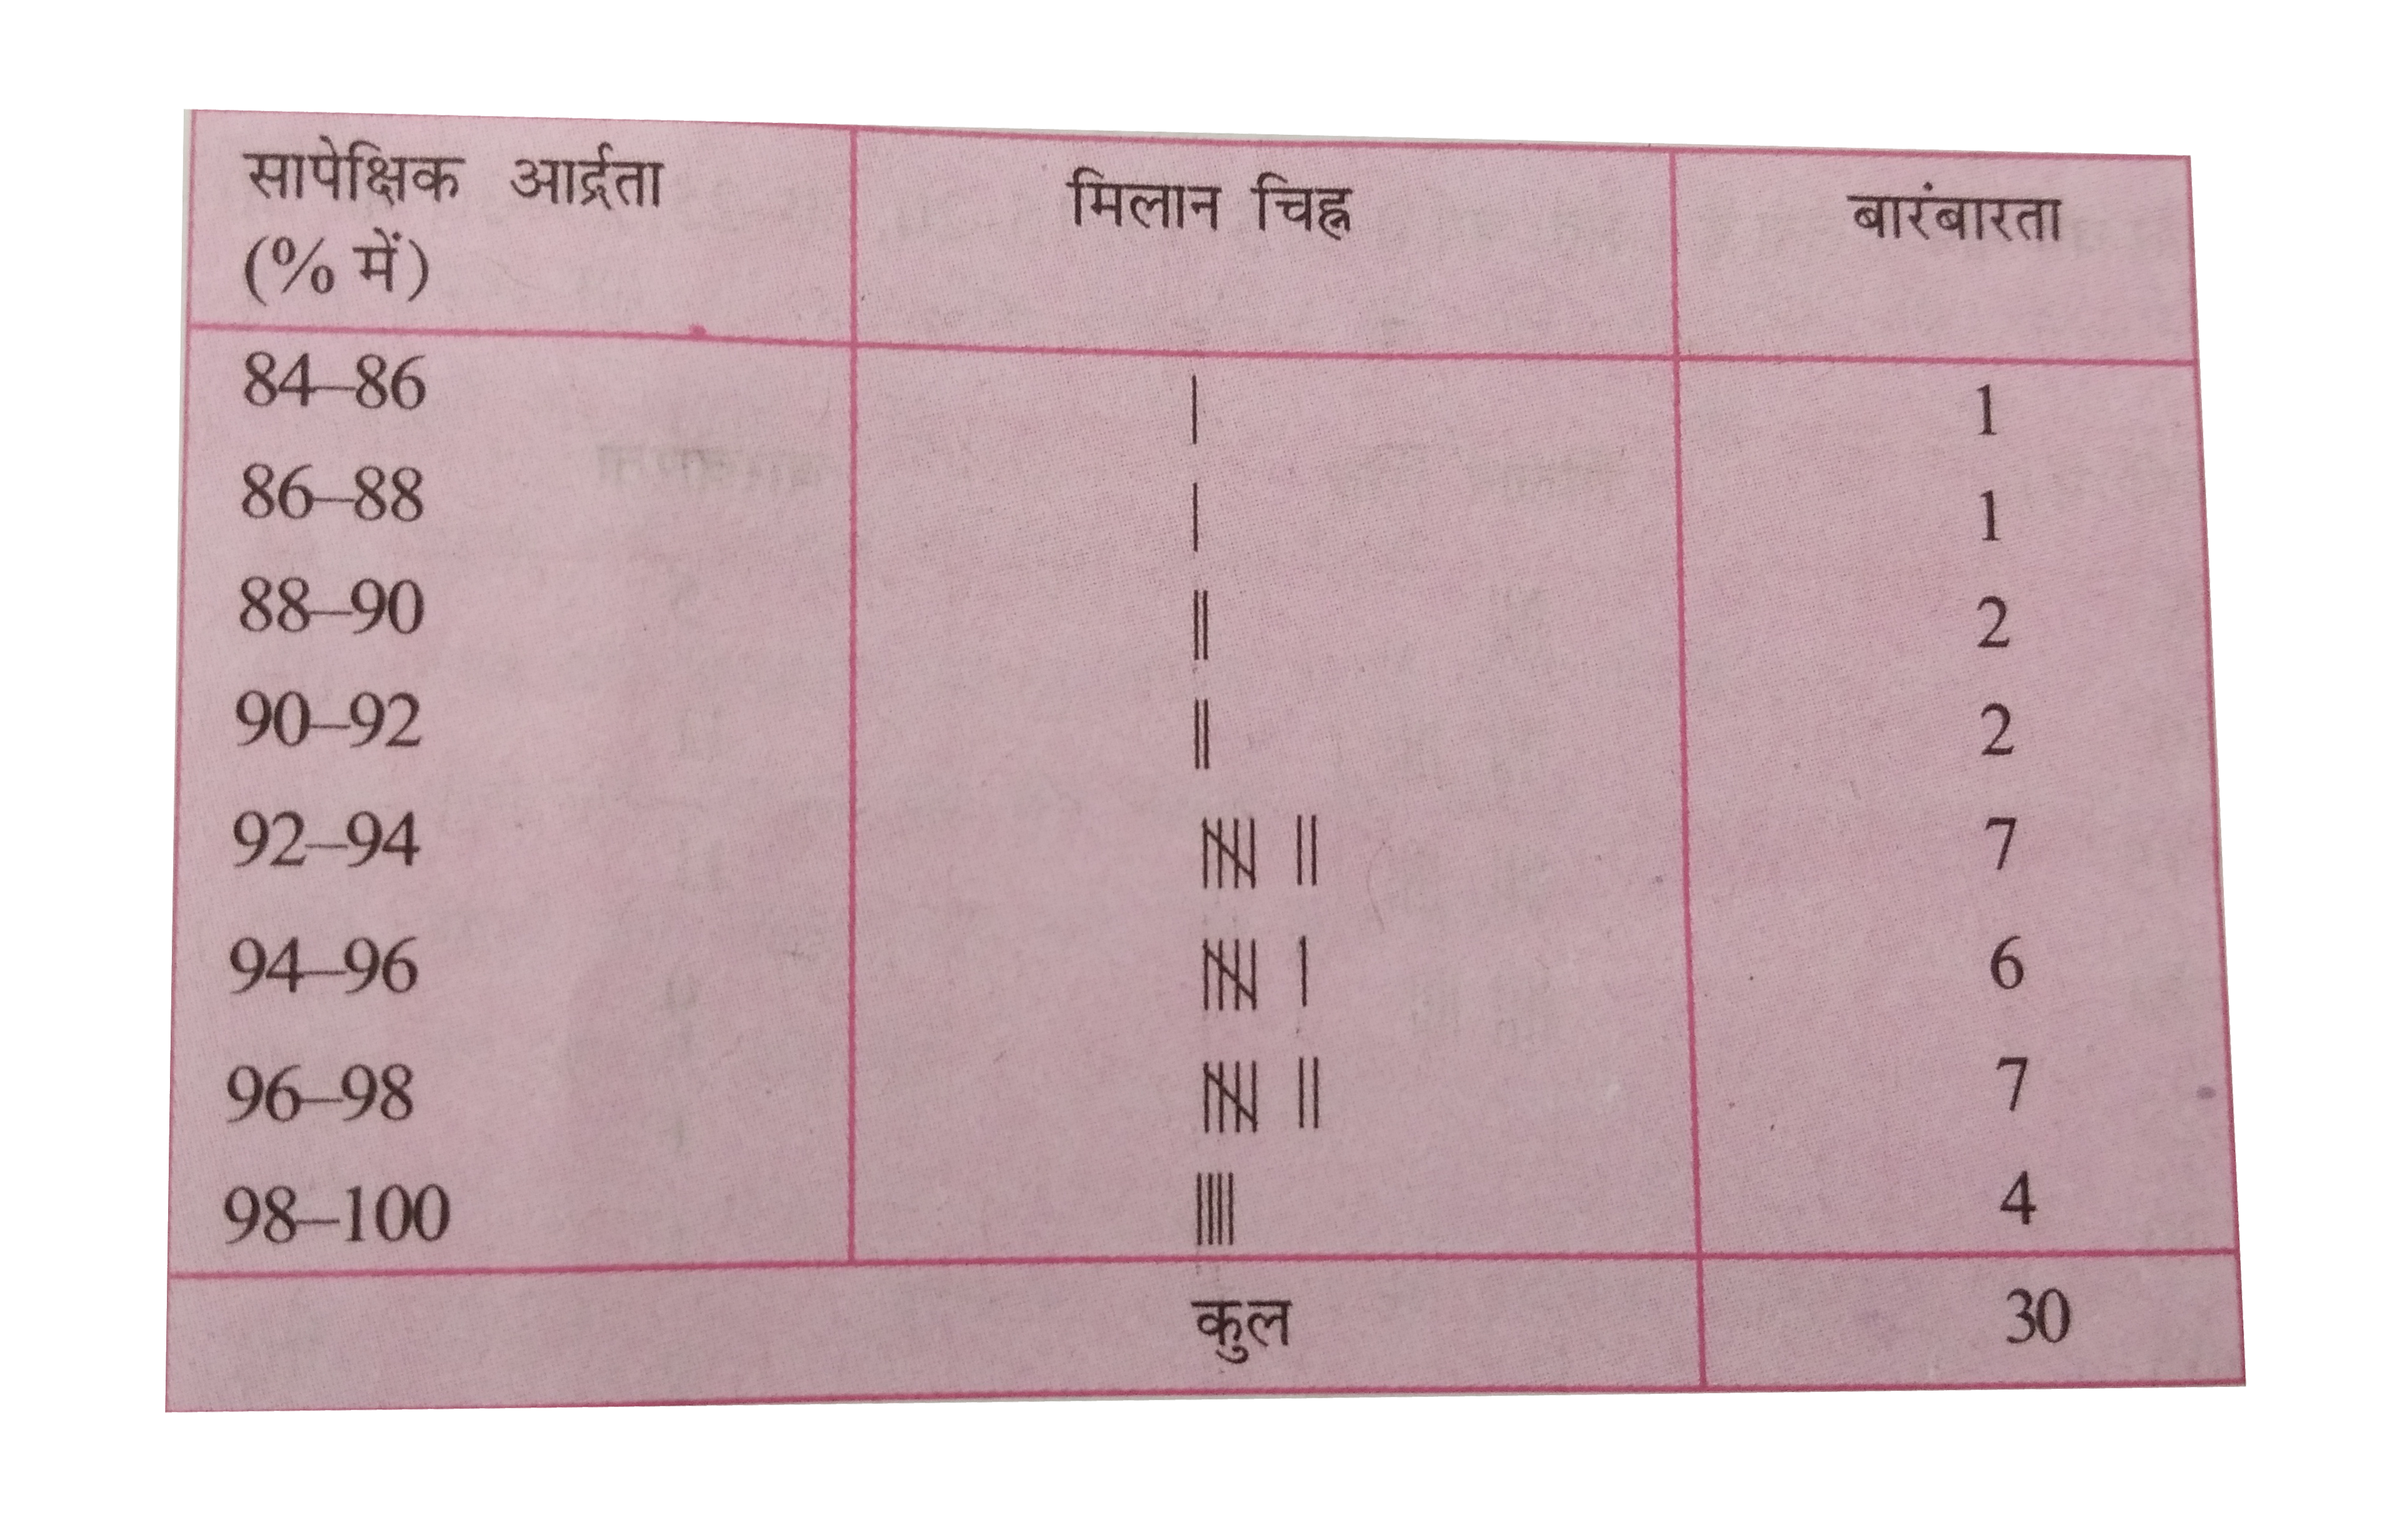
(i) वर्ग 84−86, 86−88 आदि लेकर एक वर्गाकृत बारम्बारता बंटन बनाइये।
(ii) क्या आप बता सकते है कि ये आंकड़े किस महीने या ऋतू से संबंधित है ?
(iii) इन आंकड़ों का परिसर क्या है?
(i) दिए गए आंकड़ों में न्यूनतम और अधिकतम सापेक्षित आर्द्रता (% में ) क्रमशः 84⋅9 और 99⋅2 है । यह दिया है कि वर्ग 84-86, 86 -88 लेना है , इसलिए वर्गों का माप समान है । अतः समान आकर के बंटन - 84- 86, 86 -88, 88 - 90,..., 98-100 होंगे ।

(ii) चुकी सापेक्ष आर्द्रता काफी अधिक है, इसलिए ऐसा लगता है की ये आकड़े की ये आकड़ो से सचियि बारम्बारता सारणी बनाये।
(iii) परिस्पर= 99.2-84.9=14.3
Topper's Solved these Questions
- आँकड़ों का संग्रह, वर्गीकरण एवं बारम्बारता बंटनBOOK - KC SINHACHAPTER - आँकड़ों का संग्रह, वर्गीकरण एवं बारम्बारता बंटनEXERCISE - वस्तुनिष्ट एव उतरिये प्रश्न(Objective & Very Short Answers Type Questions)
60 Videos
- आँकड़ों का संग्रह, वर्गीकरण एवं बारम्बारता बंटनBOOK - KC SINHACHAPTER - आँकड़ों का संग्रह, वर्गीकरण एवं बारम्बारता बंटनEXERCISE - वस्तुनिष्ट प्रश्न
13 Videos
- आँकड़ों का आलेखीय निरूपण BOOK - KC SINHACHAPTER - आँकड़ों का आलेखीय निरूपण EXERCISE - वस्तुनिष्ठ प्रश्न
10 Videos
- केन्द्रीय प्रवृत्ति की मापBOOK - KC SINHACHAPTER - केन्द्रीय प्रवृत्ति की मापEXERCISE - वस्तुनिष्ट प्रश्न
15 Videos
Similar Questions
रिक्त स्थानों को भरें ताकि कथन सत्य हो :
वर्ग-अंतराल 13 -22 की ऊपरी सीमा...........है
View Solutionसंग्रहीत आंकड़े में किसी पद की पुनरावृत्तियों की संख्या उस पद की क्या कहलाती है :-
View Solutionआँकड़ो के दंड आलेख में दड़ो के निर्माण में किसका महत्व होता है ?
View Solutionमाध्य, माध्यिका और बहुलक क्या हैं ?
View SolutionIdentify the cell organelle 'A' :-
ltimg src="https://d10lpgp6xz60nq.cloudfront.net/physics_images/ALN_BIO_C10_E08_018_Q01.png" width="80%"gt
View SolutionHow many lines of symmetry does the above figure have ?
View SolutionWhich of the following are correct chain isomers of butane ? (i)
View SolutionDetermine the point of symmetry of a regular hexagon.
View SolutionDtermine the images of the following figure about the given line :
View SolutionMatch the following Column A to Column B

View SolutionMatch the following Column A to Column B

View SolutionMatch the following Column A to Column B

View SolutionThe inequation represented by the graph given below is :
View SolutionThe inequation that best describes the graph given below is _________
View SolutionThe inequation that best describes the following graph is _________
View SolutionWhich inequations represent the shaded region in the given figure
View Solution
