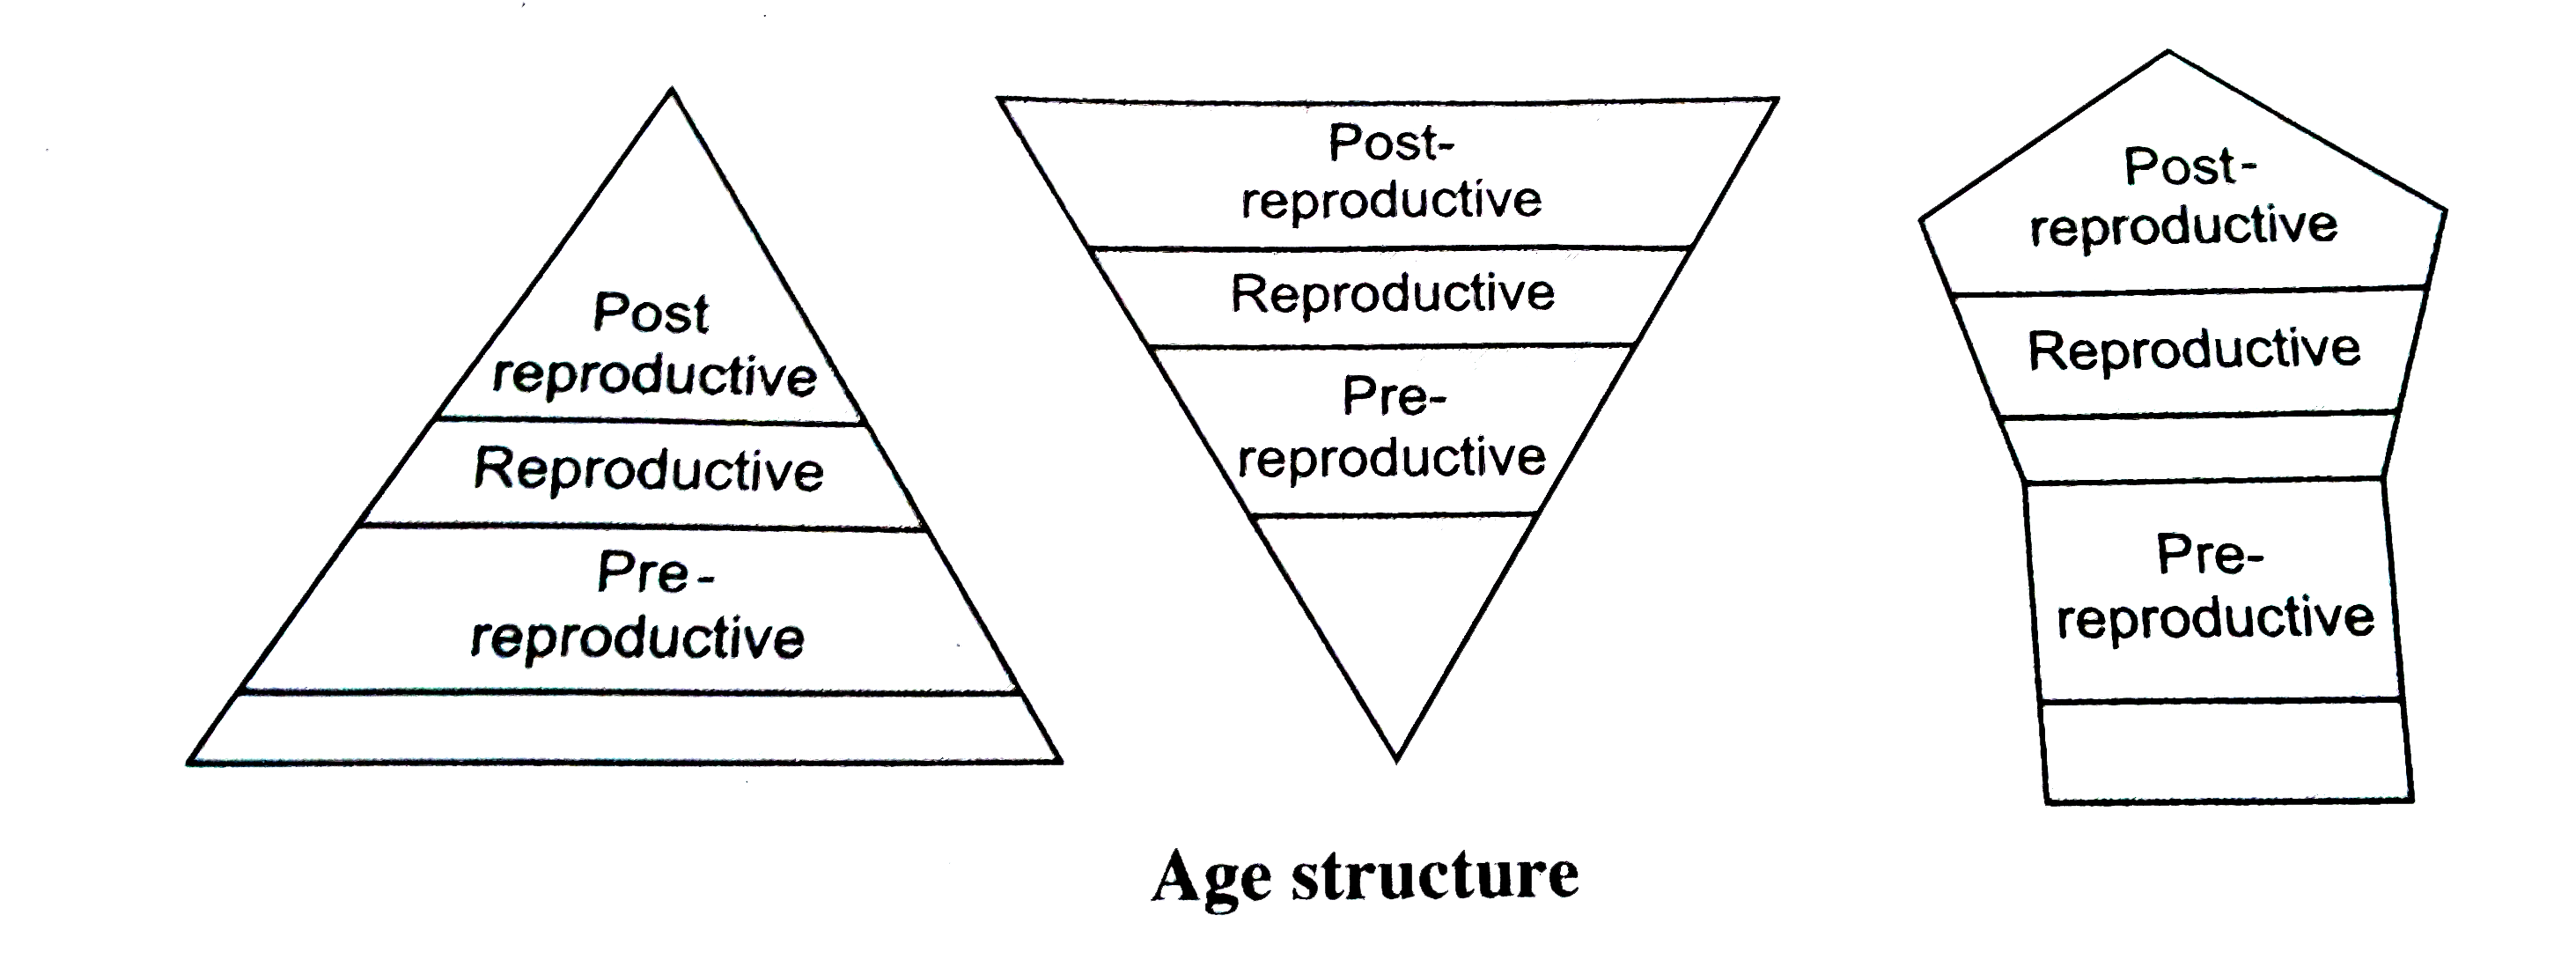
With the help of suitable diagrams, explain how the age structures determine the trend of population ?
The population is divided in three age groups :
(a) Young (0-14 years) Pre -redroductive age group.
(b) Adult (15-59 years) Reproductive age group.
© Old ( 60 years and above) Post - reproductive age group .
The distribution of these groups determine the trend of population .
(a) Growing population : Population having larger numbr of individuals of the pre-reproductive age groups show a very rapid rate.
(b) Steady Population : When the pre-reproductive and post- reproductive age group is same then the population remains steady.
(C) Decline Population : Larger number of post- reproductive age groups make population decline.

Topper's Solved these Questions
- JULY 2017 BOOK - GURUKUL PUBLICATION - MAHARASHTRA PREVIOUS YEAR PAPERSCHAPTER - JULY 2017 EXERCISE - Section-II ( ZOOLOGY)
24 Videos
- JULY 2010BOOK - GURUKUL PUBLICATION - MAHARASHTRA PREVIOUS YEAR PAPERSCHAPTER - JULY 2010EXERCISE - SECTION-II ZOOLOGY
24 Videos
- JULY 2018BOOK - GURUKUL PUBLICATION - MAHARASHTRA PREVIOUS YEAR PAPERSCHAPTER - JULY 2018EXERCISE - SECTION - II
24 Videos
Similar Questions
With the help of suitable diagrams, explain how the age structures determine the trend of population ?
View SolutionWith the help of suitable diagrams, explain mitosis in detail.
View SolutionWith the help of suitable diagrams, explain the mitosis in detail.

View SolutionWith the help of suitable diagrams explain the mitosis in detail.
View SolutionWith the help of a suitable example, explain protandry.
View SolutionWith the help of a suitable diagram describe the structure of a nucleosome.
View SolutionWith the help of a diagram, explain the structure of mature male gametophyte .
View SolutionWith the help of a suitable diagram describe the structure of a nucleosome.
View SolutionWith the help of suitable example, explain how science is applied.
View SolutionWith the help of labelled diagram explain the structure of human respiratory system.
View Solution
