Complete Solutions to Exercise of chapter STATISTICS of Class 9 book with complete answers and questions
| Class 9 | MATHS |
| Chapter | STATISTICS |
| CHETANA PUBLICATION | Exercise |
| Number Of Questions | 48 |
| Academic Year | 2023-24 |
Which of the following data is not primary?
02:57View SolutionWhat is the upper class limit for the class 15-35?
00:40View SolutionWhat is the class mark of class 25-35?
00:43View SolutionIf the classes are 0-10, 10-20,20-30… then in which class should the observation 10 be inclused?
02:44View SolutionThe mean of five numbers is 50, out of which mean of 4 numbers is 46, Find the `5^(th) ` number.
01:55View Solutionmean of 100 observations is 40. The 9 observation is 30. If this is replaced by 70 keeping all other observation same, find the new mean.
03:26View SolutionWhat is the mode of 19, 19, 15, 20, 25, 15, 20, 15?
00:57View SolutionWhat is the median of 7, 10, 7, 5, 9, 10?
01:28View SolutionFrom following table, what is the cumulative frequency of less than type for the class 30- 40?
 01:08View Solution
The mean of the data 87, 92, 63, 78, 92, 59, 72, 66, is……..
01:27View SolutionThe mark of a class test are given below 28, 26,17, 12, 14, 19, 27, 26, 21, 16, 15. The median of marks obtained is……………
02:11View SolutionThe mode of 18, 14, 22, 23, 14, 18, 17, 18, 28, 28, 14, 25, 14 is……………
01:13View SolutionThe mean of eleven number is 47. If a number is added then the mean is increased by 2. The new number is…………….
01:49View SolutionA cricket player scored run in different matches as follows : 36, 41, 57, 89, 105, 103, 17. The median of runs scored is…………..
01:26View SolutionClassify following information as primary data or secondary data. Number of students in our class.
02:50View SolutionClassify following information as primary data or secondary data.Number of fans in our class.
01:08View SolutionClassify following information as primary data or secondary data.Electricity bills of our house for last two years.
01:27View SolutionClassify following information as primary data or secondary data.Election results obtained from television or newspaper
01:17View SolutionClassify following information as primary data or secondary data. Leteraly rate figures obtained from eductaional survey.
01:20View SolutionAll 30 members of a 'Nature Club' in a school planted trees in the foundation day. The number of saplings planted by each member is given below. Prepare an ungrouped frequency distribution table:5, 4, 4, 6, 7, 4, 3, 5, 6, 4, 3, 7, 5, 4, 3, 2, 7, 6, 5, 3, 8,3, 2, 4, 5, 6, 5, 4, 4, 5
04:01View SolutionThe consumption of electricity for one month (in units of 40 houses in a colony are given below: 59, 52, 65, 101, 115, 108, 95, 65, 98, 62, 84, 76, 63,128, 121, 61, 118, 108, 116, 129, 81, 87, 78, 89, 75,92, 105, 129, 81, 87, 95, 116, 127, 107, 100, 80, 82,65, 91, 101
03:55View SolutionFind the class mark of the class 0.5 to20.5
01:44View SolutionFor class interval 35-45 write the lower class limit and the upper class limit.
01:06View SolutionComplete the following table.
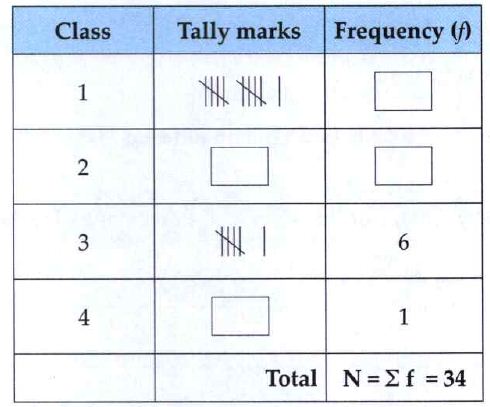 02:20View Solution
Complete the followiing commulative frequency.
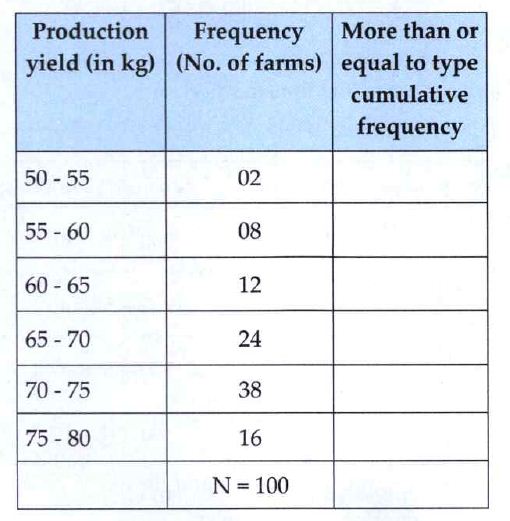 01:15View Solution
Using the data in Q.9 answer the question. How many forms yield more than 65 kg?
 00:49View Solution
Using the data in Q.9 answer the question. How many forms yield more than 70 kg?
00:53View SolutionUsing the data in Q.9 answer the question. How many forms yield more than 55 kg?
01:30View SolutionUsing the data in Q.9 answer the question. How many forms yield more than 75 kg?
00:41View SolutionThe marks of a class test are given below: 28,26,17,12,14,19,27,26,21,16,16 Find the median
02:10View SolutionThe ages of teachers of a school are 53,37,39,51,46,41,44,47,55,48 Find the median
03:07View SolutionThe height of students are given below Find the mode of height.
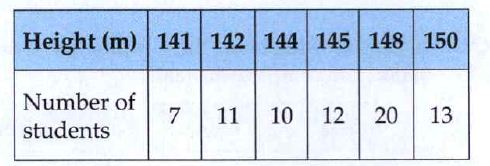 01:23View Solution
The weight of students are given below Find the mode
 03:38View Solution
The average of monthly alary of 20 employees in a company is Rs. 7650. If the manager salary is added, the average salary increases by Rs. 550 per month. What is the manager monthly salary?
04:05View SolutionThe mean weight of 25 students of a class is 48 kg. If the mean weight of first 13 students is 50 kg and the last 13 students is 46 kg. Find the weight of the 13th students?
03:57View SolutionWhat is the median of 7, 10, 7, 5, 9, 10?
01:28View SolutionIf class mark is10 and width is 6 then the Lower limit of the class =`square` Upper limit of the class =`square`
02:25View SolutionComplete the table:
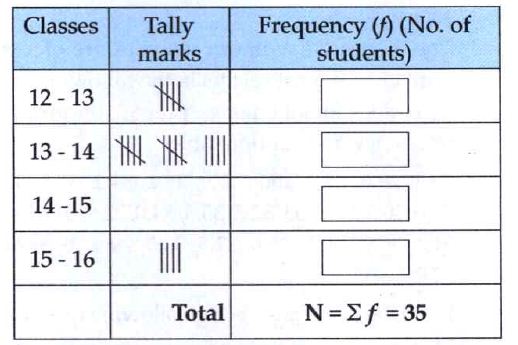 02:05View Solution
The mean of 5 observations is 50. One of the observation was removed from the data, hence the mean became45. Find the observation which was removed
01:55View SolutionThe height of students are given below Find the mode of height.
 01:23View Solution
In a basket there are10 tomatoes.The weight of each of these tomatoes in grams is as follows: 60, 70, 90, 95, 50, 65, 70, 80, 85, 95.Find the median of the weights of tomatoes.
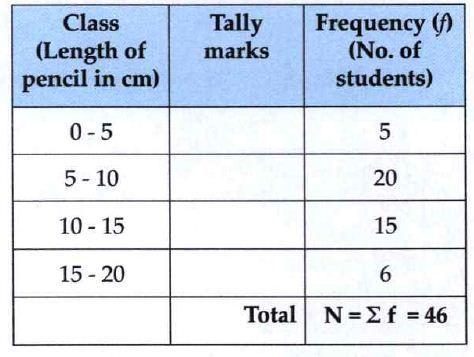
01:12View SolutionIn a school, 46 students of 9th standard, were told to measure the lengthsof the pencils in their compass-boxesin centimetres.Thedata collected was as follows. gms 13-14 14 -15 15-16 16, 15, 7, 4.5, 8.5, 5.5, 5, 6.5,6, 10, 12, 13, 4.5, 4.9 16, 11,9.2 7.3, 11.4, 12.7 13.9 16, 5.5, 9.9,8.4, 11.4, 13.1, 15, 4.8, 10, 7.5, 8.5,6.5, 7.2, 4.5, 5.7, 16, 5.7 6.9, 8.9,9.2, 10.2, 12.3, 13.7, 14.5, 10 By taking inclusive classes 0-5, 5-10, 10-15..prepare a group frequency distribution table.
 02:44View Solution
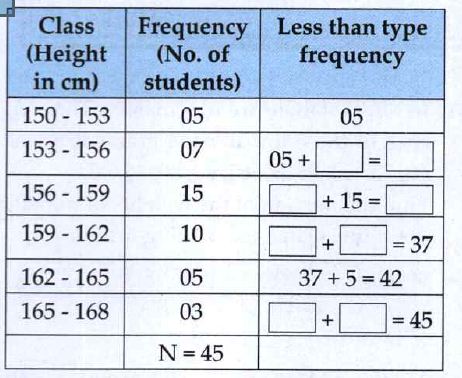
Complete the following cumulative frequency table:
 00:49View Solution
There are 68 students of 9th standard from Model High school, Nandpur. They have scored following marks out of 80, in written exam of mathematics.70, 50, 60, 66, 45, 46, 38, 30, 40, 47, 56,68, 80, 79, 39, 43, 57, 61, 51, 32, 42, 43,75, 43, 36, 37, 61, 71, 32, 40, 45, 32, 36,42, 43, 55, 56, 62, 66, 72, 73, 78, 36, 46,47, 52, 68, 78, 80, 49, 59, 69, 65, 35, 46,56, 57, 60, 36, 37, 45, 42, 70, 37, 45, 66,56, 47 By taking classes 30-40, 40-50, less than type cumulative frequency table. Using the table, answer the following questions How manystudents, have scored marks less than 80?
09:05View SolutionThere are 68 students of 9th standard from Model High school, Nandpur. They have scored following marks out of 80, in written exam of mathematics.70, 50, 60, 66, 45, 46, 38, 30, 40, 47, 56,68, 80, 79, 39, 43, 57, 61, 51, 32, 42, 43,75, 43, 36, 37, 61, 71, 32, 40, 45, 32, 36,42, 43, 55, 56, 62, 66, 72, 73, 78, 36, 46,47, 52, 68, 78, 80, 49, 59, 69, 65, 35, 46,56, 57, 60, 36, 37, 45, 42, 70, 37, 45, 66,56, 47 By taking classes 30-40, 40-50, less than type cumulative frequency table. Using the table, answer the following questions How manystudents, have scored marks less than 60?
09:05View SolutionThe monthly salaries in Rs. of 30 workers in a factory are given below:5000, 7000, 3000, 4000, 4000, 3000, 3000, 3000,8000, 4000, 4000, 9000, 3000, 5000, 5000, 4000,4000, 3000, 5000, 5000, 6000, 8000, 3000, 3000,6000,7000,7000,6000, 6000,4000 From the above data find the mean of monthly salary.
05:33View SolutionThe monthly maximum temperature of a city is given in degree celcius in the following data. By taking suitable classes, prepare the grouped frequency distribution table 29.2, 29.0, 28.1, 28.5, 32.9, 29.2, 34.2, 36.8, 32.0,31.0, 30.5, 30.0, 33, 32.5, 35.5, 34.0, 32.9, 31.5, 30.3,31.4, 30.3, 34.7, 35.0, 32.5, 33.5, 29.0, 29.5, 29.9, 33.2, 30.2 From the table,answer the following questions. For how many days the maximum temperature was less than `34@`
09:36View SolutionThe monthly maximum temperature of a city is given in degree celcius in the following data. By taking suitable classes, prepare the grouped frequency distribution table 29.2, 29.0, 28.1, 28.5, 32.9, 29.2, 34.2, 36.8, 32.0,31.0, 30.5, 30.0, 33, 32.5, 35.5, 34.0, 32.9, 31.5, 30.3,31.4, 30.3, 34.7, 35.0, 32.5, 33.5, 29.0, 29.5, 29.9, 33.2, 30.2 From the table,answer the following questions. For how many days the maximum temperature was less than `34@`
09:36View Solution
Exercise questions and complete solutions for chapter STATISTICS of CHETANA PUBLICATION of Class 9
