Complete Solutions to Try these of chapter DATA HANDLING of Class 8 book with complete answers and questions
| Class 8 | MATHS |
| Chapter | DATA HANDLING |
| NAND LAL PUBLICATION | Try these |
| Number Of Questions | 14 |
| Academic Year | 2023-24 |
Draw an appropriate graph to represent the given information.
 02:37View Solution
Draw an appropriate graph to represent the given information.
 03:10View Solution
A group of students were asked to say which animal they would like most to have as a pet.The results are given below:dog,cat,cat,fish,cat ,rabbit,dog,cat,rabbit,dog,cat,dog,dog,dog,cat,cow,fish,rabbit,dog,cat,dog,cat,cat,dog,rabbit,cat,fish,dog.
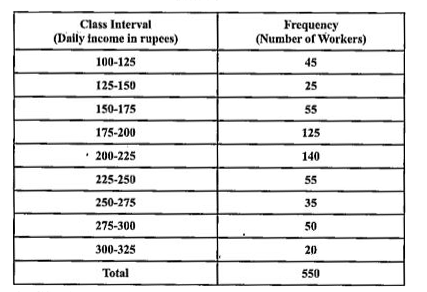
Make a frequency distibution table for the same.01:57View SolutionStudy the following Frequency distribution table and answer the question given below. Frequency Distrubution of Daily Income of 550 workers of a factory
`" "` Table

(i) What is the size of the class intervals?
(ii) Which class has the highest frequency?
(iii) Which class the lowest frequency?
(iv) Which two classes have the same frequency?03:40View SolutionConstruct a frequency distribution table for the data on weights ( in kg.) of 20 students of a class using intervals 30-35,35-40 and so on.
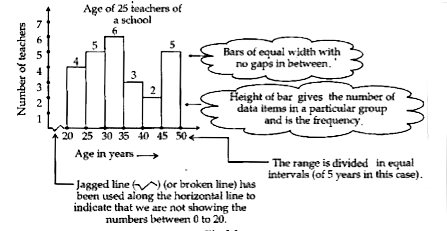
40,38,33,48,60,53,31,46,34,36,49,41,55,49,65,42,44,47,38,39.04:09View SolutionThe following graph is another historam (Fig.)

From the bars of this histogram, we can answer the following questions :
(i) How many teachers are of age 45 years or more but less than 50 years?
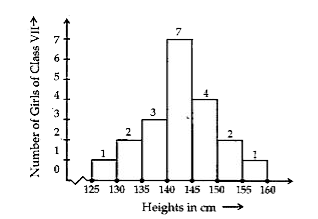
(ii) How many teachers are of age less than 35 years?01:15View SolutionObserve the histogram (fig.) and answer the question given below:

(i) What information is being given by the histogram?
(ii) Which group contains maximum girls.
(iii) How many girls have height 145 cms. and more?
(iv) If we divide the girls into the following three categories, how many would there be in each?
150 cm and more - Group A
140 cm to less than 150 cm - Group B
Less than 140 cm - Group C03:13View SolutionWhich two ttypes of programmes have number of viewers equal to those watching sports channels ?
02:30View SolutionDraw a pie chart of the data given below:
The time spent by a child during a day.
Play = 4 hours03:14View SolutionIf you try to start a scooter,what are the possible outcomes ?
01:04View SolutionWhen a die is thrown, what are the six possible outcomes?
00:59View SolutionWhen you spin the wheel shown, what are the possible outcomes (see adjoining figure) List them.
 02:33View Solution
You have a bag with five identical balls of different colours and you are to pull out (draw ) a ball without looking at it,list theoutcomes you would get (Fig.)
 01:00View Solution
Suppose you spin the wheel
(i) List the number of outcomes of getting a green sector and not getting a green sector on this wheel. (fig.)
(ii) Find the probability of getting a green sector.
(iii) Find the probability of not getting a green sector.
 03:43View Solution
Try these questions and complete solutions for chapter DATA HANDLING of NAND LAL PUBLICATION of Class 8
All Exercises from NAND LAL PUBLICATION Class 8 MATHS DATA HANDLING
- ADDITIONAL QUESTIONS FOR PRACTICE (Long Answer Type Questions)
- ADDITIONAL QUESTIONS FOR PRACTICE (Objective Type Questions)
- ADDITIONAL QUESTIONS FOR PRACTICE (Short Answer Type Questions)
- EXERCISE-5.1
- EXERCISE-5.2
- EXERCISE-5.3
- Question
- SAMPLE PAPER FOR PRACTICE
- SAMPLE PAPER FOR PRACTICE (Answer the multiple choice question)
- SAMPLE PAPER FOR PRACTICE (Fill in the blanks)
- Think, Discuss and Write
- Try these
