HomeBooksClass 7RD SHARMA MATHS (ENGLISH)DATA HANDLING 3

Free Solutions to chapter DATA HANDLING 3 of RD SHARMA MATHS (ENGLISH) of Class 7 book with complete answers and questions

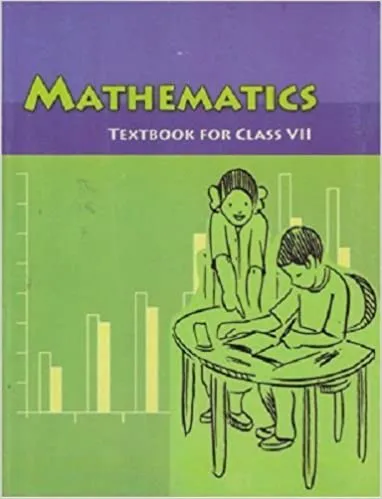
RD Sharma Class 7 Maths Solutions Chapter 24 Data Handling III (Construction of Bar Graphs) Data Handling means collection, recording and representation of huge amount of data in the form of numbers, graphs, or charts, to draw inferences.

One of the most used form of data representations is Bar Graph. Bar graph is a graphical representation of data using bars of different heights to compare data on specific parameters. Data Handling helps you to organize the raw data in numeric form or any other particular form to easily understand and interpret some meaningful information regarding that data.

In Chapter 24 Data Handling- III (Construction of Bar Graphs), the students will learn about the collection of data and organizing the data in the form of bar graphs. Doubtnut provides RD Sharma Class 7 Maths Solutions Chapter Data Handling- III (Construction of Bar Graphs) in the form of video format.

The video solutions come as a boon to the students as it is prepared in the language that is easy to understand and comprehend. It also enables you to quickly resolve even the complex problems. The RD Sharma book is a popular maths reference book amongst students studying under the CBSE educational board.

CBSE board follows NCERT books in its curriculum; however, for subject like Maths NCERT books do not suffice the learning purpose. NCERT books fall short in providing ample sovled examples. The significance of reference book like RD Sharma maths book, for learning a subject is parallel with the significance of the apt solution guide for the reference book.
There are so many exercise questions given in the RD Sharma book that is to be worked out by the students. Therefore, there arises a need that assures that the students are going the right way in solving the exercise problems.

Hence it is important for the students to take help from a tutorial platform like doubtnut. com, where the students would get comprehensive guidance in solving the complex questions. Doubtnut is an online tutorial platform where one can find the video solutions for all the exercise problems of the RD Sharma books.

The video tutorials are curated and reviewed by the subject matter experts of IIT cadre. The video solutions are presented in exercise-wise pattern. The video solutions are provided at absolutely zero cost.

The video solutions explain a particular solution in a step-by-step manner, thus providing a clutter-free understanding of the concept. Talking of the current chapter, one can find RD Sharma solution for Class 7 Chapter 24 Data Handling- III (Construction of Bar Graphs) on doubtnut.

com, and it offers every important element required in the learning process to excel through the unit. Data Handling- III (Construction of Bar Graphs): RD Sharma Class 7 Maths Chapter 24 Solutions A bar graph is a graphical representation of data in the form of vertical or horizontal bars to compare data among categories.

A bar graph may run horizontally or vertically. The most usual type of bar graph is vertical bar graph. The longer the bar, the greater its value. Bar graphs have three key Attributes A bar graph makes it easy to compare sets of data between different groups at a glance.

For example, you can see easily which items are taking the largest portion of your budget by glancing at the below chart rather than looking at a string of numbers. The graph represents categories on one axis and a discrete value on the other axis.

The aim is to define the relationship between the two axes. Bar charts can also present big changes in data over a period of time. Double Bar Graph A double bar graph is a graphical representation of data using two rectangular bars besides each other with different heights.

The bars can be aligned in vertical manner or horizontal. We can use a double bar graph to compare two collections of data at a glance. Applications of Bar Graph Creating and analyzing bar graphs is useful not just in the math classroom, but also in real world life, both personal and business.

Bar graphs provide information that is readily understood with a quick glance. Bar graph presents the information in a lucid way to compare data between different categories. Bar graphs are an effective visual to use in presentations and reports.

They are popular because they allow the reader to recognize patterns or trends far more easily than looking at a table of numerical data. The chapter contains numerous examples to help the students to learn about bar graphs m.

There is an explanation of all the steps needed to record and organize data in this RD Sharma Class 7 Maths Solution for Chapter 24 Data Handling- III (Construction of Bar Graphs). It will help the student to represent a large number of figures in the form of rectangular bars based on respective frequencies of the specific information.

Why Doubtnut for learning Data Handling- III (Construction of Bar Graphs) Doubtnut provides solutions for the unsolved exercises of the RD Sharma book. The video solutions cover all the topics of the Chapter 24, Data Handling- III (Construction of Bar Graphs), as per the prescribed CBSE syllabus along with highlighting the intricate details in a clear and step-by-step manner.

Video solutions presents the solutions in an exercise wise pattern. The subject matter experts of doubtnut have curated and reviewed the video solutions. The students can get their doubts cleared by just posting the picture of the doubt question from the book on doubtnut website or app and answer will be provided in seconds.

Get Started with Doubtnut. com At Doubtnut, we strive to facilitate the easy and rightful access to quality study material to students of classes 6 to 12, at free of cost. You can also download our app “Doubtnut” from Google play store.

Start your learning process with doubtnut and feel the change in your confidence to solve any complex question. .