All Books from Class 6th to 12th with complete questions, answers and solutions
Books for Class 12
Books for Class 11
Books for Class 10
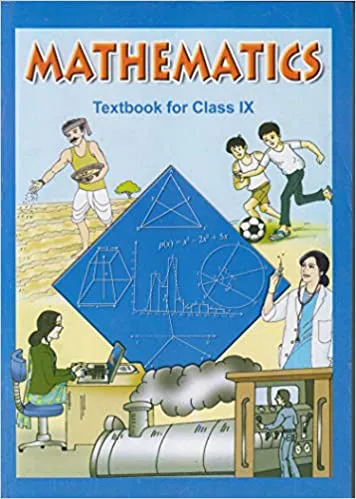
Books for Class 9
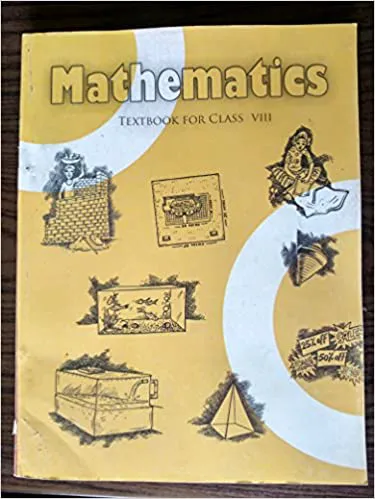
Books for Class 8
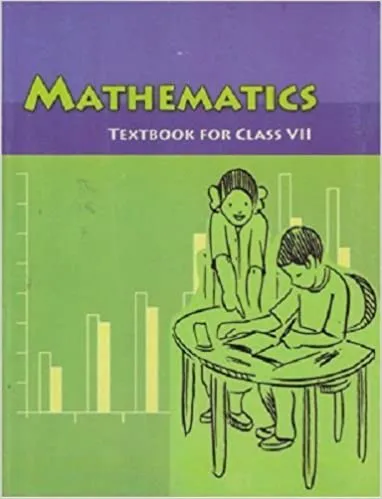
Books for Class 7
Books for Class 6
With the Doubtnut, you don’t need to buy any expensive books. Doubtnut is a hub for textbooks and their solutions. Explore Doubtnut’s rich library of textbooks for all subjects from 6th to 12th. Search for your textbook by title, then browse by chapter, to find detailed, step-by-step solutions for subjects like Maths, Biology, Chemistry, General Science, English Literature, Physics, and Social Science. Our textbook solutions are aimed at offering students e-learning solutions at zero cost & serve as an excellent resource in examination preparation. The solutions are from the latest edition of the textbook and are curated in line with CBSE's latest marking scheme pattern. These are curated by India’s top examination experts and are recommended for students preparing for JEE Main, NEET, JEE Advanced, CBSE board exams, ICSE, ISC as well as other state board exams. The solutions are provided to all the theoretical as well as the numerical problems from an examination point of view. We have followed a systematic layout covering all concepts in a chapter-wise manner. Get started now. Click on the name of the book which you want to study and you will be directed to its chapter page where you can find detailed, step-wise solutions for every question. Find accurate and precise solutions to every problem mentioned in the following books
