The diagram shows the wingspans of different species of birds. Use the diagram to answer the question given below:
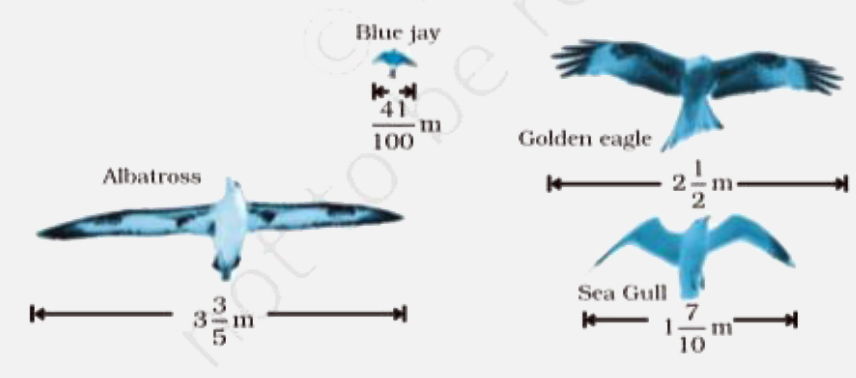
(a) How much longer is the wingspan of an Albatross than the wingspan of a Sea gull?
(b) How much longer is the wingspan of a Golden eagle than the wingspan of a Blue jay?
Step by step video & image solution for The diagram shows the wingspans of different species of birds. Use the diagram to answer the question given below: (a) How much longer is the wingspan of an Albatross than the wingspan of a Sea gull? (b) How much longer is the wingspan of a Golden eagle than the wingspan of a Blue jay? by Maths experts to help you in doubts & scoring excellent marks in Class 8 exams.
Related Playlists
- BOOK - NCERT EXEMPLARCHAPTER - RATIONAL NUMBERS EXERCISE - Games and Puzzles1videos
RATIONAL NUMBERS
- BOOK - NCERT EXEMPLARCHAPTER - RATIONAL NUMBERS EXERCISE - Think and Discuss1videos
RATIONAL NUMBERS
- BOOK - NCERT EXEMPLARCHAPTER - RATIONAL NUMBERS EXERCISE - Exercise (true(T) or false (F))52videos
RATIONAL NUMBERS
- BOOK - NCERT EXEMPLARCHAPTER - PLAYING WITH NUMBERS EXERCISE - Think and Discuss1videos
PLAYING WITH NUMBERS
- BOOK - NCERT EXEMPLARCHAPTER - SQUARE - SQUARE ROOT AND CUBE-CUBE ROOTEXERCISE - Exercise52videos
SQUARE - SQUARE ROOT AND CUBE-CUBE ROOT
Knowledge Check
- Question 1 - Select One
The bar graph shows the debt of different countries. Study the diagram and answer the following questions.
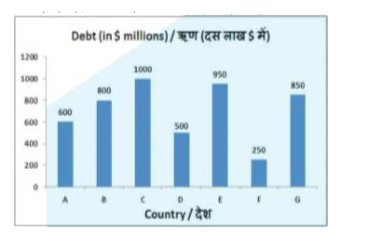
Debt of country A is lesser than that of country B by ___________.A20%B25%C33.33%D30% - Question 1 - Select One
The diagram shows an iceberg. Answer the following questions relating to it.
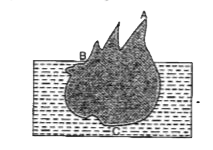
How much of the iceberg has a weight equal to the buoyant force ?Aall of itBthe section from A to B.Cthe section from A to C.Dnone of the above - Question 1 - Select One
The bar graph shows the monthly profits of the different departments of a company. Study the diagram and answer the following questions.
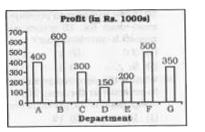
The monthly profit of department B is greater than that of department F by _____.A25%B30%C33.3%D20% - Question 1 - Select One
The bar graph shows the population of different countries. Study the diagram and answer the following questions.
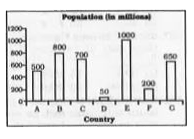
If country D spends $120 per person on health annually, then how much does it spend (in $ millions) on health on its entire population?A6000B600C2400D240 - Question 1 - Select One
The circle graph given here shows the spendings of a country on various sports during a particular year, study the graph carefully and answer the questions given below it.
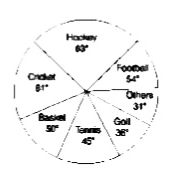
How much per cent more is spent on Hockey than that on golf?A27%B35%C37.5%D75% - Question 1 - Select One
The circle - graph given here shows the spendings of a country on various sports during a prticular year. Study the graph carefully and answer the questions given below It .
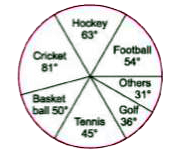
How much percent more is spent on Hockey than that on Golf?A27%B35%C37.5%D75% - Question 1 - Select One
The circle graph given here shows the spendings of a country on various sports during a particular year, study the graph carefully and answer the questions given below it.
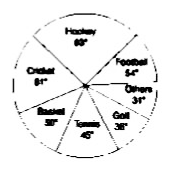
How much percent less is spent on Football than that on cricket?A2229%B27%C3313 %D3712 % - Question 1 - Select One
The pie chart given here shows the spendings of a country on various sports during a particular year. Study the chart carefully and answer the questions given below it.
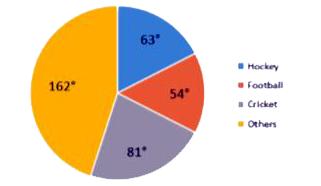
How much percent less is spent on Football than that on Cricket?A33with13%B1212%C2012%D25%
Similar Questions
The Pie Charts shows the expenditure of a country on various sports during a particular year. Study the graph and answer the questions:
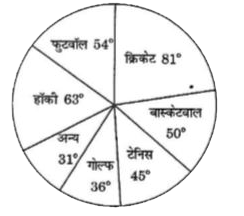
How much per cent more is spent on Hockey than that on Golf ?
View SolutionThe given pie chart shows expenditure on different type of sport in a particular year. Study the pie chart and answer the question below
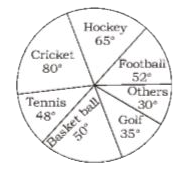
Expenditure on hockey was how much percent more than expenditure on basketball.View Solution

