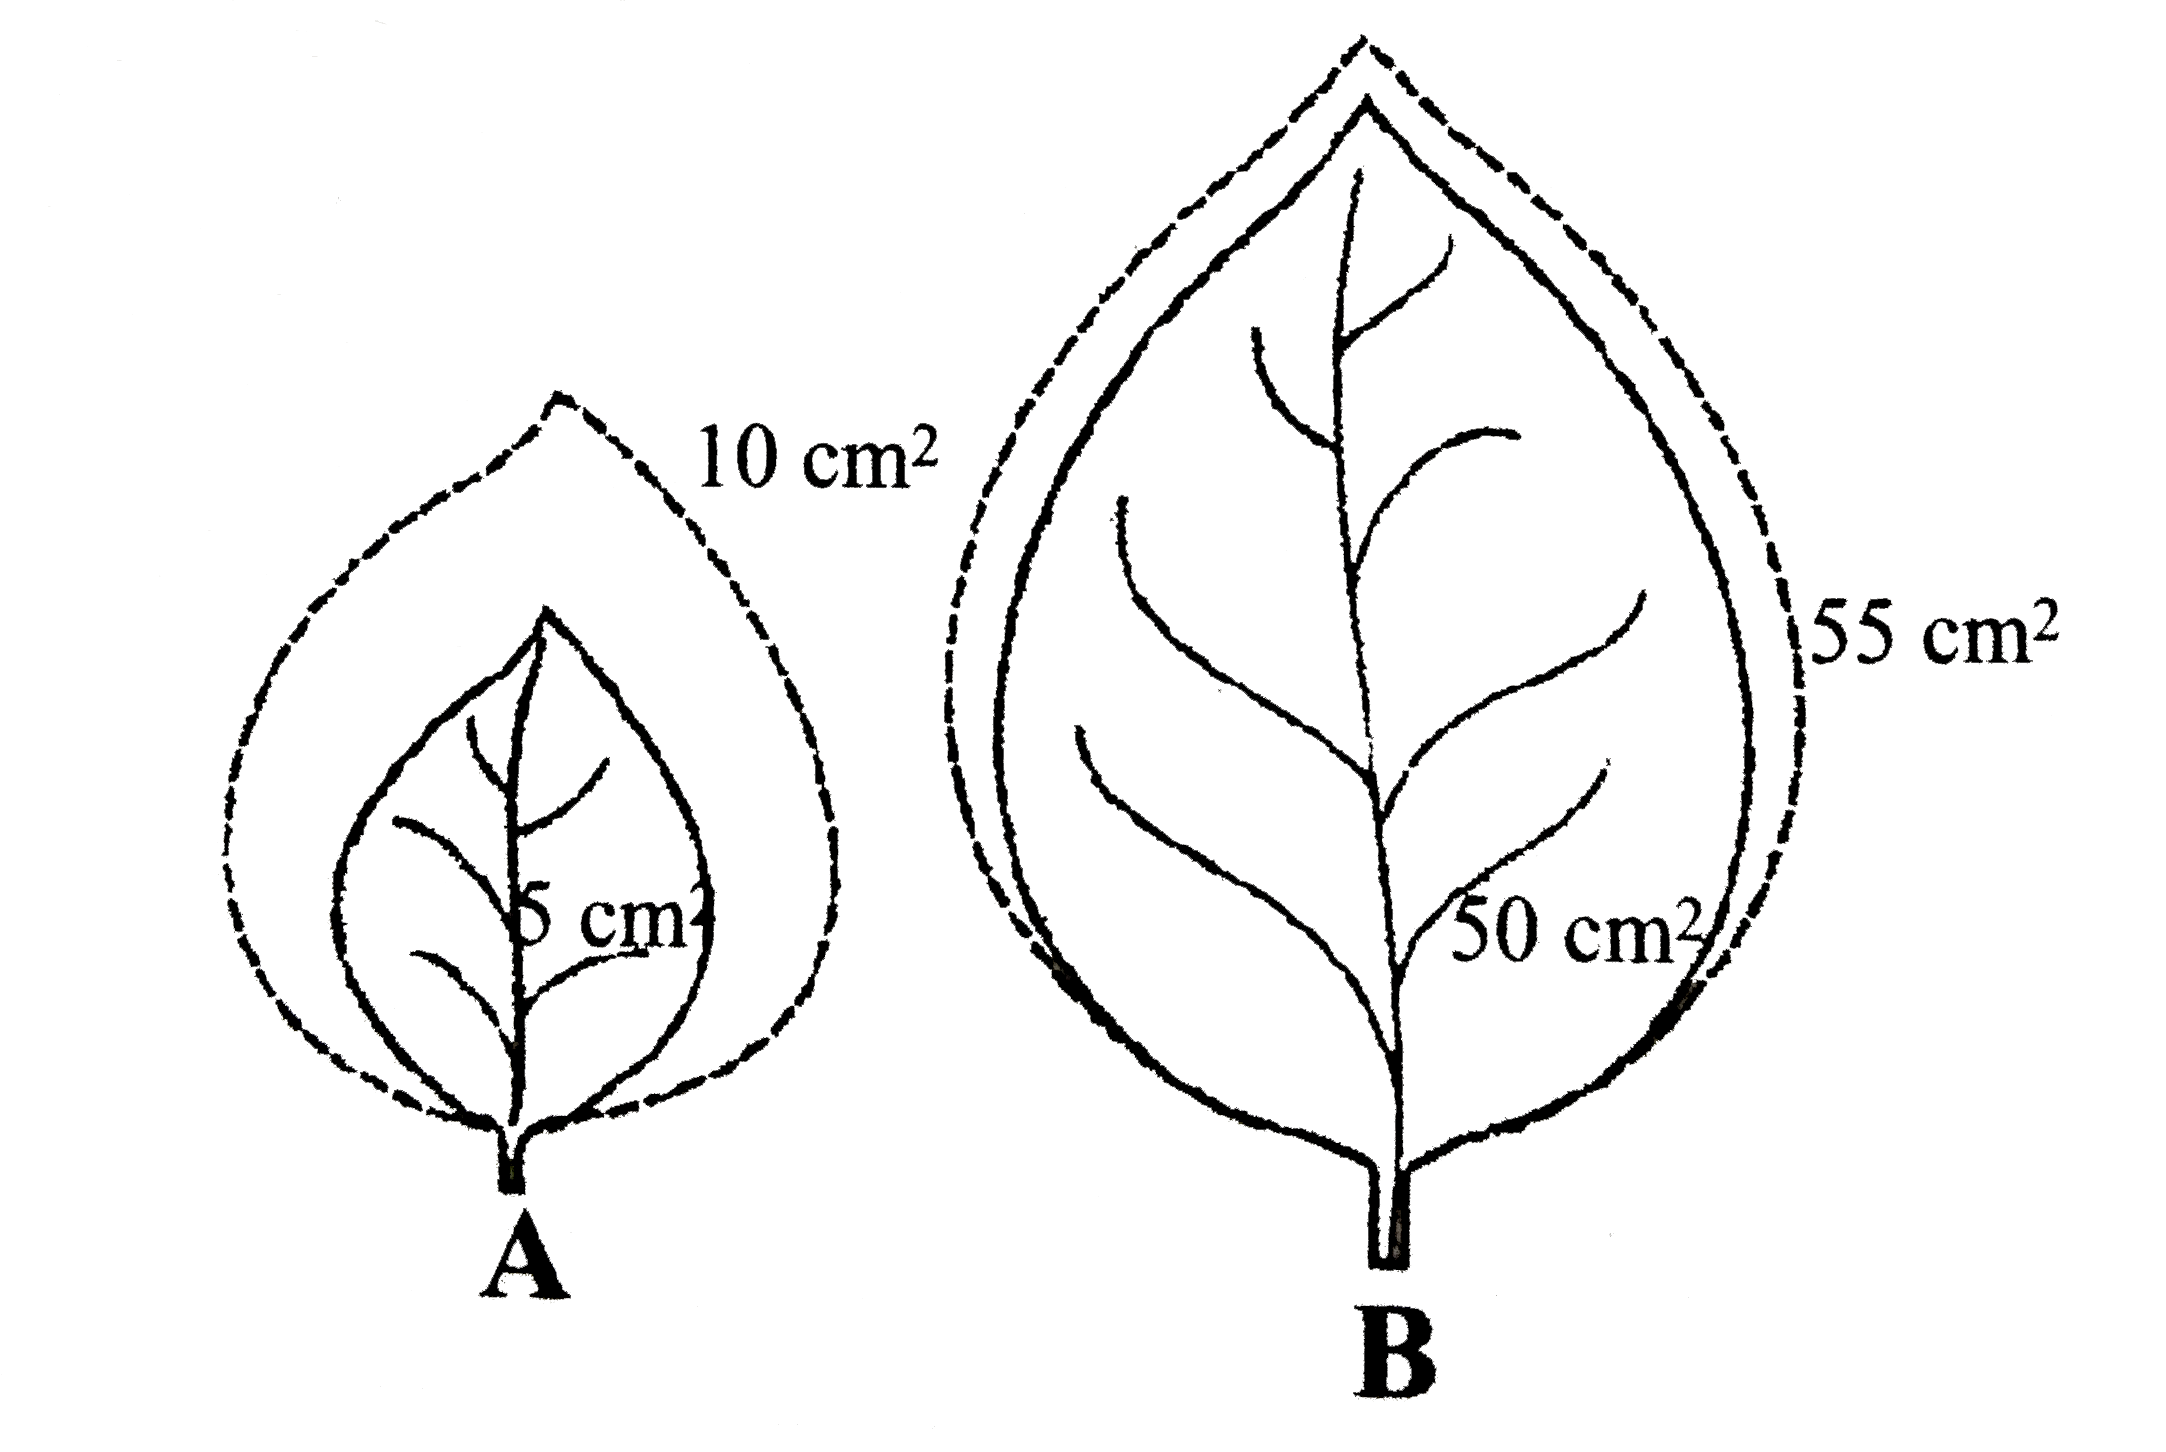
The given figure shows growth of two leaves over the period of one day. If AG= absolute growth and RGR= relative growth rate, then select the correct option.

AGfor leafARGRfor leafAAGfor leafBRGrfor leafB1%12%2
AGfor leafARGRfor leafAAGfor leafBRGrfor leafB100%510%5
AGfor leafARGRfor leafAAGfor leafBRGrfor leafB5100%510%
AGfor leafARGRfor leafAAGfor leafBRGrfor leafB5100%5100%
The correct Answer is:C
Absolu7te growth rate (AGR): increase in total growth of two organs or organisms is measured and comparison of total growth per unit time is called absolute growth. Absolute growth rate is the total growth per unti time.
Relative growth rate (RGR): It is growth per unit time per unit initial growth.
RGR=Growth in given time periodMeasurement at start of time period
AG of leat A=10cm2−5cm2=5cm2
RGR for leaf A=55×100=100%
AG for leaf B=55cm2−50cm2=5cm2
RGR for leaf B=550×100=10%
Though the absolute growth is same for both the leaves (A and B), relative rate of growth is more in leaf A because of its initial small size.
Topper's Solved these Questions
- BOOK - NCERT FINGERTPS ENGLISHCHAPTER - PLANT GROWTH AND DEVELOPMENTEXERCISE - Plant growth regulators70videos
PLANT GROWTH AND DEVELOPMENT
- BOOK - NCERT FINGERTPS ENGLISHCHAPTER - PLANT GROWTH AND DEVELOPMENTEXERCISE - Photoperiosim8videos
PLANT GROWTH AND DEVELOPMENT
- BOOK - NCERT FINGERTPS ENGLISHCHAPTER - PHOTOSYNTHESIS IN HIGHER PLANTSEXERCISE - Photosynthesis In Higher Plants136videos
PHOTOSYNTHESIS IN HIGHER PLANTS
- BOOK - NCERT FINGERTPS ENGLISHCHAPTER - PLANT KINGDOMEXERCISE - Plant Kingdom160videos
PLANT KINGDOM
Similar Questions
Knowledge Check
- Question 1 - Select One
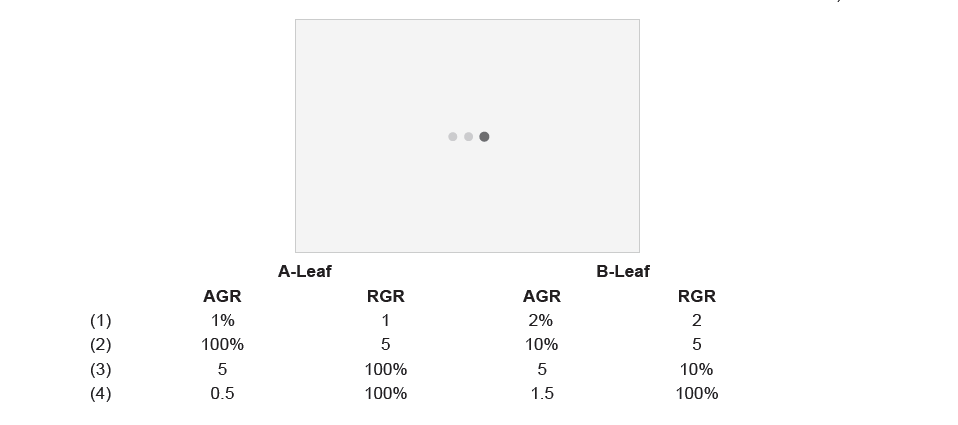
In the leaf A and B what is the value of AGR (average growth rate) and RGR (relative growth rate)
 A1B2C3D4
 - Question 2 - Select One
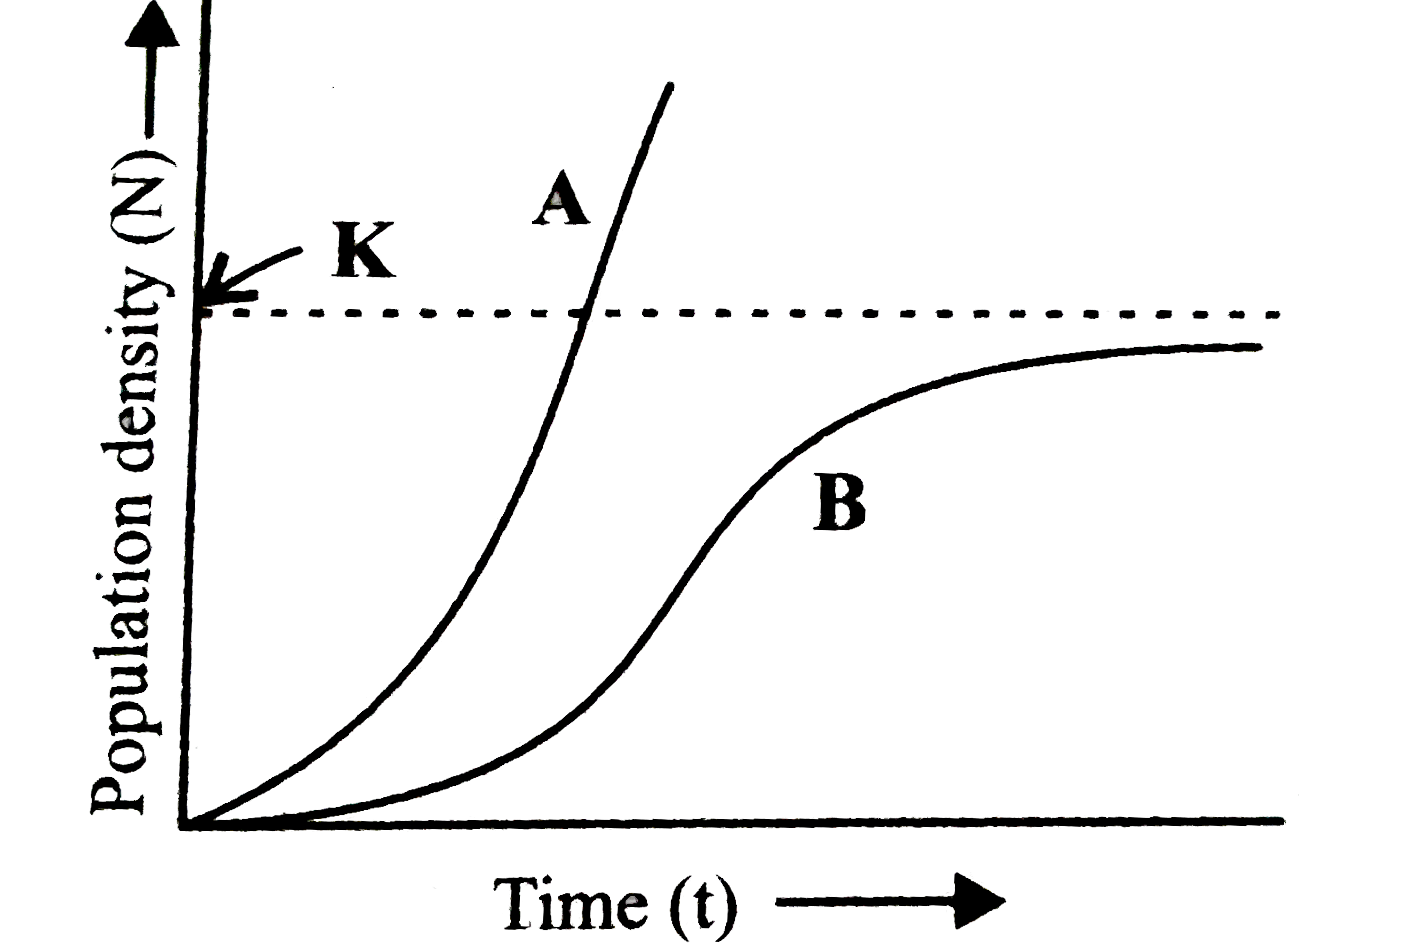
Study the population growth curves (A and B) in the given graph and select the incorrect option.
 ACurve 'A' shows exponential growth, represented by equation dNdt=rN.BCurve 'B' shows logistic growth, represented by equation dNdt=rN(K−NK)CExponential growth curve is considered as more realistic than the logistic growth curve.DCurve 'A' can also be represented by equation Nt=N0ert.
 - Question 3 - Select One
Study the population growth curves (A and B) in the given graph and select the incorrect option.
 ACurve 'A' shows exponential growth, represented by equation dNdt=rN.BCurve 'B' shows logistic growth, represented by equation dNdt=rN(K−NK)CExponential growth curve is considered as more realistic than the logistic growth curve.DCurve 'A' can also be represented by equation Nt=N0ert.
Go through the population growth formula
dNdt=rN
Now select the correct option -View SolutionObserve the given population growth formula
dNdt=rN
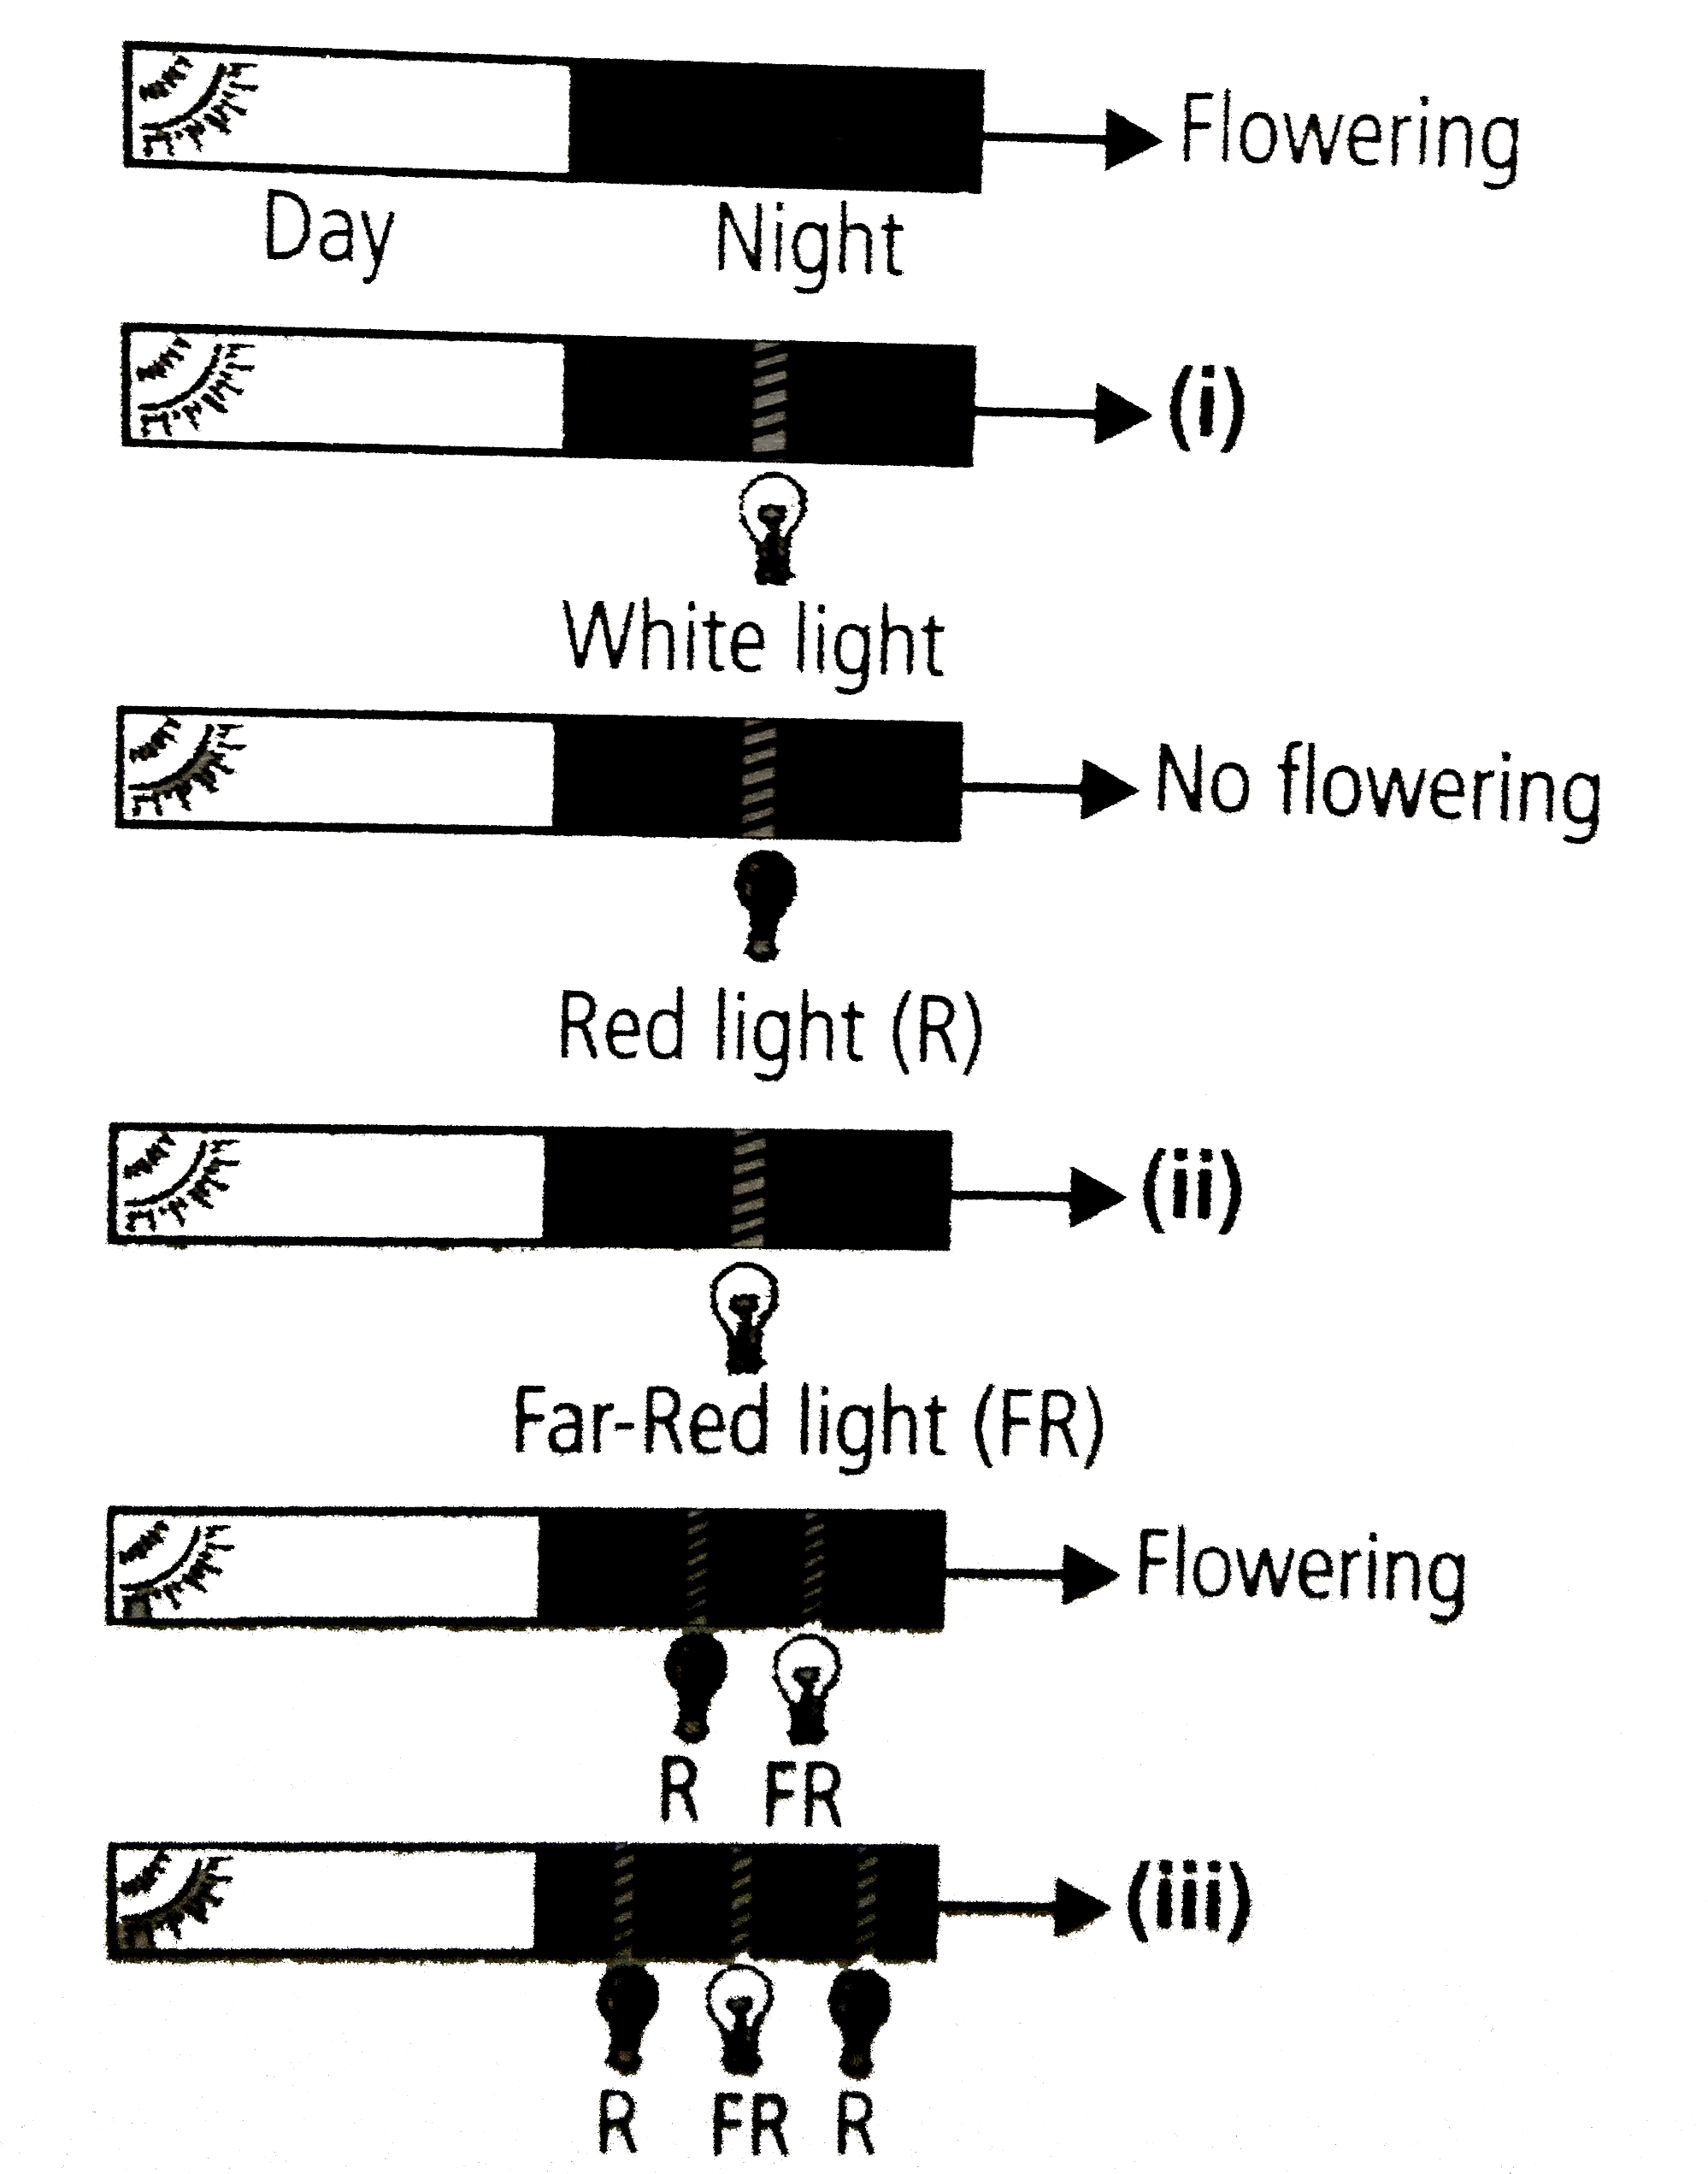
Now selecte the correct option.View SolutionGiven figure shows the effect of interruption of skotoperiod (dark period) in a short day plant by light of different types.

Select the correct option for (i),(ii) and (iii).View SolutionGiven figure shows the effect of interruption of skotoperiod (dark period) in a short day plant by light of different types.

Select the correct option for (i),(ii) and (iii).View SolutionA primary root grows from 5 cm to 19 cm in a week. Calculate the absolute growth rate (AGR) and relative growth rate (RGR) over the period.
View Solution
