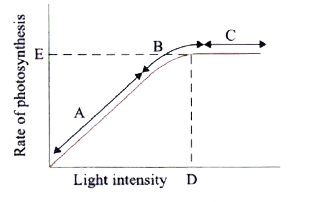
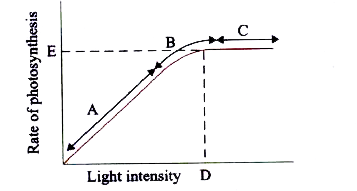
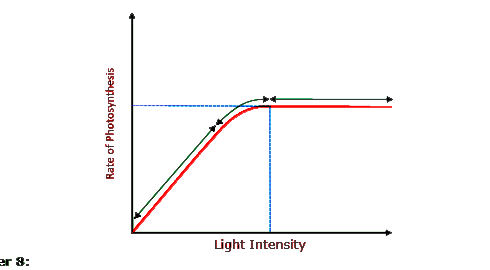
The figure shows the effect of light on the rate of photosynthesis. Based on the graph, answer the following questions :
What do region C and D represent on the curve ?
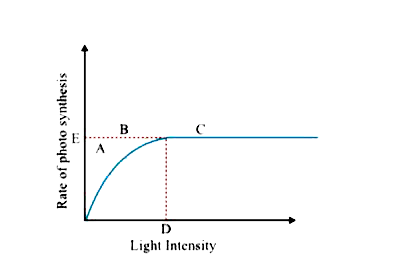
‘C’ represents to constant rate of photosynthesis, ‘D’ is the light saturation intensify at which rate of photosynthesis is maximum.
Topper's Solved these Questions
- BOOK - CBSE COMPLEMENTARY MATERIALCHAPTER - PHOTOSYNTHESIS IN HIGHER PLANTS EXERCISE - Long Answer Questions1videos
PHOTOSYNTHESIS IN HIGHER PLANTS
- BOOK - CBSE COMPLEMENTARY MATERIALCHAPTER - PHOTOSYNTHESIS IN HIGHER PLANTS EXERCISE - Short Answer Questions-I6videos
PHOTOSYNTHESIS IN HIGHER PLANTS
- BOOK - CBSE COMPLEMENTARY MATERIALCHAPTER - NEURAL CONTROL AND COORDINATIONEXERCISE - Short Answer Questions-II3videos
NEURAL CONTROL AND COORDINATION
- BOOK - CBSE COMPLEMENTARY MATERIALCHAPTER - PLANT GROWTH AND DEVELOPMENTEXERCISE - SHORT ANSWER QUESTION - II5videos
PLANT GROWTH AND DEVELOPMENT
Similar Questions
Figure shows the effect of light on the rate of photosynthesis.
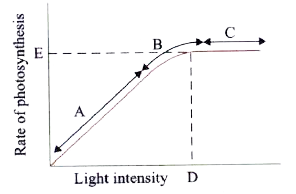
Based on the graph, answer the following questions.
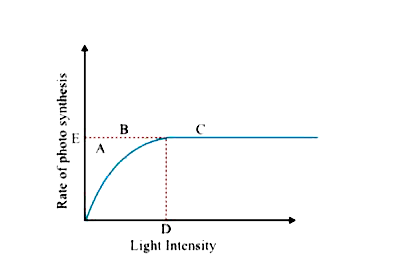
What do C and D represent on the curve?View SolutionThe figure shows the effect of light on the rate of photosynthesis. Based on the graph, answer the following questions :
What could be the limiting factor(s) in region A ?
 View Solution
Knowledge Check
- Question 1 - Select One
Study the given graph showing the efect of light intensity on the rate of photosynthesis. Which of the following statemetns regarding this is correct?
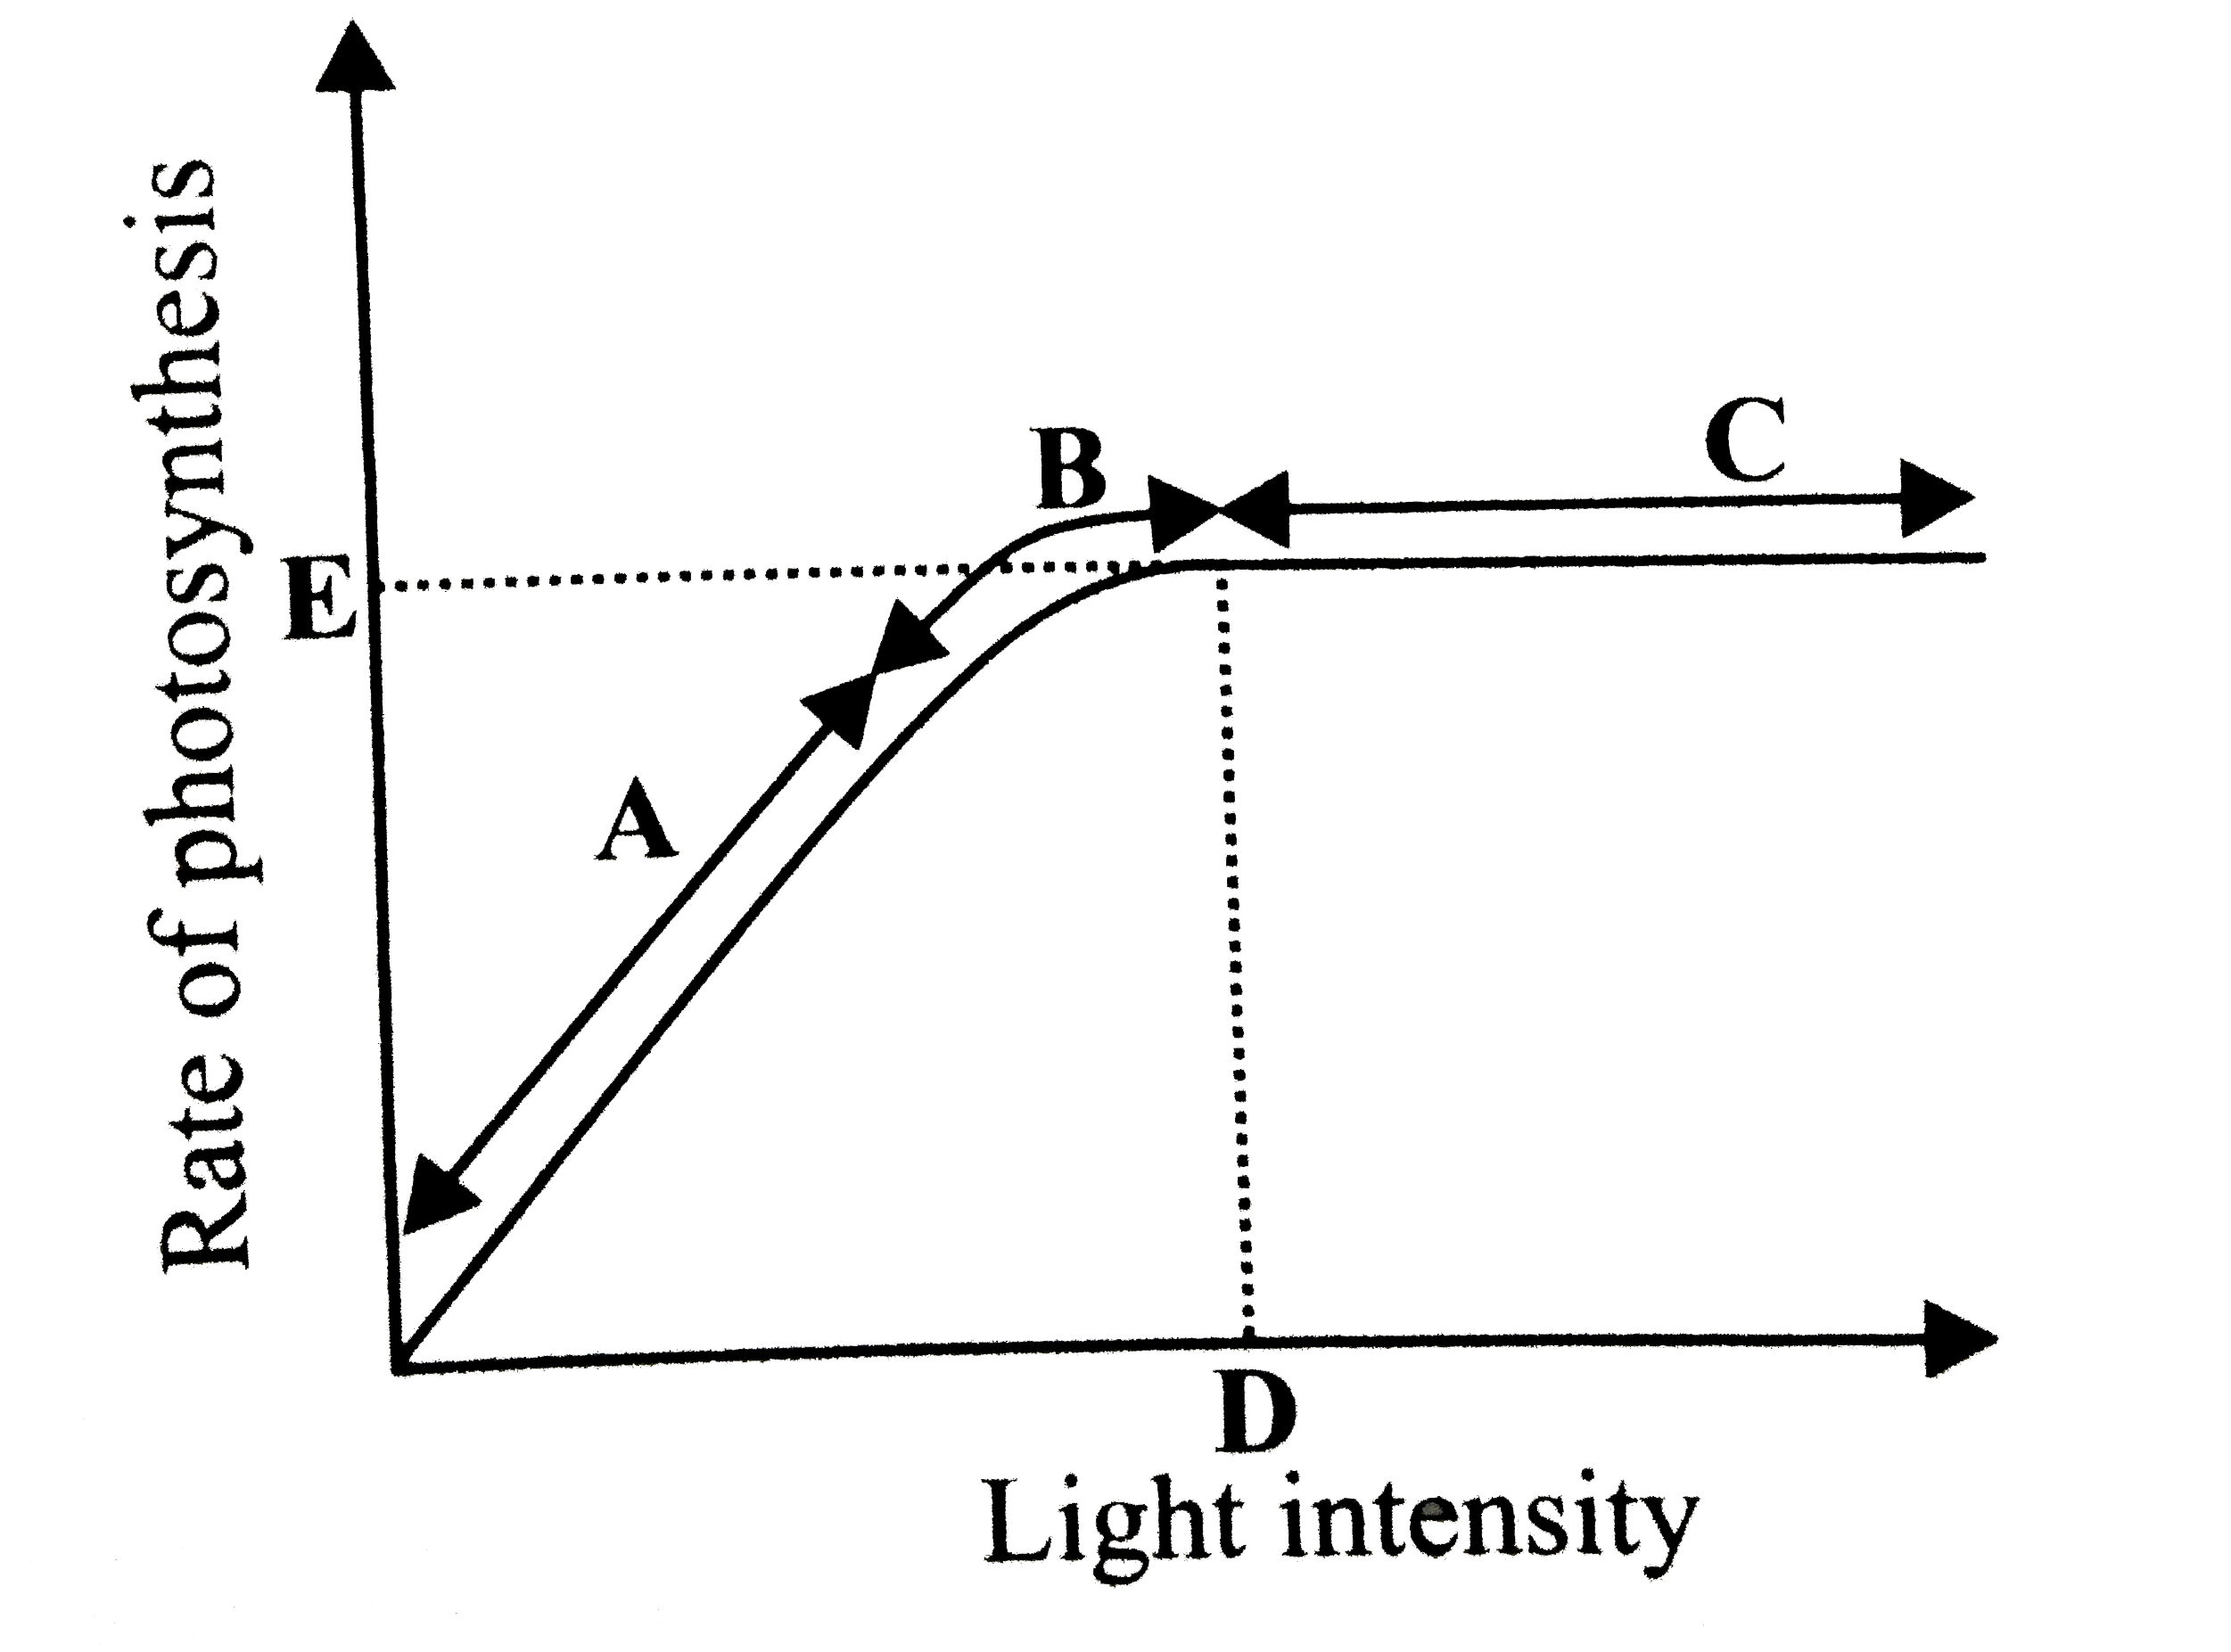 ALight is a limiting factor in the region a.BRegion C represents that rate of photosynthesis is because some other factor became limiting.Cpoint D rrepresents the intensity of light at which some other factor became limitingDAll of these
Figure shows the effect of light on the rate of photosynthesis.
Based on the graph, answer the following questions.
What would be the limiting factors in region A?View SolutionFigure shows the effect of light on the rate of photosynthesis.
Based on the graph, answer the following questions.
At which point/s (A, B, or C) in the curve is light a limiting factor?View SolutionFigure shows, the effect of light on the rate of photosynthesis Based on the graph, answer the following questions.
a) At which points (A,B or C) in the curve is light a limiting factor?
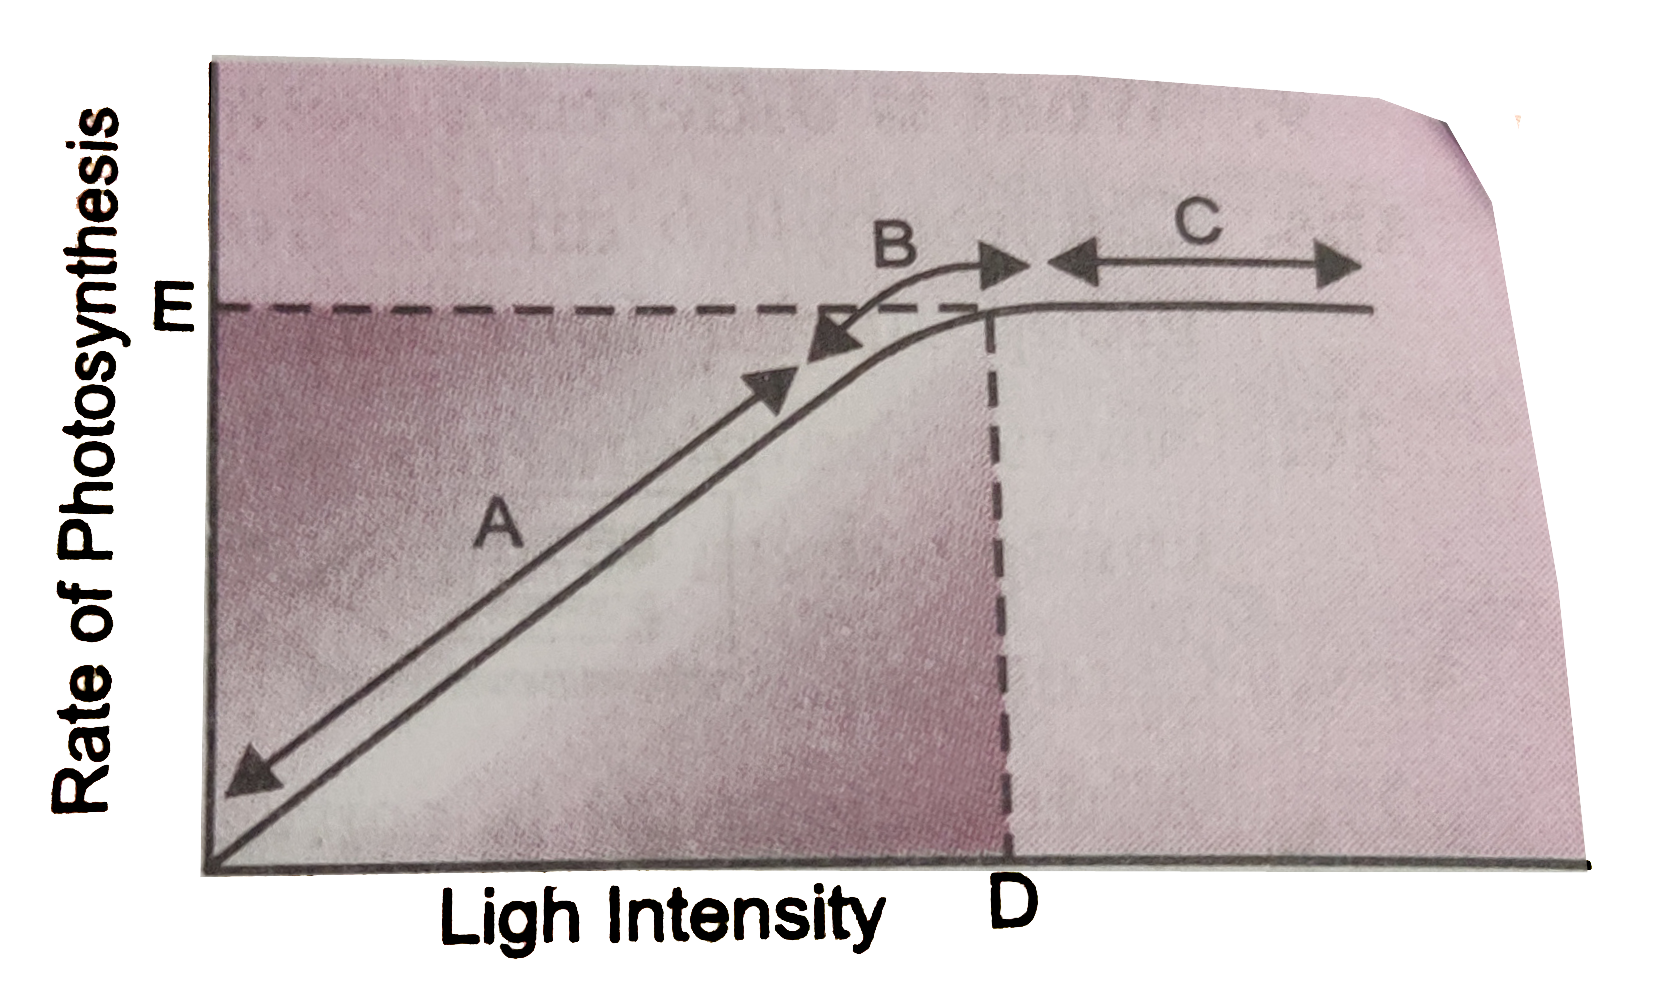
b) What could be the limiting factor/s in region A?
c) What do C and D represent on the curve?View SolutionFigure 13.10 shows the effect of light on the rate of photosynthesis. Based on the graph, answer the following questions:
(a) At which point/s (A, B or C) in the curve is light a limiting factor?
(b) What could be the limiting factor/s in region A?
(c) What do C and D represent on the curve?
 View Solution
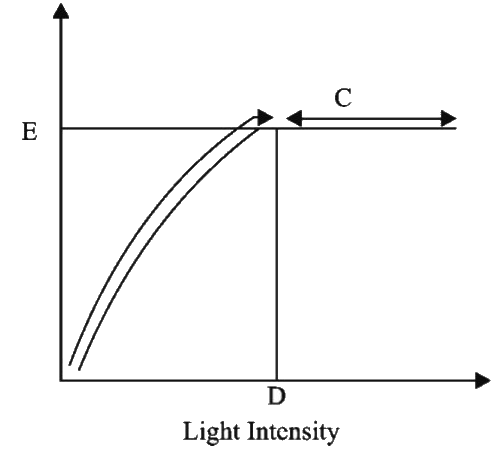
Based on the below diagram, answer the following question.
What do labels C and D denote?View SolutionFigure given below shows the effect of light on the role of photosynthesis. Based on graph
What could be the limiting factor/factors in region A?View SolutionFigure given below shows the effect of light on the role of photosynthesis. Based on graph
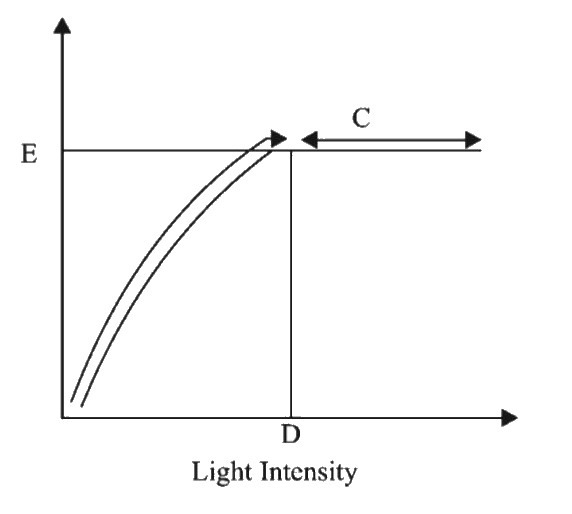
At which point/points (A,B or C) in the curve light is a limiting fac- tor?View Solution
